Key Points
Endogenous intronic long terminal repeats promote the ectopic expression of truncated ERBB4 transcripts in 24% of ALK-negative ALCL.
The expression of ERBB4-aberrant transcripts defines a new subclass of ALK-negative ALCL and may contribute to ALCL transformation.
Abstract
Anaplastic large-cell lymphoma (ALCL) is a clinical and biological heterogeneous disease that includes systemic anaplastic lymphoma kinase (ALK)-positive and ALK-negative entities. To discover biomarkers and/or genes involved in ALK-negative ALCL pathogenesis, we applied the cancer outlier profile analysis algorithm to a gene expression profiling data set including 249 cases of T-cell non-Hodgkin lymphoma and normal T cells. Ectopic coexpression of ERBB4 and COL29A1 genes was detected in 24% of ALK-negative ALCL patients. RNA sequencing and 5′ RNA ligase-mediated rapid amplification of complementary DNA ends identified 2 novel ERBB4-truncated transcripts displaying intronic transcription start sites. By luciferase assays, we defined that the expression of ERBB4-aberrant transcripts is promoted by endogenous intronic long terminal repeats. ERBB4 expression was confirmed at the protein level by western blot analysis and immunohistochemistry. Lastly, we demonstrated that ERBB4-truncated forms show oncogenic potentials and that ERBB4 pharmacologic inhibition partially controls ALCL cell growth and disease progression in an ERBB4-positive patient-derived tumorgraft model. In conclusion, we identified a new subclass of ALK-negative ALCL characterized by aberrant expression of ERBB4-truncated transcripts carrying intronic 5′ untranslated regions.
Introduction
Anaplastic large-cell lymphoma (ALCL) is a clinically and biologically heterogeneous subtype of T-cell lymphoma accounting for about 12% of all T-cell non-Hodgkin lymphomas (T-NHLs).1 Originally described by Stein et al2 in 1985 as ALCL expressing CD30, its definition and relationship with other T-NHLs has undergone frequent revisions.1,3,4 On the basis of genetic and clinical features, 2 different entities of ALCL are recognized as systemic forms: anaplastic lymphoma kinase (ALK) positive and ALK negative.1,5-7 ALK-positive ALCL is characterized by chromosomal translocations involving the ALK gene, which lead to the expression and the constitutive activation of ALK fusion proteins.8,9 However, the molecular pathogenesis of ALK-negative ALCL remains poorly understood, and unequivocal immunophenotypic or genetic hallmarks are limited.10,11
It is known that ALK-negative ALCL occurs in older patients displaying worse overall responses to aggressive chemotherapy as compared to ALK-positive ALCL. Nevertheless, when ALCL patients are stratified according to age and/or stage, ALK-positive and ALK-negative individuals have similar prognoses.12,13 Of importance, a significant difference in failure-free and overall survival (OS) rates exists between peripheral T-cell lymphoma not otherwise specified (PTCL-NOS) and ALK-negative ALCL patients (5-year failure-free survival rate, 36% vs 20%; 5-year OS, 49% vs 32%), suggesting the need for a clear pathologic distinction.5
Several gene expression profiling (GEP) studies indicated that ALK-positive and ALK-negative ALCL display a common signature, thus supporting a shared origin for ALCL.14-18 However, a 3-gene model (TNFRSF8, BATF3, TMOD1) has been validated to separate ALK-negative ALCL from PTCL-NOS, including CD30+ PTCL-NOS.11 ALK-negative ALCL samples show a more complex genome compared to ALK-positive samples.19 Accordingly, TP53 and PRDM1 losses are more common in ALK-negative than in ALK-positive ALCL samples. Over the last few years, chromosomal rearrangements of DUSP22 and TP63 have been identified in a subset of ALK-negative ALCL.20-22 Heterogeneity of ALK-negative ALCL has been very recently further corroborated by the recognition of more than 20 sporadic fusion transcripts and the presence of recurrent JAK1 and STAT3 somatic mutations in a subset of ALK-negative ALCL.23
In the present study, we identified ERBB4 and COL29A1 genes as specific outliers coexpressed in a distinct subset (∼25%) of ALK-negative ALCL patients. Notably, ERBB4 deregulation was characterized by the expression of 2 truncated transcripts with intronic transcription start sites (TSSs). We demonstrated that ERBB4-truncated forms show oncogenic potentials in vitro and in vivo and that ERBB4 inhibition partially controls ALCL cell growth and disease progression in a primary ERBB4-positive patient-derived tumorgraft (PDT) model.
Methods
Detailed experimental procedures for RNA extraction, quantitative reverse-transcription (qRT) polymerase chain reaction (PCR), droplet digital PCR (ddPCR), RNA sequencing, virus production, transformation, luciferase, cell viability, terminal deoxynucleotidyl transferase deoxyuridine triphosphate nick-end labeling, western blot, immunohistochemistry, fluorescence-activated cell sorting, and patient survival analyses are included in supplemental Material and Methods, available on the Blood Web site. Primers used are outlined in supplemental Table 1.
Patients and case selection
Cryopreserved samples of T-NHL were provided by the European T-Cell Lymphoma Study Group.11 Samples were selected on the basis of stringent criteria: (1) lymph node biopsy site, (2) presence of 50% neoplastic cells, and (3) good RNA preservation. ALCL cases were characterized by CD30 messenger RNA (mRNA) expression, high neoplastic cell content, T-cell associated/restricted markers, granzyme B positivity, and PAX-5 negativity. Paraffin-embedded and formalin-fixed tumor samples of PTCL-NOS and ALCL were from our archive. All samples were obtained at the time of diagnosis, before treatment. ALCL cases were submitted to immunophenotyping and central pathologic review by a panel of 4 expert hematopathologists (supplemental Table 2). Final diagnoses were assigned according to the criteria of the World Health Organization classification.24 Unclassifiable cases were excluded from the study. Informed consent was obtained from all enrolled patients after the procedures were approved by the local ethical committees of each participating institution.
COPA
Cancer outlier profile analysis (COPA) was performed according to Tomlins et al25 using 5 T-NHL expression data sets (Gene Expression Omnibus repository accession number GSE65823).11,26 Briefly, probe sets with standard deviation <0.5 or with absent call (defined as robust multiarray average <5) in more than 80% of the patients were filtered out. Robust multiarray average expression values were median centered, setting each gene’s median expression value to 0, and normalized by dividing each gene expression value by its median absolute deviation (MAD). The 75th, 90th, and 95th percentiles of the transformed expression values were tabulated for each gene to be used as COPA scores. Furthermore, the area under the curve of normalized expression values of outliers was computed as the COPA–area-under-the-curve score. Outliers were defined as those samples with normalized expression values exceeding 5 MAD units. Genes were rank ordered by their scores, providing prioritized lists of outlier profiles. The top 100 probe sets according to the different COPA types were plotted in histograms, with the y-axis showing normalized expression values in MAD units.
RLM-RACE
5′ RNA ligase-mediated rapid amplification of complementary DNA (cDNA) ends (RLM-RACE) (FirstChoice RLM-RACE Kit; Ambion) was used to amplify cDNA from full-length capped mRNA, according to the manufacturer’s instructions. To amplify the 5′ end of ERBB4 transcripts, a random-primed reverse-transcription reaction and 2 nested touchdown PCRs were performed. The reaction was carried out for 40 cycles using the primers described in supplemental Table 1. PCR products were cloned into pCRII-TOPO vector using the TOPO TA Cloning Kit (Invitrogen) and sequenced bidirectionally (GenBank accession numbers KT281867 and KT310076).27
Plasmid constructs
ERBB4 13-28 CYT1 (I12ΔC1), ERBB4 13-28 CYT2 (I12ΔC2), ERBB4 21-28 CYT1 (I20ΔC1), and ERBB4 21-28 CYT2 (I20ΔC2) were amplified by PCR from an ERBB4-positive sample using specific primers and cloned into pENTR1A no ccdB vector (Eric Campeau, http://ericcampeau.com/). Lentiviral expression vectors pDestPGK ERBB4 13-28 CYT1, pDestPGK ERBB4 13-28 CYT2, pDestCMV/TO ERBB4 13-28 CYT1, pDestCMV/TO ERBB4 13-28 CYT2, pDestPGK ERBB4 21-28 CYT1, and pDestPGK ERBB4 21-28 CYT2 were generated by Gateway recombination (Gateway System, Invitrogen). I12ΔERBB4 kinase dead mutant (I12ΔK751M) was generated using QuikChange II Site-Directed Mutagenesis Kit (Stratagene, La Jolla, CA). The following plasmids were used for wild-type ERBB4, green fluorescent protein (GFP), and nucleophosmin (NPM)-ALK expression: pCDF1-ERBB4 WT (plasmid #29536; Addgene); pLenti CMV GFP Puro (plasmid #17448; Addgene); and Pallino-NPM-ALK-GFP, respectively.28
Cell culture conditions, transfections, and compounds
HEK-293T and NIH-3T3 (DSMZ ACC-59) cells were cultured under standard conditions (37°C in humidified atmosphere, with 5% carbon dioxide) in Dulbecco’s modified Eagle medium (EuroClone) supplemented with 10% fetal calf serum (Lonza), 2 mM glutamine, 100 U/mL of penicillin, and 100 μg/mL of streptomycin (Eurobio Biotechnology). Transfections were performed with Effectene Transfection Reagent (Qiagen), according to the manufacturer’s instructions.
Lapatinib was obtained from Selleckchem (S2111; Houston, TX), and neratinib (HKI-272) from LC Laboratories (N-6404; Woburn, MA).
Mice
NIH-3T3 cells (5 × 10⁴) suspended in phosphate-buffered saline (PBS)–50% Matrigel (BD Biosciences, Sparks, MD) were injected subcutaneously into the left and right flanks of 15 NOD/SCID/IL2Rγ−/− (NSG) mice. Tumor growth was monitored over time by determining the volume of tumor masses. The mice were euthanized at early sign of distress or at experiment’s conclusion (4 weeks). PDTs were established from fresh tissue fragments of an ERBB4-positive ALCL patient. Briefly, tumor samples were cut into multiple 3 mm × 3 mm × 1 mm pieces (multiple pieces per specimen) and implanted subcutaneously in NSG mice previously anesthetized intramuscularly with xylazine (0.05 μg/µL) and tiletamine/zolazepam (1.6 μg/μL). Recipient animals were checked regularly and euthanized after the tumor masses reached a volume of approximately 1500 mm3. At harvesting, mice were euthanized in a carbon dioxide chamber, and grafts were collected for histologic evaluation, regrafting, or snap-freezing in liquid nitrogen. PDT purified cells (5 × 10⁴) were injected subcutaneously into the flanks of 6 NSG mice. Mice with tumor masses of 0.5 cm diameter were treated with neratinib by oral administration (40 mg/kg every 48 hours) or with control diluent (30% polyethylene glycol 400, 0.5% Tween 80, 5% propylene glycol), then euthanized after 14 days of treatment. Animals were housed in the animal facility of the University of Turin and treated in accordance with guidelines approved by the local Ethical Animal Committee (protocol number 0081521).
PDT cell purification
Tumor masses derived from NSG mice were washed in PBS and cut into 1-mm3 pieces. The material was digested in PBS with 0.2% collagenase A (Roche) and 0.4% ialuronidase (Sigma), for 45 minutes at 37°C with shaking. Cell suspension was filtered through a 40-mm cell strainer, washed, and layered over a Ficoll-Paque. Isolated cells were washed and plated 1 × 10⁶/mL in RPMI 1640 (EuroClone) supplemented with 20% fetal calf serum (Lonza), 2 mM glutamine, 100 U/mL of penicillin, 100 μg/mL of streptomycin (Eurobio Biotechnology), and 100 U/mL of interleukin 2.
Statistical analysis
Mann-Whitney-Wilcoxon rank-sum test was used to assess differences in the distribution of sample populations. Student t test was used for tumor growth assays. Specifically, the difference between the 2 slopes divided by the standard error of the difference between the slopes was computed. All calculations were performed in R software (http://www.R-project.org). A difference was considered statistically significant when the P value was <.05(*), <.01 (**), or <.001 (***).
Results
Identification of ERBB4 and COL29A1 as specific outliers in ALK-negative ALCL
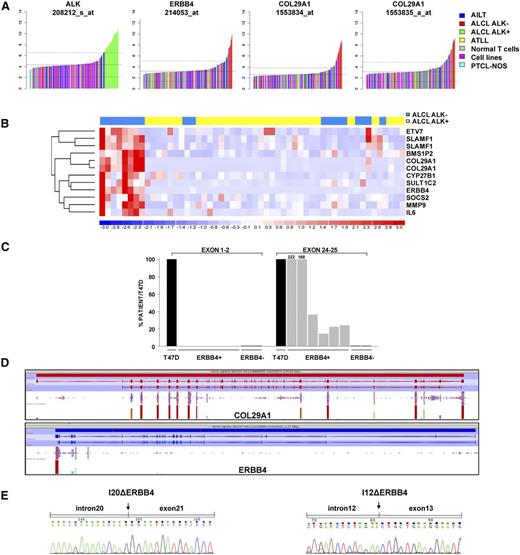
To discover genes potentially related to the pathogenesis of ALK-negative ALCL patients, we applied the COPA algorithm25 to a GEP data set including 249 cases of T-NHL and normal T-cells.11,15,16,29,30 COPA correctly identified ALK as an outlier in all ALK-positive ALCL samples (supplemental Figure 1; Figure 1A). Among the top 12 ranking outlier genes of ALK-negative ALCL samples (supplemental Table 3), ERBB4 and COL29A1 were exclusively expressed in 8 of 24 ALK-negative ALCL cases (supplemental Figure 2; Figure 1A).Of interest, ERBB4 and COL29A1 were coexpressed in the same tissue samples (Figure 1B). Differential analyses comparing ERBB4/COL29A1–positive vs ERBB4/COL29A1–negative ALCL (including either ALK-positive ALCL or ALK-negative ALCL, or both groups) confirmed the presence of a specific signature in ERBB4-positive patients. Of note, comparison of ERBB4/COL29A1–positive to ALK-positive ALCL patients reached the highest significance (q < 0.0076), identifying 48 upregulated and 37 downregulated genes between the 2 categories (supplemental Figures 3-5). This result could be explained by the great heterogeneity of ALK-negative ERBB4-negative samples. The functional category of transcriptional regulators emerged as overrepresented (P < .0035). Gene set enrichment analysis suggested that ERBB4/COL29A1–positive samples share activation of specific pathways such as inflammatory response, tumor necrosis factor–nuclear factor κB, Janus kinase–signal transducer and activator of transcription, cytokine, and angiogenesis (supplemental Figure 6).
Identification of ERBB4 and COL29A1 as specific outliers in ALK-negative ALCL. (A) COPA of T-NHL microarray data revealed ERBB4 and COL29A1 as outlier genes in ALK-negative ALCL. ALK, ERBB4, and COL29A1 expression (normalized expression units) are shown from all profiled samples (data set from Agnelli et al11 ). Sample classes are indicated according to the color scale. Angioimmunoblastic lymphoma (AILT; 41 samples), ALK-negative ALCL (24 samples), ALK-positive ALCL (30 samples), normal T cells (69 samples), PTCL-NOS (74 samples); adult T-cell leukemia/lymphoma (ATLL; 11 samples), cell lines (4 samples). (B) Hierarchical clustering of transcripts correlated to ERBB4 expression in ALCL samples (ALK-positive, yellow; ALK-negative, blue), as revealed by the average linkage method using Euclidean distance. Each column represents a sample, and each row a gene. The color scale bar represents relative gene expression changes, normalized by the standard deviation. Microarray data analysis was performed as described in Piva et al15 . (C) Unbalanced expression of ERBB4 transcripts. Expression of ERBB4 (exons 1-2 and 24-25) was assessed by qRT-PCR in 8 ALCL cases and in the breast cancer cell line T47D, used as a positive control. (D) Distribution of ERBB4 and COL29A1 RNA sequencing reads in a representative ERBB4-positive ALCL case. (E) Electropherograms of 2 ERBB4-truncated transcripts: I20Δ (exon 21 carrying at 5′ a portion of intron 20 (GRCh37:2:212329687:212330078) and I12Δ (exon 13 carrying at 5′ a portion of intron 12 (GRCh37:2:212558507:212558780). Fragments were identified by RLM-RACE in a representative ERBB4-positive ALCL case. Arrows point to the position of intron-exon junctions.
Identification of ERBB4 and COL29A1 as specific outliers in ALK-negative ALCL. (A) COPA of T-NHL microarray data revealed ERBB4 and COL29A1 as outlier genes in ALK-negative ALCL. ALK, ERBB4, and COL29A1 expression (normalized expression units) are shown from all profiled samples (data set from Agnelli et al11 ). Sample classes are indicated according to the color scale. Angioimmunoblastic lymphoma (AILT; 41 samples), ALK-negative ALCL (24 samples), ALK-positive ALCL (30 samples), normal T cells (69 samples), PTCL-NOS (74 samples); adult T-cell leukemia/lymphoma (ATLL; 11 samples), cell lines (4 samples). (B) Hierarchical clustering of transcripts correlated to ERBB4 expression in ALCL samples (ALK-positive, yellow; ALK-negative, blue), as revealed by the average linkage method using Euclidean distance. Each column represents a sample, and each row a gene. The color scale bar represents relative gene expression changes, normalized by the standard deviation. Microarray data analysis was performed as described in Piva et al15 . (C) Unbalanced expression of ERBB4 transcripts. Expression of ERBB4 (exons 1-2 and 24-25) was assessed by qRT-PCR in 8 ALCL cases and in the breast cancer cell line T47D, used as a positive control. (D) Distribution of ERBB4 and COL29A1 RNA sequencing reads in a representative ERBB4-positive ALCL case. (E) Electropherograms of 2 ERBB4-truncated transcripts: I20Δ (exon 21 carrying at 5′ a portion of intron 20 (GRCh37:2:212329687:212330078) and I12Δ (exon 13 carrying at 5′ a portion of intron 12 (GRCh37:2:212558507:212558780). Fragments were identified by RLM-RACE in a representative ERBB4-positive ALCL case. Arrows point to the position of intron-exon junctions.
To define mechanisms responsible for the aberrant ERBB4 and COL29A1 expression in ALK-negative ALCL, we first verified the features of their transcripts by qRT-PCR. Consistently, all ERBB4-positive cases displayed low or undetectable levels of exons 1-2 as compared to exons 24-25 (Figure 1C). In contrast, no significant imbalance of exon expression was found in COL29A1 mRNA (data not shown). Two drastic changes of ERBB4 expression levels (between exon 20 and 21 and between exon 12 and 13) were identified by exon-walking qRT-PCR in all ERBB4-positive ALCL samples, as compared to the breast carcinoma cell line T47D that showed uniform expression of all ERBB4 exons (supplemental Figure 7). Accordingly, transcriptome sequencing (RNA sequencing) confirmed the coexpression of truncated ERBB4 and full-length COL29A1 in 2 ERBB4-positive ALCL patients (Figure 1D).
Although we cannot exclude an instrumental role for COL29A1, we focused on ERBB4 gene encoding for a tyrosine kinase receptor, which has been found mutated and/or deregulated in several cancer types.31-34 To identify the TSS of ERBB4 transcript(s), we performed RLM-RACE in a representative ERBB4-positive sample. Two ERBB4 intronic regions upstream of exon 21 and 13 were recognized. Specifically, a 385-bp fragment of intron 20, located 33 872 bp upstream of exon 21, was joined to exon 21, and a 274-bp fragment of intron 12, 14 598 base pairs upstream of exon 13, merged with exon 13. We named these altered ERBB4 transcripts I20ΔERBB4 and I12ΔERBB4 (Figure 1E). Consistent with exon-walking qRT-PCR data, ERBB4-positive patients expressed higher levels of I20ΔERBB4 transcripts as compared to I12ΔERBB4 (data not shown). No alternative splicing sites were predicted by bioinformatics tools. Open reading frame analysis identified 2 in-frame starting codons at the beginning of exons 13 and 21 (data not shown). Whole-genome sequencing on 2 ERBB4-positive and 2 ERBB4-negative ALCL patients did not reveal any aberration within the ERBB4 locus (data not shown).
Expression and incidence of ERBB4-truncated transcripts
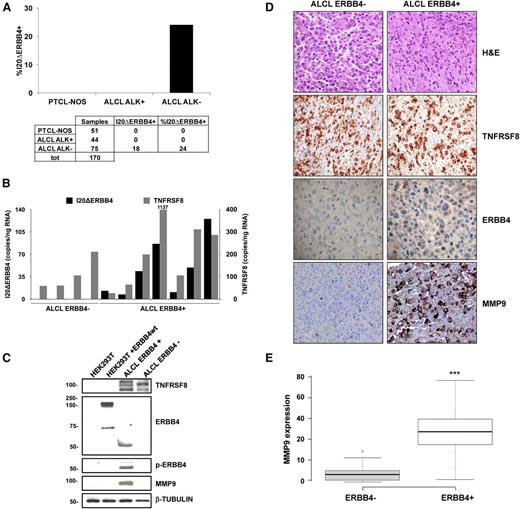
The incidence of aberrant ERBB4 transcripts was verified by qRT-PCR in a validation set of cryopreserved and formalin-fixed T-NHL samples, including 51 PCTL-NOS, 44 ALK-positive ALCL, and 75 ALK-negative ALCL. The I20ΔERBB4 transcript was expressed in 24% of ALK-negative ALCL. In the same patients, I12ΔERBB4 levels were low or undetectable. All PTCL-NOS and ALK-positive ALCL samples were invariably negative, suggesting that ERBB4 expression is specific for a subset of ALK-negative ALCL (Figure 2A). I20ΔERBB4 expression was confirmed and quantified by ddPCR in selected ALK-negative ALCL cases (Figure 2B), suggesting a diagnostic application of ddPCR for the detection of aberrant transcripts in lymphomas.
Expression and incidence of ERBB4-truncated transcripts. (A) Incidence of I20ΔERBB4 expression analyzed by qRT-PCR in a total (tot) of 170 cryopreserved and formalin-fixed and paraffin-embedded T-NHL samples (51 PCTL-NOS, 44 ALK-positive ALCL, and 75 ALK-negative ALCL). (B) Quantification of I20ΔERBB4 and TNFRSF8 transcripts by ddPCR assay in selected ALCL cases. (C) Western blot analysis of the HEK293T cell line transfected with wild-type (wt) ERBB4 and 2 ALCL samples (1 ERBB4-positive and 1 ERBB4-negative). Tissue lysates from an ERBB4-positive sample indicated the expression of a 50-kDa truncated ERBB4 protein, which was highly phosphorylated and correlated to MMP9 expression. (D) Representative hematoxylin and eosin (H&E), TNFRSF8, ERBB4, and MMP9 immunohistochemical staining in an ERBB4-negative and an ERBB4-positive ALCL sample (original magnification ×20). (E) Box plot showing immunohistochemical quantification of MMP9 expression in ALK-negative ALCL patients (8 ERBB4-negative and 7 ERB-positive). Quantitative analysis indicates percentage of anaplastic cells with a score of 3+. Measurements were performed in 3 independent tissue areas (***P < .001). MMP9, matrix metalloproteinase 9; TNFRSF8, tumor necrosis factor receptor superfamily, member 8.
Expression and incidence of ERBB4-truncated transcripts. (A) Incidence of I20ΔERBB4 expression analyzed by qRT-PCR in a total (tot) of 170 cryopreserved and formalin-fixed and paraffin-embedded T-NHL samples (51 PCTL-NOS, 44 ALK-positive ALCL, and 75 ALK-negative ALCL). (B) Quantification of I20ΔERBB4 and TNFRSF8 transcripts by ddPCR assay in selected ALCL cases. (C) Western blot analysis of the HEK293T cell line transfected with wild-type (wt) ERBB4 and 2 ALCL samples (1 ERBB4-positive and 1 ERBB4-negative). Tissue lysates from an ERBB4-positive sample indicated the expression of a 50-kDa truncated ERBB4 protein, which was highly phosphorylated and correlated to MMP9 expression. (D) Representative hematoxylin and eosin (H&E), TNFRSF8, ERBB4, and MMP9 immunohistochemical staining in an ERBB4-negative and an ERBB4-positive ALCL sample (original magnification ×20). (E) Box plot showing immunohistochemical quantification of MMP9 expression in ALK-negative ALCL patients (8 ERBB4-negative and 7 ERB-positive). Quantitative analysis indicates percentage of anaplastic cells with a score of 3+. Measurements were performed in 3 independent tissue areas (***P < .001). MMP9, matrix metalloproteinase 9; TNFRSF8, tumor necrosis factor receptor superfamily, member 8.
Tissue lysates from an ERBB4-positive sample indicated the expression of a 50-kDa truncated ERBB4 protein, highly phosphorylated in tyrosine 1284 (Figure 2C). Immunohistochemical analysis of 15 ALCL samples detected ERBB4 expression in 5 of 7 ERBB4-positive samples (Figure 2D). According to GEP data (Figure 1B), ERBB4 positivity was highly correlated with increased immunohistochemical MMP9 staining (Figure 2D-E).
ERBB4-positive ALCL patients had OS rates inferior to those with ALK-positive ALCL (95% confidence interval, 140-185 vs 27-100, respectively; log rank, 5.609; P = .018; supplemental Figure 8). Conversely, their OS rates did not differ significantly from patients with ALK-negative ALCL. Moreover, failure-free survival resulted in similar rates between ERBB4-positive and ERBB4/ALK double-negative patients, confirming the classic outcome of ALK-negative ALCL.
Of interest, 6 of 9 ERBB4-positive cases showed a Hodgkin-like morphology, usually rare in ALCL (∼3%). This pattern is characterized by vaguely nodular fibrosis associated with capsular thickening and Reed-Sternberg–like cells.35-37 Specifically, 4 cases had a cellular background consisting mainly of small lymphocytes and plasma cells, and 2 cases displayed more abundant eosinophils (Figure 2D; supplemental Figure 9).
Endogenous LTRs spanning the TSS of patient-derived ERBB4-truncated forms display transactivation activities
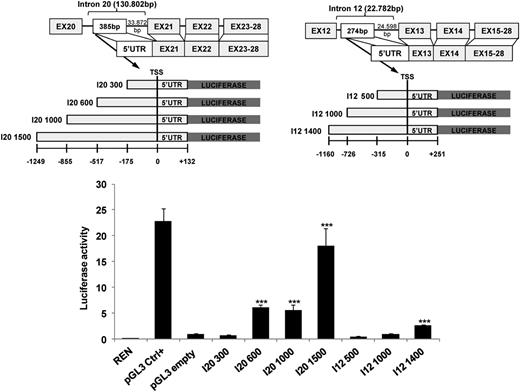
Regions spanning I20ΔERBB4 and I12ΔERBB4 TSSs contain human endogenous retrovirus long terminal repeats (LTRs). Specifically, the University of California Santa Cruz Genome Browser (https://genome.ucsc.edu) showed that the I20ΔERBB4 5′ untranslated region is embedded within an LTR sequence belonging to the ERVL-MaRL family (MLT1H2), carrying an Alu element as secondary insertion. Likewise, the I12ΔERBB4 5′ untranslated region is located within an MLT1C LTR belonging to the ERVL-MaLR family (supplemental Figure 10). Because endogenous LTRs can retain transcriptional regulatory activities, we assessed whether LTRs surrounding I20ΔERBB4 and I12ΔERBB4 TSSs could promote transcription. Fragments upstream of I20 and I12 TSSs were cloned into pGL3 luciferase enhancer vector, and reporter activity was monitored after transfection in HEK-293T cells. I20 fragments >600 bp significantly increased luciferase transcription (5.5-fold to 18-fold; P < .001). In contrast, expression of the longest I12 LTR intronic fragment (1400 bp) was required to achieve a twofold increase in luciferase activation (P < .001) (Figure 3).
LTRs spanning the TSS of truncated ERBB4 display transactivation activity. I20ΔERBB4 and I12ΔERBB4 5′ untranslated regions (UTRs) are localized in human endogenous retrovirus LTRs. Luciferase assays were performed in HEK-293T cells transfected with LTR sequences upstream of the luciferase gene. Three independent experiments are shown as fold activation compared to pGL3 (pGL3 empty) basic activity (set as 1). Error bars represent normalized standard deviation (***P < .001). Ctrl, control; REN, renilla.
LTRs spanning the TSS of truncated ERBB4 display transactivation activity. I20ΔERBB4 and I12ΔERBB4 5′ untranslated regions (UTRs) are localized in human endogenous retrovirus LTRs. Luciferase assays were performed in HEK-293T cells transfected with LTR sequences upstream of the luciferase gene. Three independent experiments are shown as fold activation compared to pGL3 (pGL3 empty) basic activity (set as 1). Error bars represent normalized standard deviation (***P < .001). Ctrl, control; REN, renilla.
Patient-derived ERBB4-truncated forms show oncogenic potentials
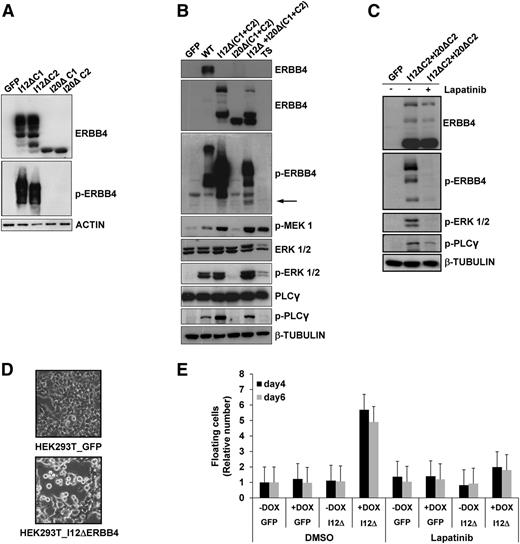
ERBB4 is known to produce functionally distinct variants in the extracellular juxtamembrane and intracellular cytoplasmic domains (CYT), as a result of alternative splicing.33 The presence of both cytoplasmic isoforms (CYT1 and CYT2) was assessed in ERBB4-positive samples by RT-PCR (data not shown). To define whether truncated forms of ERBB4 have a basal kinase activity, we transiently expressed I12ΔERBB4-CYT1, I12ΔERBB4-CYT2, I20ΔERBB4-CYT1, I20ΔERBB4-CYT2, or wild-type ERBB4 in HEK-293T cells (Figure 4A). I12ΔERBB4 was constitutively active, as revealed by anti-phosphotyrosine 1284 ERBB4 antibodies and by the phosphorylation of known ERBB4 downstream effectors such as mitogen-activated protein kinase kinase, ERK1/2, and PLCγ. In contrast, I20ΔERBB4 activation required coexpression of I12ΔERBB4 (Figure 4B-C). Furthermore, inducible expression of I12ΔERBB4 in HEK-293T cells significantly modified cell shape and increased cell detachment. Phosphorylation of ERBB4 effectors and loss of cell adhesion were completely blocked by treatments with the pan-ERBB inhibitor lapatinib (2 μM; Figure 4D-E), suggesting the requirement of ERBB4 enzymatic activity.
ERBB4-truncated forms induce cell detachment in HEK-293T cells. (A) HEK-293T cells transfected with I12ΔERBB4-CYT1 (I12ΔC1), I12ΔERBB4-CYT2 (I12ΔC2), I20ΔERBB4-CYT1 (I20ΔC1), or I20ΔERBB4-CYT2 (I20ΔC2) express ERBB4-truncated proteins. I12ΔERBB4 constructs were constitutively phosphorylated. Total and phosphorylated (p-) proteins were detected by western blot analysis with the indicated antibodies. (B) HEK-293T cells expressing wild-type ERBB4 (WT) or I12ΔERBB4 C1 and C2 showed extracellular signal-regulated protein kinase (ERK) and phospholipase C-γ (PLCγ) pathways activation. I12ΔERBB4 and I20ΔERBB4 cotransfection (1:10 ratio) induced I20Δ trans-phosphorylation (arrow). (C) ERBB4-mediated ERK and PLCγ activations are inhibited by lapatinib treatment (2 μM). (D) HEK-293T cells conditionally expressing GFP or a doxycycline-inducible I12ΔERBB4 construct were analyzed by contrast-phase microscope 4 days after doxycycline administration (1 μg/mL). Original magnification ×10. (E) HEK-293T cells expressing the indicated constructs were analyzed in the presence or absence of doxycycline (DOX) and lapatinib treatment. Floating cells were quantified at days 4 and 6 and expressed as fold increase compared to GFP (relative number). Error bars represent standard deviation of 3 independent experiments. DMSO, dimethylsulfoxide.
ERBB4-truncated forms induce cell detachment in HEK-293T cells. (A) HEK-293T cells transfected with I12ΔERBB4-CYT1 (I12ΔC1), I12ΔERBB4-CYT2 (I12ΔC2), I20ΔERBB4-CYT1 (I20ΔC1), or I20ΔERBB4-CYT2 (I20ΔC2) express ERBB4-truncated proteins. I12ΔERBB4 constructs were constitutively phosphorylated. Total and phosphorylated (p-) proteins were detected by western blot analysis with the indicated antibodies. (B) HEK-293T cells expressing wild-type ERBB4 (WT) or I12ΔERBB4 C1 and C2 showed extracellular signal-regulated protein kinase (ERK) and phospholipase C-γ (PLCγ) pathways activation. I12ΔERBB4 and I20ΔERBB4 cotransfection (1:10 ratio) induced I20Δ trans-phosphorylation (arrow). (C) ERBB4-mediated ERK and PLCγ activations are inhibited by lapatinib treatment (2 μM). (D) HEK-293T cells conditionally expressing GFP or a doxycycline-inducible I12ΔERBB4 construct were analyzed by contrast-phase microscope 4 days after doxycycline administration (1 μg/mL). Original magnification ×10. (E) HEK-293T cells expressing the indicated constructs were analyzed in the presence or absence of doxycycline (DOX) and lapatinib treatment. Floating cells were quantified at days 4 and 6 and expressed as fold increase compared to GFP (relative number). Error bars represent standard deviation of 3 independent experiments. DMSO, dimethylsulfoxide.
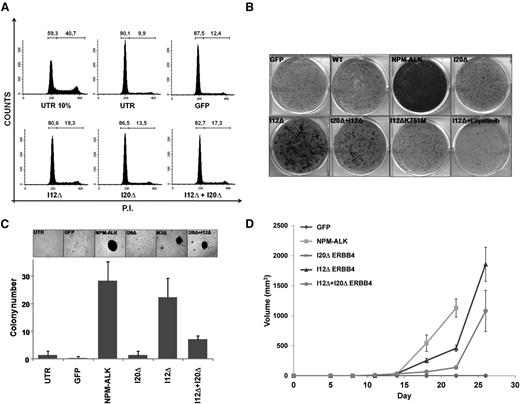
To assess ERBB4 oncogenic potential, we performed transformation assays in NIH-3T3 cells transduced with I12ΔERBB4, I20ΔERBB4, I12ΔERBB4+I20ΔERBB4, or GFP construct as control. First, we observed that NIH-3T3 cells expressing I12ΔERBB4 and I20ΔERBB4+I12ΔERBB4 were less sensitive to G0/G1 cell cycle arrest induced by serum deprivation (Figure 5A). Next, I12ΔERBB4 and I20ΔERBB4+I12ΔERBB4 NIH-3T3 cells displayed increased focus efficiency in adhesion and higher numbers of colonies in soft agar (Figure 5B-C). Expression of kinase-dead I12ΔERBB4 (I12ΔK751M) or treatment with lapatinib (2 μM) reversed the transformation potential of truncated ERBB4. Lastly, I12ΔERBB4 and I20ΔERBB4+I12ΔERBB4 NIH-3T3 cells injected subcutaneously into NSG mice produced fast-growing tumor masses. NPM-ALK–expressing cells were injected as positive control. No growth was observed in mice injected with NIH-3T3 cells expressing GFP or I20ΔERBB4 (Figure 5D).
ERBB4-truncated forms show oncogenic potentials in NIH-3T3 cells. (A) NIH-3T3 cells transduced with the indicated constructs were analyzed for cell cycle after serum deprivation (72 hours). I12Δ- and I20Δ+I12Δ-transduced cells displayed reduced G0/G1 arrest compared to controls. (B) Focus formation assay of NIH-3T3 cells transduced with the indicated constructs. I12ΔERBB4 transformation potential is kinase dependent as suggested by ERBB4 kinase dead construct (I12ΔK751M) expression and lapatinib treatment. (C) Soft agar assay of NIH-3T3 cells transduced with the indicated constructs. Increased numbers of colonies were detected in I12Δ-, I20Δ+I12Δ-, and NPM-ALK–transduced cells. (D) Tumor growth curves of NIH3T3 cells transduced with the indicated constructs. A total of 5 × 10⁴ cells were subcutaneously injected into 6 NSG mice for each condition. Tumor growth was monitored over time by determining the volume of tumor masses. Each data point represents the average tumor volume (mean ± standard error). P.I., propidium iodide.
ERBB4-truncated forms show oncogenic potentials in NIH-3T3 cells. (A) NIH-3T3 cells transduced with the indicated constructs were analyzed for cell cycle after serum deprivation (72 hours). I12Δ- and I20Δ+I12Δ-transduced cells displayed reduced G0/G1 arrest compared to controls. (B) Focus formation assay of NIH-3T3 cells transduced with the indicated constructs. I12ΔERBB4 transformation potential is kinase dependent as suggested by ERBB4 kinase dead construct (I12ΔK751M) expression and lapatinib treatment. (C) Soft agar assay of NIH-3T3 cells transduced with the indicated constructs. Increased numbers of colonies were detected in I12Δ-, I20Δ+I12Δ-, and NPM-ALK–transduced cells. (D) Tumor growth curves of NIH3T3 cells transduced with the indicated constructs. A total of 5 × 10⁴ cells were subcutaneously injected into 6 NSG mice for each condition. Tumor growth was monitored over time by determining the volume of tumor masses. Each data point represents the average tumor volume (mean ± standard error). P.I., propidium iodide.
ERBB4 pharmacologic inhibition partially controls ALCL cell growth and disease progression of ERBB4-positive PDTs
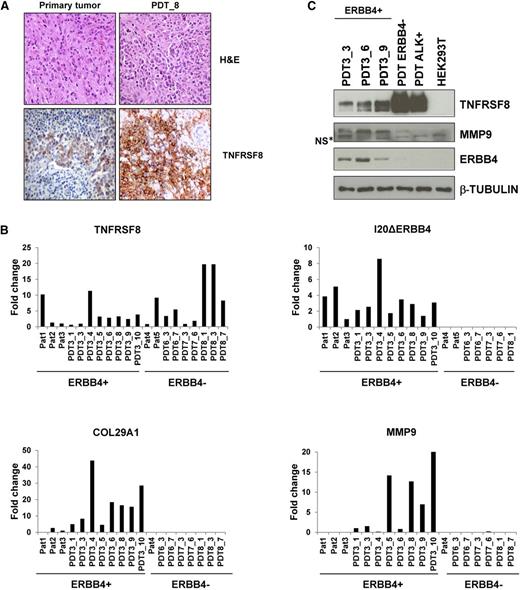
Because there are no ERBB4-positive ALCL cell lines, we generated a PDT model by implanting samples from an ERBB4-positive ALCL into NSG mice. Implants led to successful lymphoma growth in 12 to 15 weeks and propagated up to 10 consecutive serial implants. Tumorgrafts grew as solid fibrotic masses confined to the site of implantation. At later stages, lymphoma cells disseminated into local lymph nodes and colonized parenchymal tissues. Histologically, PDTs contained large pleomorphic cells with abundant cytoplasm and large nuclei and displayed immunohistochemical staining for CD30/TNFRSF8 (Figure 6A). Consistent with the primary tumor, fluorescence-activated cell-sorting analysis of PDT cell suspensions confirmed positivity to CD30, CD4, CD7, CD44, CD25, and CD29 (supplemental Table 4). Expression of I20ΔERBB4 transcripts was significantly increased in PDTs, as was those of ERBB4-correlated genes such as COL29A1, MMP9, and others (Figure 6B and data not shown). Western blot analysis confirmed the presence of I20ΔERBB4, TNFRSF8, and MMP9 proteins (Figure 6C). These findings indicate that the PDT recapitulates the major features of the primary ALCL tumors.
ERBB4-positive PDT phenocopies the tumor of origin. (A) Hematoxylin and eosin (H&E) and TNFRSF8 stainings of primary tumor and PDT, passage 8. (B) Expression of TNFRSF8, I20ΔERBB4, COL29A1, and MMP9 transcripts as assessed by qRT-PCR in primary tumors (Pat) and PDTs. PDTs have the same number of patient-of-origin numbers after underscores, indicating the in vivo passages. (C) Western blot analysis of PDT lysates confirmed the expression of TNFRSF8, MMP9, and ERBB4. NS*, nonspecific band.
ERBB4-positive PDT phenocopies the tumor of origin. (A) Hematoxylin and eosin (H&E) and TNFRSF8 stainings of primary tumor and PDT, passage 8. (B) Expression of TNFRSF8, I20ΔERBB4, COL29A1, and MMP9 transcripts as assessed by qRT-PCR in primary tumors (Pat) and PDTs. PDTs have the same number of patient-of-origin numbers after underscores, indicating the in vivo passages. (C) Western blot analysis of PDT lysates confirmed the expression of TNFRSF8, MMP9, and ERBB4. NS*, nonspecific band.
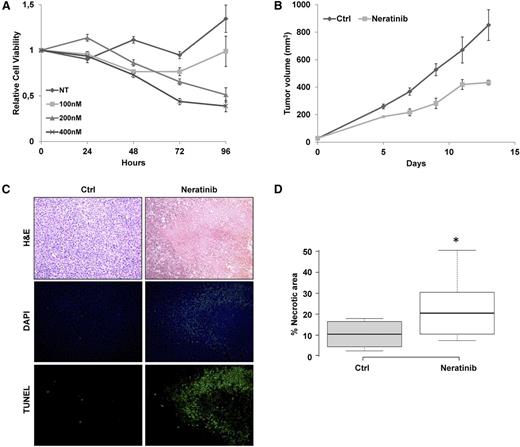
Considering the aggressive behavior of the ERBB4-positive patients, we tested whether ERBB4 signaling was required to maintain the neoplastic phenotype of PDT cells. First, an ex vivo culture of PDT cells was treated with the irreversible pan-HER inhibitor neratinib. Even though PDT lymphoma cells could not be expanded and progressively died within 4 to 5 weeks, ERBB4 pharmacologic inhibition resulted in a significant increase of cell depletion (Figure 7A). Next, to examine the efficacy of ERBB4 inhibition in vivo, ERBB4 PDT cells were subcutaneously injected into NSG mice. Mice with masses 0.5 cm in diameter were treated with orally administered neratinib (40 mg/kg every 48 hours) or control diluent. Analysis indicated that neratinib partially impaired tumor growth over time (Figure 7B). Histologic inspection demonstrated that tumor masses treated with neratinib were significantly more necrotic than control samples (Figure 7C-D). Further analyses confirmed these findings, indicating that ERBB4 inhibition increased DNA genomic breaks and active caspase 3 levels (Figure 7C; supplemental Figure 11). Overall, these data demonstrate that ERBB4 signaling is required for ALCL growth.
ERBB4 inhibition partially controls ALCL cell growth and disease progression of ERBB4-positive PDTs. (A) PDT explanted cells were treated with control diluent (DMSO) or neratinib at the indicated concentrations. Cell viability was measured over time by adenosine triphosphate–based luminescence assay. Results were normalized to DMSO controls at time 0 and represent the mean and standard error of 3 biological replicates. (B) In vivo tumor growth of PDT cells (5 × 10⁴) subcutaneously injected into the flanks of 6 NSG mice. Mice with tumor masses of 0.5 cm diameter were treated with neratinib (40 mg/kg every 48 hours) or control diluent (Ctrl). Each data point represents the average tumor volume (mean ± standard error) for the indicated treatment condition (P = .0006). (C) Representative histologic sections stained with hematoxylin and eosin (H&E; top) of tumor masses derived from control or neratinib-treated animals. Tissue sections were stained for DNA breaks with the terminal deoxynucleotidyl transferase deoxyuridine triphosphate nick-end labeling method (bottom) and DAPI counterstained (middle). Original magnification ×20. (D) Box plot showing quantification of necrotic areas in 7 controls and in 9 neratinib-treated tumor masses (*P = .038). NT, no treatment.
ERBB4 inhibition partially controls ALCL cell growth and disease progression of ERBB4-positive PDTs. (A) PDT explanted cells were treated with control diluent (DMSO) or neratinib at the indicated concentrations. Cell viability was measured over time by adenosine triphosphate–based luminescence assay. Results were normalized to DMSO controls at time 0 and represent the mean and standard error of 3 biological replicates. (B) In vivo tumor growth of PDT cells (5 × 10⁴) subcutaneously injected into the flanks of 6 NSG mice. Mice with tumor masses of 0.5 cm diameter were treated with neratinib (40 mg/kg every 48 hours) or control diluent (Ctrl). Each data point represents the average tumor volume (mean ± standard error) for the indicated treatment condition (P = .0006). (C) Representative histologic sections stained with hematoxylin and eosin (H&E; top) of tumor masses derived from control or neratinib-treated animals. Tissue sections were stained for DNA breaks with the terminal deoxynucleotidyl transferase deoxyuridine triphosphate nick-end labeling method (bottom) and DAPI counterstained (middle). Original magnification ×20. (D) Box plot showing quantification of necrotic areas in 7 controls and in 9 neratinib-treated tumor masses (*P = .038). NT, no treatment.
Discussion
The present study describes a new subtype of ALK-negative ALCL characterized by ectopic expression of ERBB4 and COL29A1. ERBB4 represents a novel diagnostic marker for the differential diagnosis of ALK-negative ALCL and for the stratification of other CD30+ T-NHLs. We demonstrate that ERBB4-truncated forms show oncogenic potentials in vitro and in vivo and that their inhibition can control ALCL cell growth and disease progression in an ERBB4-positive PDT model.
ERBB4 encodes for a member of the tyrosine kinase receptor superfamily that was found to be mutated in several cancer types and potentially oncogenic.31-34,38 More recently, ERBB4 has been implicated in mediating acquired resistance to ERBB2 inhibitors and in protecting epidermal growth factor receptor from degradation in breast cancer cells.39,40 Conversely, COL29A1 encodes for the collagen VI α chain COL6A5, an extracellular matrix protein with critical roles in maintaining muscle and skin integrity.41 In addition to structural functions, evidence suggests that collagen VI has growth-stimulatory and prosurvival effects.42-44
ERBB4 and COL29A1 genes emerged from the application of the COPA algorithm to a large GEP data set including T-NHL and normal T cells. Their expression was strongly correlated in a subset of ALK-negative ALCL. Molecular analyses of ERBB4/COL29A1–positive ALCL samples led to the identification of 2 ERBB4-truncated transcripts characterized by TSSs in introns 12 and 20 (I12ΔERBB4 and I20ΔERBB4, respectively). Conversely, no alterations were recognized in the COL29A1 transcript, although the protein was ectopically expressed. The specific expression of aberrant ERBB4 transcripts in a subset of ALK-negative ALCL (∼25%) was confirmed using an independent validation panel of T-NHL samples. The concept of an ERBB4-positive subclass is supported by the clinicopathological features of ERBB4-positive patients. In fact, ERBB4-positive cases recurrently displayed a Hodgkin-like morphology35-37 associated with OS and failure-free survival rates typical of ALK-negative ALCL. In addition, preliminary data suggest that ERBB4 expression is mutually exclusive with TP63 rearrangements21 and not significantly correlated to other translocations described in ALCL.20,23 Nevertheless, further studies are required to statistically validate these results.
The identification of a distinct subset within ALK-negative ALCL confirms the commonly accepted hypothesis that this entity includes multiple subgroups driven by different aberrations. Although these lesions frequently display unique histologic features, their molecular identification and distinction from other CD30+ forms provides new avenues for a more precise stratification and leads to the implementation of new target therapies. Identification of ERBB4-positive ALCL can be rapidly achieved using molecular approaches such as ddPCR. Conversely, application of immunohistochemical tests requires powerful and highly specific antibodies. Analyses performed by us and others demonstrate that current ERBB4 antibodies are not readily applicable in clinical arenas.45 Notably, ERBB4 and COL29A1 were highly correlated to MMP9 protein expression. Thus, MMP9 immunohistochemical staining could be an alternative tool for the recognition of ERBB4-positive ALCL. We envision that these tests will complement diagnostic fluorescence in situ hybridization and molecular analyses designed to identify recurrent translocations or oncogenic JAK1/STAT3 mutations.18,19,21
Mechanistically, the identification of human endogenous retrovirus LTRs spanning I20ΔERBB4 and I12ΔERBB4 TSSs might explain the aberrant expression of ERBB4 transcripts in ALCL. It is known that endogenous LTRs are regulatory regions frequently silenced by epigenetic modifications.46,47 Sporadically, their repression can be erased, leading to reactivation of regulatory elements and the expression of nearby genes.48 Here, we have demonstrated that I20ΔERBB4 and I12ΔERBB4 LTRs promote luciferase transcription. The increased activity of I20 LTR as compared to I12 is in agreement with its higher expression in all ERBB4-positive samples. To the best of our knowledge, this is the first report of ERBB4 deregulation characterized by the expression of truncated transcripts with intronic TSSs. We are currently investigating whether epigenetic deregulation is responsible for ERBB4 aberrant expression.
To define the oncogenic potential of truncated ERBB4 peptides, we have proved that I12ΔERBB4 undergoes autophosphorylation, whereas I20ΔERBB4 requires trans-phosphorylation through I12ΔERBB4. However, we cannot exclude that alternative mechanisms of I20ΔERBB4 activation could take place in the ALCL context. It is known that ERBB4 yields multiple spliced isoforms and that the protein undergoes regulated cleavages, releasing an intracellular domain that translocates to the nucleus and regulates transcription.33 Thus, a deep analysis of ERBB4 isoforms expression and function is required in the ALCL context. Of importance, the oncogenic potential of truncated ERBB4 was demonstrated with in vitro and in vivo experiments and was reversed by treatment with pan-ERBB inhibitors.
Because no ERBB4-positive ALCL cell line is available, we generated a new PDT model. Histologic, immunophenotypic, and expression analyses confirmed that the PDT phenocopied its ERBB4-positive primary donor sample. Having previously proved that PDTs closely mirror patient responses,23,49 we tested the therapeutic efficacy of pan-ERBB4 inhibitors. These studies showed that the kinase inhibition could only partly control tumor growth in this preclinical model, suggesting that additional factors may play a role in sustaining the growth of ERBB4-positive ALCL; therefore, we cannot exclude that COL29A1 and MMP9 may also contribute. To this end, ERBB4-positive PDTs could reveal a powerful approach to design and validate combination therapies for this specific subclass of patients.
In conclusion, our study demonstrates that ERBB4 is ectopically expressed in a distinct subset of ALK-negative ALCL patients. Functional experiments indicated that the expression of ERBB4 aberrant transcripts might contribute to ALCL transformation and tumor maintenance. Our findings are clinically relevant because they provide a new marker and a potential therapeutic target for a subset of ALCL.
The online version of this article contains a data supplement.
The publication costs of this article were defrayed in part by page charge payment. Therefore, and solely to indicate this fact, this article is hereby marked “advertisement” in accordance with 18 USC section 1734.
Acknowledgments
The authors thank Giovanna Gambarotta, Ferdinando Di Cunto, Paolo Provero, Ivan Molineris, Enzo Calautti, Salvatore Oliviero, and Francesco Neri for useful discussions and suggestions on the manuscript; Luigi Chiusa for survival analysis; Ugo Ala for statistics; and Daniele Corino and Maria Stella Scalzo for histology and immunohistochemical stainings.
This study was supported by Investigator Grants IG13358 and IG10136 and the Special Program in Molecular Clinical Oncology (5x1000 No. 10007), Associazione Italiana per la Ricerca sul Cancro, Milan, Italy; grants ImmOnc (BIO F.E.S.R. 2007/13) and OncoProt (CIPE 25/2005), Regione Piemonte, Turin, Italy; grants TO_Call2_2012_0061 and Oncology Program, Compagnia di San Paolo, Turin, Italy; grant 2014_1105, Fondazione Cassa di Risparmio di Torino, Turin, Italy; grant RBFR12D1CB, Futuro in Ricerca 2012, Ministero dell’Istruzione, dell’Università e della Ricerca, Rome, Italy; Rete Oncologica Piemonte e Valle d’Aosta, Turin, Italy; Oncosuisse grant KLS-02403-02-2009 (Switzerland); and Anna Lisa Stiftung, Barletta and Gelu Foundations (Switzerland).
Authorship
Contribution: I.S., E.P., E.M., E.B., M.C., A.R., and S.S. performed the experiments and contributed to the interpretation of biological data; G.G., R.M., P.C., N.V., and E.M. performed in vivo and ex vivo experiments; I.K., L.A., F.A., S.M., S.D., A.N., R.R., F.B., G.I., and R.P. analyzed the data and interpreted the experiments; D.N., A.B., E.T., B.F., and G.I. provided well-characterized study materials and reviewed the pathology; and R.P. and G.I. conceived of the study and wrote the manuscript.
Conflict-of-interest disclosure: The authors declare no competing financial interests.
A complete list of the members of the European T-Cell Lymphoma Study Group appears in “Appendix.”
Correspondence: Roberto Piva, Department of Molecular Biotechnology and Health Sciences, University of Turin, via Nizza 52, Turin, 10126 Italy; e-mail: roberto.piva@unito.it; and Giorgio Inghirami, Department of Pathology and Laboratory Medicine, Weill Cornell Medical College, 525 East 68th St, Starr Pavilion Room 713, New York, NY 10065; e-mail: ggi9001@med.cornell.edu.
Appendix: study group members
The European T-Cell Lymphoma Study Group members are: Michela Boi, Ramona Crescenzo, Giuditta Cuccuru, Giulia Garaffo, Marcello Gaudiano, Giorgio Inghirami, Elena Lasorsa, Rodolfo Machiorlatti, Enzo Medico, Elisabetta Mereu, Katia Messana, Elisa Pellegrino, Roberto Piva, Irene Scarfò, Elisa Spaccarotella, Fabrizio Tabbò, and Maria Todaro (University of Turin, Italy); Antonella Barreca, Alessandro Fornari, and Domenico Novero (ASO Azienda Ospedaliera Città della Salute e della Scienza di Torino, Italy); Marco Chilosi and Alberto Zamò (University of Verona, Italy); Fabio Facchetti and Silvia Lonardi (University of Brescia, Italy); Anna De Chiara and Franco Fulciniti (National Cancer Institute, Italy); Claudio Doglioni and Maurilio Ponzoni (San Raffaele Institute, Italy); Luca Agnelli, Antonino Neri, and Katia Todoerti (University of Milan, Italy); Claudio Agostinelli, Pier Paolo Piccaluga, and Stefano Pileri (University of Bologna, Italy); Brunangelo Falini and Enrico Tiacci (University of Perugia, Italy); Christiane De Wolf-Peeters, Thomas Tousseyn, and Peter Van Loo (University of Leuven, Belgium); Eva Geissinger, Hans Konrad Muller-Hermelink, and Andreas Rosenwald (University of Würzburg, Germany); Andras Matolcsy (Semmelweis University, Hungary); Miguel Angel Piris and Maria E. Rodriguez-Pinilla (Hospital Universitario Marques de Valdecilla/Instituto de Formación e Investigación Marqués de Valdecilla, Spain); Francesco Bertoni, Ivo Kwee, and Andrea Rinaldi (Institute of Oncology Research, Switzerland).
References
Author notes
I.S., E.P., and E.M. contributed equally to this study.

