Abstract
Introduction
Angiogenesis is one of the central dogmas in growth and progression of a malignant tumor including malignant lymphoma. Lymphoma is a tumor originating from immune cells and lymphoid malignancies and it can alter normal immune function. However, nature of the immune dysfunction is not well defined. Inflammatory mediators acting through Th1/Th2 cytokines and growth factors secreted by the infiltrating inflammatory cells are known to have both direct and indirect angiogenic effects on endothelial cells.Whether tumor angiogenesis in lymphoma patients is associated with alteration in inflammatory cytokines is an unexplored area.Whether extent of angiogenesis at baseline and elevation of levels of biomarkers in the serum have any bearing on chemotherapy response in a patient of B-NHL remains an unanswered question.
Methods
Forty nine cases of de novo DLBCL with available formalin fixed paraffin embedded (FFPE) block, serum (stored at -80˚C)and IPI were reviewed using the diagnostic criteria defined in the Revised European-American Classification of Lymphoid Neoplasm's.BD Pharmigen™cytometric bead analysis (CBA) Human Th1/Th2 Cytokine Kit II (Catalog No. 560484) was used to quantitateInterleukin-2 (IL-2), Interleukin-4 (IL-4), Interleukin-6 (IL-6), Interleukin-10 (IL-10), Tumor Necrosis Factor (TNF-α), and Interferon-γ (IFN-γ) protein levels against internal standard controls. BD FCAP ArrayTM software was used to analyze all the cytokines levels respectively. Baseline angiogenesis in tumor was assessed by histopathologic examination for micro vessel density. Microvessel density was examined using CD34 antibody (clone QBEnd 10, Dako, Denmark), an endothelial cell marker. Vascular "Hot Spots" were identified at low power and the visual analog system was used for counting at 40X in at least five independent microscopic fields per tissue section. The mean of five fields was calculated and divided by the field area (1 HPF=0.19 mm2) to obtain the density count in mm2. Precautions were taken to count vessels at the center of the tumor and to avoid the periphery of the tumor to obtain true representation of tumor vasculature. Median value was calculated for the continuous data and CD34, IL-6, IL-10, IL-4, IL-2, IL-17, TNF-α, IFN-γ divided into categorical variables based on median value. Kaplan-Meier method was used to estimate event-free survival (EFS) distribution.Cytokine profile and microvessel density were correlated with EFS for identification of prognostic marker. Informed consent was taken from all the patients enrolled in the study in accordance with IEC, PGIMER guidelines.
Results
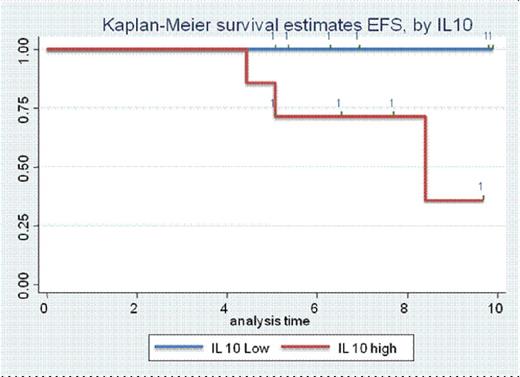
Forty nine DLBCL cases in the study included thirty (61%) males and nineteen (39%) females (male/female, 1.6:1). The median age of patients was 56 years (range, 17 - 80 years). Stage I/II were seen in 40% patients while stage III/IV were seen in 60% patients. Fifty-four patients had extranodal disease. Forty five, 15 and 40% patients had low, intermediate and high risk IPI respectively. All but 3 patients were treated with RCHOP based regimen. Remaining 3 patients 2 received bendamustine with rituximab while one recevied only CHOP. CR rate was 58.8% while ORR was 70%. At the time of analysis three patients had died. On univariate analysis, IL-10, a cytokine of TH2 response, was identified as a promising prognostic factor for EFS (p<0.05). However, association of levels of IL-6, IL-2, IL-4, TNF-α, IFN-γ, and IL-17 with EFS was not statistically significant. There was no statistically significant relation between any of the tested cytokine levels and chemotherapy response rates. Median EFS for patients with high IL10 level was 8.2 months. While median value of EFS for patients with low IL2 levels was not reached till the time of data analysis. Microvessel density was an independent predictor of EFS (p=0.024).
Conclusion
We conclude that high micro vessel density and high IL10 levels are associated with poorer event free survival in DLBCL patients.
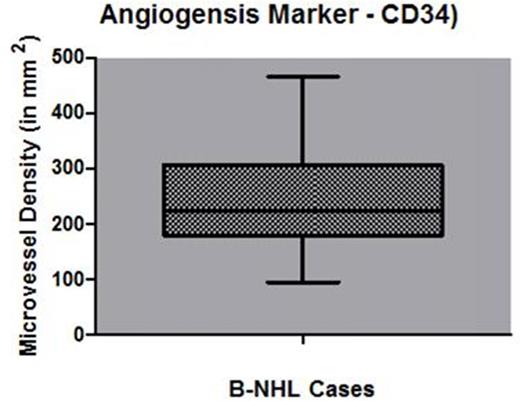
Box and whisker plot showing microvessel density in lymphnode tissue
Kaplan Meier survival curve for Event Free Survival according to IL10 level elevation
Kaplan Meier survival curve for Event Free Survival according to IL10 level elevation
No relevant conflicts of interest to declare.
Author notes
Asterisk with author names denotes non-ASH members.


This feature is available to Subscribers Only
Sign In or Create an Account Close Modal