Abstract
Introduction: Using near-infrared spectroscopy (NIRS), previous studies have shown that sickle-cell disease (SCD) patients have low cerebral oxygen saturation values [1]. Moreover, the hemoglobin S in sickle cell disease has impaired oxygen carrying capacity [2]. Here, we propose to investigate the effect of induced desaturation on the SCD brain. In particular, we analyzed the falling functional magnetic resonance imaging (fMRI) response during hypoxia, which results from local concentration changes in paramagnetic deoxy-hemoglobin (DHB). Moreover, we also explore the near-infrared spectroscopy (NIRS) changes in oxygenated and deoxygenated hemoglobin from the human prefrontal cortex.
Methods: All patients were recruited through informed consent or assent; this study obtained approval from the IRB at Children's hospital Los Angeles. Exclusion criteria included pregnancy, previous stroke, and acute chest pain and crisis hospitalization within one month. Eight patients with SCD and 20 healthy age and ethnicity-matched controls (CTL) were studied. All patients wore oxygen masks in order to control the oxygen level during the experiment in the fMRI. During the scan, the subjects breathed 1) room air for 50 s, 2) 100% N2 for 5 breaths and 3) room air for 6 minutes. The typical length of hypoxia is 5 breaths, but for patients with irregular breathing patterns the maximum duration is 20 seconds. NIRS was used to measure the hemoglobin (OHB, DHB and THB) and a tissue oxygen index (TOI), from the human prefrontal cortex. Differences oh hemoglobin measure, between the normoxia and hypoxia states, were computed and called ΔOHB, ΔDHB and ΔTOI. During resting-state fMRI scanning, subjects were instructed to close their eyes, keep still as much as possible and not to think of anything systematically. FMRI images were acquired during 8 minutes and a total of 240 volumes were collected. Imaging data was first preprocessed with the FMRIB Software Library (FSL), using standard spatial preprocessing steps: Images were (1) slice-time corrected, (2) realigned to remove physiological motion and co-registered to the MNI template space. The percent signal change from the fMRI, % BOLD, was computed based on an average signal in the GM mask.
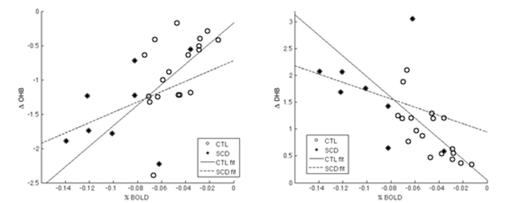
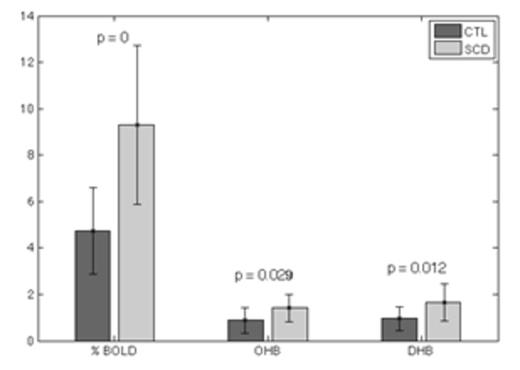
Results: 9 SCD patients (age=23±8) and 20 CTL subjects (age=21±1) were recruited. Fig 1 presents the relationship between %BOLD versus ΔOHB and % BOLD versus ΔDHB, respectively. Due to the lower oxygen affinity of hemoglobin S [1], the decrease in % BOLD (-0.093 ± 0.034) and the ΔOHB (-1.425 ± 0.588) in SCD patients are larger than the decrease in CTL individuals (% BOLD: -0.050 ± 0.021 and ΔOHB: -0.877 ± 0.539); the increase in ΔDHB (1.661 ± 0.805) in SCD patients is also greater than in the control group (ΔDHB: 0.959 ± 0.505), as shown on Figure 2. Based on the THB signal, we can detect hyperemia for most of the subjects during desaturation. Moreover, for some of the SCD patients, the reactivity is slower even at the end of the hypoxic state. We observe a slightly lower increase of ΔTHB for SCD patients, but this was found to be insignificant. This may be the result of a combination of the CBF variability in the SCD group, and of the small sample size. In our study, a decrease of ΔTOI was observed during hypoxia in both groups. The ΔTOI amplitude of the SCD group (-0.080 ± 0.023) is higher than that of the CTL group (-0.047 ± 0.024), which may be due to the SCD brain's diminished physiological adaptive capability to a hypoxic state.
Conclusion: Based on a conjoint acquisition of fMRI and NIRS, this study is the first investigation of the effect of the desaturation for SCD patients. As expected, based on these preliminary results, the SCD patients are more affected by hypoxic conditions, such as a larger changes of ΔOHB, ΔDHB, ΔTOI and % BOLD and a slower reactivity, likely due to anemia, high CBF and CBV, and decreased vessel elasticity.
†=equal first author contribution
References:
[1] M. Nahavandi et.al, "Near-infrared spectra absorbance of blood from sickle cell patients and normal individuals," Hematology, vol. 14, no. 1, pp. 46-48, 2009
[2] N. K. Logothetis, "The neural basis of the blood-oxygen-level-dependent functional magnetic resonance imaging signal Philos Trans R Soc Lond B Biol Sci, vol. 357, no. 1424, pp. 1003-1037, 2002
Minimum %BOLD versus minimum ΔOHB in the left side and minimum % BOLD versus maximum ΔDHB in the right side.
Minimum %BOLD versus minimum ΔOHB in the left side and minimum % BOLD versus maximum ΔDHB in the right side.
No relevant conflicts of interest to declare.
Author notes
Asterisk with author names denotes non-ASH members.


This feature is available to Subscribers Only
Sign In or Create an Account Close Modal