

Key Points
We show feasibility of whole-exome sequencing on purified primary HRS cells and report recurrent genetic alterations characterizing cHL.
B2M is the most frequently mutated gene in cHL, strongly associated with nodular sclerosis subtype, younger age, and better overall survival.
Abstract
Classical Hodgkin lymphoma (cHL) is characterized by sparsely distributed Hodgkin and Reed-Sternberg (HRS) cells amid reactive host background, complicating the acquisition of neoplastic DNA without extensive background contamination. We overcame this limitation by using flow-sorted HRS and intratumor T cells and optimized low-input exome sequencing of 10 patient samples to reveal alterations in genes involved in antigen presentation, chromosome integrity, transcriptional regulation, and ubiquitination. β-2-microglobulin (B2M) is the most commonly altered gene in HRS cells, with 7 of 10 cases having inactivating mutations that lead to loss of major histocompatibility complex class I (MHC-I) expression. Enforced wild-type B2M expression in a cHL cell line restored MHC-I expression. In an extended cohort of 145 patients, the absence of B2M protein in the HRS cells was associated with lower stage of disease, younger age at diagnosis, and better overall and progression-free survival. B2M-deficient cases encompassed most of the nodular sclerosis subtype cases and only a minority of mixed cellularity cases, suggesting that B2M deficiency determines the tumor microenvironment and may define a major subset of cHL that has more uniform clinical and morphologic features. In addition, we report previously unknown genetic alterations that may render selected patients sensitive to specific targeted therapies.
Introduction
Despite major progress in genomics of non-Hodgkin lymphomas, the genome of HRS cells in classical Hodgkin lymphoma (cHL) remains largely unexplored. Investigations have been hampered by the scarcity of neoplastic Hodgkin and Reed-Sternberg (HRS) cells within the tumor, making it difficult to isolate purified HRS cell populations in sufficient numbers for genome-level pipelines. Targeted analyses have documented alterations in specific genes in cHL cell lines and HRS cells obtained by laser capture microdissection (LCM), and have pointed to the activation of specific pathways, notably nuclear factor κB (NF-κB).1-3 Genome-level studies have been confined to a few cell lines derived from end-stage cHL patients and low-resolution copy number analysis of small numbers of single cells retrieved by LCM.4-6 LCM has also been used to capture HRS cells to evaluate chromosomal imbalances using comparative genomic hybridization7,8 and to perform transcriptional analysis using whole-genome expression arrays.9 We have overcome the limitations of LCM by combining flow cytometric cell sorting (which yields thousands of purified HRS cells from primary biopsy samples) with a refined exome sequencing library construction methodology that obviates the need for biased whole-genome amplification techniques. Using these methods, we produced the first whole-exome deep-sequencing and high-resolution copy number and single nucleotide polymorphism/small indel analyses of purified HRS cells from primary cHL samples. We systematically confirmed mutations identified through exome sequencing by whole transcriptome sequencing of the purified HRS cells for genes that were expressed. These data revealed molecular alterations that may prove relevant for accurate classification and improved prognostication and deserve evaluation as targets for specific therapy.
cHL cases show significant histologic heterogeneity and are currently subclassified into 4 histologic subtypes. Nodular sclerosis (NS) cHL is the most common histologic subtype (∼70% of cases), followed by mixed cellularity (MC) cHL (15% to 30% of cases). The other cHL subtypes (lymphocyte-rich and lymphocyte-depleted) are rare.10 The MC and lymphocyte-depleted subtypes may be part of a biological continuum, but NS cHL has a distinct epidemiology, clinical presentation, and histology.11 Studies have demonstrated that the cHL subtypes differ biologically in terms of the prevalence of Epstein-Barr virus (EBV) infection, gene-expression patterns, and cytokine milieu.12,13 Clinically, the MC type of cHL is generally associated with older age at diagnosis, higher stage, and inferior prognosis.14-17 It is therefore probable that NS and MC cHL represent distinct tumor entities with different natural histories and genomic drivers. However, genome-level differences between the 2 subtypes are not yet fully elucidated. Moreover, a significant fraction of cases are difficult to classify due to mixed or ambiguous clinical and histologic features. A retrospective study showed that 10% to 30% of cases across multiple cohorts received a diagnosis of cHL “not otherwise specified.”15 To date, classification into different histologic subtypes has not translated into different treatment approaches at least in part due to lack of fully reproducible objective criteria for classification. The frontline treatment of all subtypes consists of combination chemotherapy with or without radiotherapy, resulting in a 5-year overall survival of ∼85%.18 Despite the overall favorable outcome of treatment, the frequency of relapses in advanced-stage cHL can be as high as 30%, and up to 10% of newly diagnosed cHL patients will not achieve remission.19 Determining which subset of patients could benefit from more aggressive therapy, improving survival and relapse rates, has been the goal for many clinical/radiographic prognostic scoring systems.20 The identification of specific genomic alterations that are predictive of therapy response before treatment initiation, or that are in genes that make these alterations actionable, would provide the rationale for risk-adapted and targeted therapies in cHL.21
Methods
Tissue specimens
For exome and transcriptome sequencing, we used 10 leftover clinical samples that had been mechanically dissociated and cryopreserved as viable cell suspensions following excisional or needle core biopsy. Cases 1 to 9 were from the Department of Pathology and Laboratory Medicine at Weill Cornell Medical College, and case 10 was from Mount Sinai Medical Center.
A validation cohort of 176 cases was evaluated for β-2-microglobulin (B2M) expression by immunohistochemistry on formalin-fixed tissue blocks. These cases were obtained from Weill Cornell Medical College, Northwestern University, John H. Stroger Jr Hospital of Cook County, and the Humanitas Cancer Center. An additional 29 cases of HIV-associated cHL from John H. Stroger Jr Hospital of Cook County were examined by immunohistochemistry for B2M. All cases from the sequencing and expanded validation cohorts were defined as cHL morphologically and immunophenotypically and classified into histologic subtypes by at least 1 hematopathologist blinded to B2M status. EBV status was determined by Epstein-Barr encoding region in situ hybridization. All cases were collected and used for research with approval from our respective Institutional Review Boards.
Cell sorting
We adapted the protocol from Fromm et al22 for HRS cell sorting and used a panel of the following antibodies: CD64-FITC (22; Beckman Coulter [BC], Miami, FL); CD30-PE (BerH83; Beckton-Dickinson [BD], San Jose, CA); CD5-ECD (BL1a; BC); CD40-PE-Cy5.5 (custom conjugate, gift of Jonathan Fromm) or CD40-PerCP-eFluor 710 (1C10; eBiosciences, San Diego, CA); CD20-PC7 (B9E9; BC); CD15-APC (HI98; BD); CD45 APC-H7 (2D1; BD) or CD45-Krome Orange (J.33; BC); and CD95-Pacific Blue (DX2; Life Technologies, Grand Island, NY). Briefly, cell suspensions from cHL tumors containing up to 1 × 10⁸ cells were rapidly defrosted at 37°C, washed in 50 mL of RPMI 1640/20% fetal bovine serum solution containing DNase A, stained with the antibody cocktail for 15 minutes on ice, resuspended in fluorescence-activated cell sorter (FACS) buffer, and immediately sorted. All sorting experiments were performed on an FACSAria special-order research sorter using a 130-μm nozzle at 12 psi, acquiring up to 5 × 10⁷ cells and collecting HRS, B, and T cells from the tumor using 3-way sort. Sorted cells were captured in N-2-hydroxyethylpiperazine-N′-2-ethanesulfonic acid buffer solution containing 50% fetal bovine serum.
Library construction and sequencing
We developed a method to produce high-quality data from 10 ng of DNA by modifying the KAPA Biosystems “with-bead” protocol. We optimized the shearing and cleanup steps, increased the molar ratio of free adaptors to sample DNA, and increased time of ligation. DNA was extracted using the Wizard Genomic DNA Purification Kit (A1120; Promega, Madison, WI) eluted in 30 μL of 65°C water, followed by 20 μL of 65°C water. DNA was quantified using Qubit (Life Technologies, Carlsbad, CA) and sheared using a Covaris S2 at intensity 5, 10% duty cycle, 200 cycles/burst, water fill level of 12, 50 µL sample volume, and a 210-second treatment time divided into 30-second intervals with centrifugation. Illumina-compatible sequencing libraries were created using a low-throughput library preparation kit (KK8221; KAPA Biosystems) by modifying the with-bead protocol (without size selection) to include a 16-hour adapter ligation step at 20°C with indexed sequencing adapter oligos (Integrated DNA Technologies), using adapter-to-insert molar ratios ranging between 15:1 and 65:1. We quantified adapter-ligated molecules using the Library Quantification Kit (KK4824; KAPA Biosystems) to optimize the number of precapture amplification cycles and monitored the amplification process in real time using Sybr Green to avoid overamplification. The solid-phase reversible immobilization ratio for the postamplification cleanup was 0.8× to exclude carryover adapter dimer. Four sample libraries (250 ng each) were combined into one exome hybridization reaction (SeqCap v.3.0, kit 06465684001; Roche NimbleGen, Madison, WI) and amplified postcapture (8 cycles) using HiFi HotStart ReadyMix (KK2612; KAPA Biosystems) and primers purchased from Integrated DNA Technologies. Postcapture libraries were quantified with Qubit, sized with a 2100 Bioanalyzer (Agilent Technologies, Santa Clara, CA), diluted to 10 nM, and sequenced with 1 exome reaction (4 samples) per lane in a HiSeq sequencer (Illumina, San Diego, CA).
Computational data analysis
Raw FASTQ reads were inspected using FastQC and mapped to the University of California, Santa Cruz hg19 assembly of the human Genome Reference Consortium Human Reference 37 using Burrows-Wheeler Aligner.23 Samtools v.0.1.1824 was used to filter polymerase chain reaction duplicates and reads with a mapping quality score value below 20. To detect somatic nucleotide variants and small indels in HRS samples compared with the T-cell somatic controls, Strelka version 1.0.1025 was used. Somatic variants were annotated using SnpEFf version 3.3.26 Recurrent mutations were systematically inspected for artifacts in the Integrated Genome Viewer.27,28 For detection of copy number variations, we calculated the log-transformed ratio (ltr) for every exome target interval (i) of intralibrary normalized read counts in the tumor sample against those of the normal sample in the following manner:
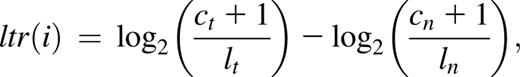
where c is the number of reads mapping to a given capture interval, l is the total library size, t denotes tumor, and n denotes normal. Only intervals with sufficient coverage (Ct+ Cn ≥ 100 reads) were retained for further analysis. Pan-interval segmentation was then performed using DNAcopy v.1.029 from Bioconductor in R, and segments for which the absolute value of the mean ltr was <0.5 were considered copy number neutral. Remaining segments were considered to be copy number gains when the sign of the mean ltr was positive (ie, when significantly more reads were in the tumor sample vs the normal sample after normalization), or copy number losses when the sign of the mean ltr was negative. National Center for Biotechnology Information, Reference Sequence Database genes contained within the amplified or lost segments were identified using custom R scripts.
Confirmatory RNA sequencing
We independently validated a selection of variants discovered in our exome data by whole transcriptome sequencing on HRS cell populations from 9 out of 10 primary cases. Using the Arcturus PicoPure RNA Isolation Kit, 1 to 5 ng of RNA was extracted from flow-sorted HRS cells and converted to complementary DNA using the Clontech SMARTer Ultra Low Input RNA Kit, followed by Illumina-compatible sequencing library construction using a library preparation kit from KAPA Biosystems. RNA sequencing libraries were mapped to the human reference genome hg19 using STAR v.2.3.0e. Validation candidates from our exome data were selected from a set of 363 genes that were reportedly mutated in at least 1 primary case and 1 cell line or at least 2 primary cases, and mutated in a manner likely to affect the protein. From that set of genes, 274 variants with coverage in RNA sequencing data were selected using custom scripts followed by manual inspection using the Integrated Genomics Viewer v.2.3.32 for visualization.27 Of these, 238 had coverage of at least 2 reads concordant with the variant (these also comprised a minimum of 10% of the total number of reads covering the locus) and were considered “validated,” yielding a positive validation rate of 86.8%.
Immunohistochemistry
Immunohistochemical staining of B2M (rabbit polyclonal, 1:500 dilution; Leica Microsystems) and of major histocompatibility complex (MHC) class I (MHC-I; mouse monoclonal, 1:500 dilution, EMR8-5; Abcam, Cambridge, MA) was accomplished using the Bond III Autostainer (Leica Microsystems, Buffalo Grove, IL). Formalin-fixed, paraffin-embedded tissue sections were first baked and deparaffinized. Antigen retrieval was followed by heating the slides at 37°C in Bond EnTizyme solution (Leica Microsystems) for 10 minutes. Sections were then subjected to sequential incubations with primary antibody, postprimary (equivalent to secondary antibody), polymer (equivalent to tertiary antibody), endogenous peroxidase block, diaminobenzidine, and hematoxylin for 15, 8, 8, 5, 10, and 5 minutes (Bond Polymer Refine Detection; Leica Microsystems), respectively. Lastly, the sections were dehydrated in 100% ethanol and mounted in Cytoseal XYL (Richard-Allan Scientific, Kalamazoo, MI).
Transfection experiments
The L428 cell line (kindly provided by Anas Younes) was transfected with either the maxGFP plasmid (Amaxa positive control; Lonza Group, Basel, Switzerland) alone or in combination with pBJ1-human b2m (plasmid 12099; Addgene, Cambridge, MA) using Amaxa nucleofection (Lonza Group) protocol in triplicate. The analysis of MHC-I and B2M expression was performed 36 hours later by direct immunofluorescence flow cytometry using AlexaFluor 647 anti-HLA-A,B,C antibody (W6/32; BioLegend, SanDiego, CA) and anti-B2M-PE antibody (TU99; BD) on a BD FACSAria sorter gating only on enhanced green fluorescent protein–positive cells with appropriate fluorescence spillover compensation.
Statistical analyses
The association of B2M status with clinical parameters, histologic subtype, and EBV status was determined using Fisher’s exact 2-tailed tests. Unpaired Student t test was used to determine the association of age and B2M status. Survival analysis was performed using the Kaplan-Meier method and the Cox proportional hazards model.
Results
HRS cells can be separated by flow sorting and their exomes sequenced
We performed flow cytometric isolation of HRS cells in 10 biopsy samples of primary cHL cases to unambiguously separate HRS cells from reactive background cells (Figure 1A).22 HRS cell yields ranged from 1000 to 100 000 cells from 1 × 10⁷ to 5 × 10⁷ total analyzed cells per case. Although some cases demonstrated significant rosetting of a subset of HRS cells by T cells, nonrosetted HRS cells were sorted whenever possible. The mean final purity of HRS cells for all cases was 75% (range 40% to 100%) based on median variant allele frequency in raw data at somatic variant loci (see supplemental Table 1 on the Blood Web site). Intratumoral T cells were also sorted and used as somatic controls in detecting mutations and copy number alterations. The purified HRS cells displayed typical morphologic features, including multinucleation, prominent nucleoli, and large size (Figure 1B). We generated whole-exome sequence data sets with 48× median coverage or greater for all sorted HRS cell samples (supplemental Table 1). We observed no significant difference in depth of coverage or copy number profiles between our optimized low-input library construction protocol with down to 10 ng of input DNA and a standard commercial protocol with 100 ng of DNA (Figure 1C-D).

HRS cell flow sorting and ultralow-input sequence library validation. (A) Identification of HRS cells for flow cytometric sorting. HRS cells (red) show high forward and side scatter, are positive for CD30, bright for CD40 and CD95, and are typically positive for CD15. Many cases show various degrees of rosetting by T cells, resulting in composite CD5+/CD45+ immunophenotype. CD20+ (light blue) B cells and CD5+ (green) T cells with appropriate CD45 and side scatter parameters were sorted for experiment controls. (B) Sorted HRS cells could be visualized on a cytospin using Wright-Giemsa stain to confirm population identity and purity. Original magnification ×100. (C) Comparison of depth of sequence coverage per base between libraries generated with 1 ng (red), 10 ng (blue), and 100 ng (green) of starting genomic DNA from intratumoral T cells. Depth of coverage was comparable between 10 ng and 100 ng DNA input, resulting in 48× vs 52× median coverage, respectively. (D) Each of 2 panels depicts copy number variation analysis results comparing data between 2 sequenced libraries. Exonic probe segments (x-axis) vs copy number change on log2 scale (y-axis) are plotted for a single representative chromosome (chr 6). Comparing data from a 10-ng low-input library from intratumoral T cell DNA to a 100-ng normal-input library from intratumoral T cell DNA from the same case showed no significant false-positive results; that is, low-input and normal-input libraries are copy neutral (top). Numerous segmental copy number alterations could be seen when data from a 10-ng low-input library from HRS were compared against intratumoral T cells of the same case (bottom), indicating that this method reveals copy number gains and losses. FSC, forward scatter; SSC, side scatter.
HRS cell flow sorting and ultralow-input sequence library validation. (A) Identification of HRS cells for flow cytometric sorting. HRS cells (red) show high forward and side scatter, are positive for CD30, bright for CD40 and CD95, and are typically positive for CD15. Many cases show various degrees of rosetting by T cells, resulting in composite CD5+/CD45+ immunophenotype. CD20+ (light blue) B cells and CD5+ (green) T cells with appropriate CD45 and side scatter parameters were sorted for experiment controls. (B) Sorted HRS cells could be visualized on a cytospin using Wright-Giemsa stain to confirm population identity and purity. Original magnification ×100. (C) Comparison of depth of sequence coverage per base between libraries generated with 1 ng (red), 10 ng (blue), and 100 ng (green) of starting genomic DNA from intratumoral T cells. Depth of coverage was comparable between 10 ng and 100 ng DNA input, resulting in 48× vs 52× median coverage, respectively. (D) Each of 2 panels depicts copy number variation analysis results comparing data between 2 sequenced libraries. Exonic probe segments (x-axis) vs copy number change on log2 scale (y-axis) are plotted for a single representative chromosome (chr 6). Comparing data from a 10-ng low-input library from intratumoral T cell DNA to a 100-ng normal-input library from intratumoral T cell DNA from the same case showed no significant false-positive results; that is, low-input and normal-input libraries are copy neutral (top). Numerous segmental copy number alterations could be seen when data from a 10-ng low-input library from HRS were compared against intratumoral T cells of the same case (bottom), indicating that this method reveals copy number gains and losses. FSC, forward scatter; SSC, side scatter.
Large DNA copy number alterations are highly recurrent and involve critical cancer genes in primary cHL cases
In line with previous reports,30,31 our analyses revealed that HRS cells from cHL demonstrate a very high number of genomic material gains and losses mostly due to large segment alterations, with a median of 75 (range 41-357) genomic segments lost and gained per case; however, considerable intercase heterogeneity was observed (representative cases are shown in Fig 2A). Several cases demonstrated extremely high intrachromosomal copy number variation. Within this high background of chromosome (chr)-level alterations, recurrent gains and losses in genes highly associated with oncogenesis were evident. We observed recurrent gains of a region in chr 2 containing REL (5/10), BCL11A, XPO1, and variably MYCN (4/10); focal amplifications involving only NSD1 (chr 5, 4/10); gains involving CD274 (chr 9, 4/10) and variably JAK2 and MLLT3 (3/10); gains involving UBE2A (chr X, 3/10); gains involving CDK4 (chr 12, 2/10); losses of gene segments involving TNFAIP3 (chr 6, 5/10) and variably MLL, MLLT4, PRDM1 (3/10), and MLL; losses of ATM and BIRC3 (chr 11, 5/10); and losses of RB1 (chr 13, 4/10), and BRCA2 (chr 13, 3/10) (Figure 2B; Table 1; supplemental Tables 2-6).

Copy number variation analysis of HRS cells. (A) Representative results for all chromosomes for case 2 (top) and case 3 (bottom) are shown. HRS cells vs T-cell exon copy number changes are plotted on log2 scale. Case 2 had a relatively high frequency of copy number alterations, whereas case 3 had relatively fewer. Focal losses of the immunoglobulin genes are seen in chromosomes 14, 2, and 22 (red arrows), and gains in the TCR genes on chromosomes 7 and 14 (blue arrows). (B) Circos plot showing the segments containing copy number variations in the 10 primary cases of cHL plus the 2 cell lines sequenced. The samples correspond to cases 1 through 10 beginning at the outermost ring and followed by cell lines L1236 and L428 in the inner circle. Important oncogenes, such as REL, can be seen recurrently amplified (blue), and tumor suppressors (eg, ATM) can be seen recurrently deleted (red).
Copy number variation analysis of HRS cells. (A) Representative results for all chromosomes for case 2 (top) and case 3 (bottom) are shown. HRS cells vs T-cell exon copy number changes are plotted on log2 scale. Case 2 had a relatively high frequency of copy number alterations, whereas case 3 had relatively fewer. Focal losses of the immunoglobulin genes are seen in chromosomes 14, 2, and 22 (red arrows), and gains in the TCR genes on chromosomes 7 and 14 (blue arrows). (B) Circos plot showing the segments containing copy number variations in the 10 primary cases of cHL plus the 2 cell lines sequenced. The samples correspond to cases 1 through 10 beginning at the outermost ring and followed by cell lines L1236 and L428 in the inner circle. Important oncogenes, such as REL, can be seen recurrently amplified (blue), and tumor suppressors (eg, ATM) can be seen recurrently deleted (red).
Point mutations and small indels may define a more homogenous group of cHL tumors
We found a median of 244 (range 102-505) somatic mutations per case (supplemental Table 7). We focused on mutations with a probable impact on protein sequence or expression (ie, nonsense, splice site, small indels, and missense mutations) that occurred in 2 or more of our sequenced primary cases of cHL. Using these criteria, we identified 99 recurrently mutated genes, 30 of which were also mutated in one or both cHL cell lines (supplemental Table 8).
A list of recurrently mutated genes curated on the basis of function and validation in RNA is shown in Table 1. B2M and TNFAIP3 were identified as the most commonly mutated genes in cHL cases (7/10 and 6/10, respectively). Of interest, all 7 cases classified as NS had mutations in B2M, and 6 of these cases had mutations in TNFAIP3. Case 8 was the only EBV-positive case in the sequenced cohort and the only case with NS morphology that lacked any TNFAIP3 mutation, consistent with a previous study reporting frequent mutual exclusivity of these 2 NF-κB-activating events.32 These data suggest that B2M mutations and either TNFAIP3 alterations or presence of EBV (with latent membrane protein 1 and 2 expression) are molecular characteristics of NS cHL. Consistent with the presence of different molecular features of NS and MC cHL is unsupervised clustering based on recurrent gene mutations, which revealed 2 distinct groups of cHL cases (Figure 3). The 7 cases classified as NS cHL clustered together, whereas the remaining 3 cases belonged to the MC type.

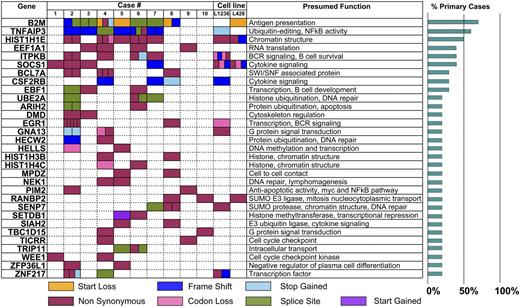
SNP and indel analysis reveal recurrent alterations and subsets. Unsupervised clustering (asymmetric binary distance matrix and complete linkage hierarchical clustering) based on mutation status of the 104 genes that were mutated in at least 2 cases divides 10 sequenced cases of cHL into 2 molecular subgroups—one of which is exclusively wild-type for B2M; the other exclusively mutated for B2M.
SNP and indel analysis reveal recurrent alterations and subsets. Unsupervised clustering (asymmetric binary distance matrix and complete linkage hierarchical clustering) based on mutation status of the 104 genes that were mutated in at least 2 cases divides 10 sequenced cases of cHL into 2 molecular subgroups—one of which is exclusively wild-type for B2M; the other exclusively mutated for B2M.
Numerous additional potentially oncogenic mutations that were recurrent in cHL were identified (Table 1). These included genes involved in regulation of chromosomal structure, integrity, and stability; nuclear import; protein and histone ubiquitination; and signal transduction. Some alterations, including those in B2M and TNFAIP3, have been described in diffuse large B-cell lymphoma and other lymphomas but appear to be more frequent in cHL. Other alterations can be found in ∼820 lymphoid neoplasms in the Catalog of Somatic Mutations in Cancer but only in 1 to 3 cases, also suggesting that these are more common in cHL. These alterations are HRIH2, HELLS, RANBP2, PIM2, SETDB1, SIAH2, WEE1, and ZNF217. Genes that to the best of our knowledge have not been previously linked to lymphoid malignancies but have been seen in solid cancers and myeloid stem cell disorders are CSF2RB, NEK1, HECW2, SENP7, TBC1D15, TICRR, and ZPF36L1.
B2M mutations are biallelic and inactivating and lead to loss of MHC-I expression
We chose to explore the role of B2M further because it was the most frequently mutated gene and showed inactivating bialleic mutations, including start codon mutations, exon-1 splice-donor and acceptor-site mutations, and out-of-frame first-exon deletions (Figure 4A). We also observed 100% concordance in B2M genotype between RNA and DNA sequencing data (Table 1; Figure 4B), Normally, B2M protein is required for surface expression of MHC-I (Figure 4C). We show that ectopic expression of wild-type B2M in the L428 cell line lacking B2M induces surface MHC-I, indicating that this genetic alteration is responsible for this defect in antigen presentation (Figure 4D).

B2M-inactivating mutations result in lack of MHC-I expression. (A) Diagram showing the localization and type of mutations in B2M in 7 sequenced primary cases of cHL containing these mutations. (B) Sequence analysis of DNA (top) and RNA (bottom) of the B2M gene in case 8 shows a point mutation in the start site of one allele and an out-of-frame deletion in another allele. Sequences were visualized using Integrated Genome Viewer. (C) Schematic representation of B2M together with MHC-I on the cell surface. (D) The L428 cell line was nucleofected with a plasmid encoding the wild-type B2M and a green fluorescent protein (GFP)-expressing plasmid, and flow cytometry was performed to evaluate MHC-I and B2M expression gating in the GFP+ (red) and GFP− (blue) populations.
B2M-inactivating mutations result in lack of MHC-I expression. (A) Diagram showing the localization and type of mutations in B2M in 7 sequenced primary cases of cHL containing these mutations. (B) Sequence analysis of DNA (top) and RNA (bottom) of the B2M gene in case 8 shows a point mutation in the start site of one allele and an out-of-frame deletion in another allele. Sequences were visualized using Integrated Genome Viewer. (C) Schematic representation of B2M together with MHC-I on the cell surface. (D) The L428 cell line was nucleofected with a plasmid encoding the wild-type B2M and a green fluorescent protein (GFP)-expressing plasmid, and flow cytometry was performed to evaluate MHC-I and B2M expression gating in the GFP+ (red) and GFP− (blue) populations.
Confirmation of B2M loss by immunohistochemistry in an expanded cohort provides a useful diagnostic assay
To validate and extend these data, we performed immunohistochemistry for B2M in the 10 sequenced cases and found complete concordance between mutation status and B2M expression in HRS cells. Therefore, we subsequently used immunohistochemistry to evaluate B2M protein expression in an expanded cohort from which we purposefully selected an overrepresentation of MC cases (Figure 5A). Of the 176 cases, 104 (59%) lacked B2M expression in the HRS cells. We also performed immunohistochemistry in a subset of cases with antibodies to MHC-I. Among the cases sequenced, those with B2M mutations had mislocalization, as evidenced by diffuse cytoplasmic staining and no Golgi or membranous positivity (Figure 5A). Overall, we were able to stain 52 cases for both B2M and MHC-I; of these, 10 were positive for these 2 proteins, 41 were negative for both, and 1 was discordant (positive for B2M and negative for MHC-I). In 9 cases, staining for B2M or MHC-I was difficult to determine because of high background, poor tissue preservation, ambiguous staining of HRS cells, or insufficient HRS cells for accurate assessment. The cases with unclear B2M expression were not assigned to groups and were excluded from further analysis. We conclude that unlike diffuse large B-cell lymphoma, in which various mechanisms account for loss of MHC-I expression,33 mutations in B2M are the most common cause of MHC-I loss in cHL.

B2M validation by immunohistochemistry and correlation with subtype and EBV status. (A) Hematoxylin and eosin (H&E) staining and immunohistochemical staining for B2M and for MHC-I are shown for 2 representative cases of cHL. Case 1 has wild-type B2M sequences, whereas case 7 is mutated for B2M, indicating that this genomic alteration can be determined by lack of B2M expression in HRS cells. Correspondingly, case 1 shows clear Golgi and membrane localization of MHC-I, whereas staining is diffuse in the cytoplasm in case 7, indicating mislocalization. Original magnifications ×20 (H&E) and ×60 (B2M and MHC-I). (B) There was a significant correlation between the lack of B2M expression and the NS subtype of cHL, and between the presence of B2M expression and the MC subtype of cHL. Cases classified as “Others” include 1 case of lymphocyte-rich cHL and cases with features of both NS and MC, making the distinction challenging. (C) A cohort of patients with HIV infection and cHL was evaluated for B2M expression; however, the relationship of histologic subtype and B2M expression did not reach statistical significance in this cohort. (D) The presence of EBV in the HRS cells was assessed by in situ hybridization for Epstein-Barr encoding region. EBV-negative cases were more frequently also negative for B2M; however, among the EBV-positive cases, both B2M-positive and B2M-negative cases were identified. IC, immunocompetent; neg, negative; pos, positive.
B2M validation by immunohistochemistry and correlation with subtype and EBV status. (A) Hematoxylin and eosin (H&E) staining and immunohistochemical staining for B2M and for MHC-I are shown for 2 representative cases of cHL. Case 1 has wild-type B2M sequences, whereas case 7 is mutated for B2M, indicating that this genomic alteration can be determined by lack of B2M expression in HRS cells. Correspondingly, case 1 shows clear Golgi and membrane localization of MHC-I, whereas staining is diffuse in the cytoplasm in case 7, indicating mislocalization. Original magnifications ×20 (H&E) and ×60 (B2M and MHC-I). (B) There was a significant correlation between the lack of B2M expression and the NS subtype of cHL, and between the presence of B2M expression and the MC subtype of cHL. Cases classified as “Others” include 1 case of lymphocyte-rich cHL and cases with features of both NS and MC, making the distinction challenging. (C) A cohort of patients with HIV infection and cHL was evaluated for B2M expression; however, the relationship of histologic subtype and B2M expression did not reach statistical significance in this cohort. (D) The presence of EBV in the HRS cells was assessed by in situ hybridization for Epstein-Barr encoding region. EBV-negative cases were more frequently also negative for B2M; however, among the EBV-positive cases, both B2M-positive and B2M-negative cases were identified. IC, immunocompetent; neg, negative; pos, positive.
B2M inactivation, as evidenced by the lack of protein expression in HRS cells, confirmed a remarkable association with the NS subtype (86/115 cases, 75%). B2M inactivation was less common in cases of MC cHL (9/40; 22%; P < .0001), indicating that this immunohistochemical marker is a useful distinguisher of histologic type (Figure 5B). We also evaluated 29 cases of cHL occurring in individuals with HIV infection, 18 (62%) of which were found to be B2M negative (Figure 5C). Among the HIV-associated cHL cohort, the association with histologic subtype was more tenuous (P = .11), consistent with the notion that B2M inactivation is associated with immunologic pressure. Correlation of B2M expression with EBV status was evaluated, confirming that EBV-negative cases were more frequently B2M negative (P = .005), albeit with many outliers (Figure 5D), consistent with previous reports.34
Lack of expression of B2M identifies a type of cHL that presents in younger patients, at an earlier stage, and with a better clinical outcome
We assessed the clinical significance of B2M in those cases for which information was available (n = 145; 52 B2M-positive cases and 93 B2M-negative cases). There was a statistically significant association with older age among the B2M-positive cases (median age of 47 vs 30 years; P ≤ .0001) and stage III/IV disease (P = .001), and with male predominance (P = .037) and bulk disease (P = .029) (Table 2). Cases that lacked B2M expression belonged to a better clinical outcome category (10-year progression-free survival of 74% vs 49%; P = .026; and overall survival of 87% vs 66%; P = .013) (Figure 6). There was also a trend toward better overall survival and progression-free survival in the B2M-negative cohort for patients with stage III/IV disease but not for patients with stage I/II disease (Figure 6). On multivariate analysis, B2M expression was not found to be an outcome predictor independent of age in our cohort, but larger cohorts are needed to determine the relevance of B2M as an independent predictor of clinical outcome. These results indicate that mutations in B2M leading to lack of protein expression identify a type of cHL that occurs in younger patients with lower-stage disease and that has a better prognosis than when this specific molecular alteration is not present.
Clinical characteristics of patients by B2M immunohistochemistry
| Total cohort | Β2M positive | Β2M negative | P | |
|---|---|---|---|---|
| Median age (range), y | 32 (11-85) | 47 (11-85) | 30 (13-76) | <.0001* |
| Males, n (%) | 80/145 (55) | 35/52 (67) | 45/93 (48) | .037* |
| Histology | ||||
| NS, n (%) | 105/145 (72) | 25/52 (48) | 80/93 (86) | <.0001* |
| MC, n (%) | 30/145 (21) | 23/52 (44) | 7/93 (8) | <.0001* |
| Other or | ||||
| intermediate, n (%) | 9/145 (6) | 3/52 (6) | 6/93 (6) | 1 |
| Stage | ||||
| I/II, n (%) | 84/129 (66) | 20/45 (44) | 63/85 (74) | .0011* |
| III/IV, n (%) | 47/129 (36) | 25/45 (56) | 22/85 (26) | .0011* |
| B symptoms, n (%) | 47/113 (41) | 19/39 (49) | 28/74 (38) | .32 |
| Bulk disease, n (%) | 17/127 (13) | 2/47 (4) | 15/80 (19) | .029 |
The total cohort included 145 patients; 52 B2M positive and 93 B2M negative.
Statistically significant difference according to a P value of <.05.

Lack of expression of B2M is associated with a better clinical outcome in advanced disease. Kaplan-Meier curves of cases with clinical information show that positivity for B2M by immunohistochemistry in the HRS cells associates with a poor progression-free survival (PFS) and overall survival (OS), as compared with cases that lack B2M expression in the entire cohort (top row). The middle row shows Kaplan-Meier curves for patients with stages I and II cHL; the bottom row shows Kaplan-Meier curves for patients with stages III and IV cHL. Among patients with advanced stage, but not in patients with early-stage cHL, positivity for B2M by immunohistochemistry in the HRS cells showed a trend for poor OS, as compared with cases that lack B2M expression. NS, not significant.
Lack of expression of B2M is associated with a better clinical outcome in advanced disease. Kaplan-Meier curves of cases with clinical information show that positivity for B2M by immunohistochemistry in the HRS cells associates with a poor progression-free survival (PFS) and overall survival (OS), as compared with cases that lack B2M expression in the entire cohort (top row). The middle row shows Kaplan-Meier curves for patients with stages I and II cHL; the bottom row shows Kaplan-Meier curves for patients with stages III and IV cHL. Among patients with advanced stage, but not in patients with early-stage cHL, positivity for B2M by immunohistochemistry in the HRS cells showed a trend for poor OS, as compared with cases that lack B2M expression. NS, not significant.
Discussion
We report the first full-exome deep sequencing of purified HRS cells from cHL tumor specimens and describe consistent alterations in oncogenic biological processes and considerable heterogeneity among cHL cases. The genomic study was limited to 10 cases that were cryopreserved at our institutions, potentially limiting discovery of the less-frequent genomic alterations in this disorder. The median depth of sequencing (48×) was sufficient for highly prevalent mutations, although it may be less sensitive to detect subclonal variants. In addition, the retrospective clinical data we relied on to elucidate the relationship between B2M and treatment outcome in cHL were limited to few institutions and could therefore be underpowered to detect significant clinical associations. Clearly, larger patient cohorts with increased sequencing depth would further expand our knowledge of cHL-defining genomic alterations and the clinical association between the mutations and outcomes with specific therapies. The approach we developed in this study opens the opportunity for these larger future investigations to take place. Because personalization of therapy based on genomic alterations has become increasingly accepted for oncology patients, the method reported here could potentially offer the benefits of genomics-driven therapies to cHL patients. In addition, we anticipate that the methodology we developed in the process of the study has numerous applications beyond cHL biology. The integration of ultralow input with standard DNA-sequencing pipelines allows streamlined genomic studies of very small samples such as fine-needle aspirate specimens from multiple tumor types and sorted samples in the context of minimal residual disease detection.
The overall oncogenome of cHL contains alterations in genes responsible for interactions with the immune system, preservation of genomic stability, and transcriptional regulation. Some of these alterations have previously been described in hematologic and nonhematologic malignancies and are potentially therapeutically targetable (reviewed in Table 3).35-44 Among the genes recurrently altered in cHL, some encode proteins that have been proposed to play a role in lymphomagenesis, although mutations in these genes have not been previously described in lymphoid malignancies. PIM kinases are overexpressed in chronic lymphocytic leukemia, mantle cell lymphoma, and multiple myeloma; and in vitro inhibition results in cellular toxicities.41,42,45 Inhibitors of WEE1 enhance killing of Burkitt lymphoma cells.46 NEK1+/− mice develop lymphomas late in life with a much higher incidence than wild-type littermates.47 The functional and pathological roles of these newly discovered genetic alterations in the context of cHL are yet to be determined; this is challenging because of the lack of cHL animal models or cell culture systems that include the tumor cell microenvironment.
Genes recurrently altered, with targeted therapy approved or in clinical trials
| Name of altered gene | No. of altered samples | Potential therapeutic treatment | Reference |
|---|---|---|---|
| ABL1 | 3 | Dasatinib, Nilotinib, Ponatinib, AS703569, AT9283, Bafetinib, Bosutinib, Imatinib, XL228, Saracatinib | |
| ATM | 5 | Niraparib, Olaparib, BMN673, Rucaparib, Veliparib | 35 |
| BIRC3 (cIAP2) | 5 | AEG40826, TL 32711, AT-406, GDC0917, LCL161 | 36 |
| BRCA2# | 3 | Rucaparib, Olaparib, BMN673, E7449, Niraparib, Veliparib, | 37 |
| CD274 (PDL1) | 4 | MDX-1105, MPDL3280A, MDX-1105, RG7446 | 38 |
| CDK4 | 2 | PD0332991, Alvocidib, Palbociclib, LY2835219, BAY1000394, and others | 39 |
| JAK2 | 3 | Ruxolitinib, AZD1480, LY2784544, AT9283, SAR30250, INCB280503, TG101348, XL019, ITF2357, INCB018424 | 40 |
| PIM2 | 2 | SGI-1776 | 41,42 |
| UBE2A* | 6* | DKCI-73, Seliciclib (Roscovitine), CR8, P276-00, Dinaciclib (SCH727965), Alvocidib (Flavopiridol), SNS-032, BAY1000394 | 39,43 |
| WEE1 | 2 | MK-1775 | 44 |
| XPO1 | 5 | Selinexor (KPT-330) |
Mutations in the BRCA2 gene render cells sensitive to poly(ADP-ribose) polymerase (PARP) inhibition; therefore, PARP inhibitors are listed.
UBE2A is amplified in 3 cases and there are splice-site alterations in 3 cases (1 case also has a nonsynonymous mutation). UBE2A is phosphorylated and activated by CDK9, for which inhibitors are available (note that SNS-032 and CDKI-73 are selective CDK9 inhibitors, whereas others inhibit multiple cyclin-dependent kinases).
The role of B2M in cHL pathogenesis deserves particular mention. There have been numerous important studies aimed at predicting the treatment outcome in cHL.20 Many of these studies have focused on the immune response and tumor microenvironment. For example, increased numbers of cytotoxic T cells correlate with poor outcomes,48,49 whereas the presence of intratumoral FOXP3+ regulatory T cells and a FOXP3-to-granzyme B ratio of >1 are associated with better survival.48,50 A gene expression profiling study of whole cHL biopsies showed that CD68 RNA levels and intratumoral macrophage infiltration also predict disease-specific survival.51 The tumor inflammatory cells may be affected by antigen presentation and the production of inflammatory mediators by the HRS cells. Accordingly, several reports have shown a lack of expression of MHC classes I and II by HRS cells.34,52-54 MHC-I is expressed by virtually all nucleated cells and is essential for recognition of antigen by CD8 cytotoxic T cells. It consists of an α chain encoded in the MHC genetic locus together with a β chain (B2M). Oudejans et al first documented a lack of expression of MHC-I and B2M in the HRS cells of a significant proportion of cHL cases, and reported that EBV-positive cases expressed significantly higher levels of MHC-I and B2M molecules than cases lacking EBV, although the association was not absolute.34 This observation was confirmed by others52-54 and led to the proposal that EBV provides alternative molecular mechanisms for avoiding tumor immunity. A lack of MHC-I expression in HRS cells was also reported as an independent adverse prognostic factor in cHL.54 We show here that the molecular mechanism leading to MHC-I downregulation in HRS cells is through inactivating mutations of B2M, and these mutations likely explain specific clinical and histologic characteristics. Our observations are also in line with a recent report demonstrating B2M mutations in 2 cell lines and showed concordant MHC-I downregulation.6
We show that unsupervised clustering of recurrent mutations reveals a close association between inflammatory background-based (NS vs MC) and molecular categorizations of the disease. In particular, all the cases of NS that we sequenced had B2M-inactivating mutations and NF-κB pathway–activating alterations (via TNFAIP3 alterations or EBV infection). In contrast, the cases classified as MC were more heterogeneous molecularly, and no single defining alteration or pathway was found in any of the 3 cases. Remarkably, expression of a single protein (B2M) can serve as a useful proxy for this molecular characterization of cHL. Our data indicate that B2M mutations result in a lack of protein expression that can be used to identify a specific molecular category of cHL, characterized in most cases by the NS histology. These results are consistent with studies showing that the NS type of cHL has a better prognosis and occurs in younger patients with lower-stage disease.14-17 In contrast, cases with B2M protein expression did not reveal definable molecular characteristics and appear to correspond to a more molecularly heterogeneous group, presenting at an older age and with worse clinical outcome. Because our genomic sampling of B2M wild-type cases was limited, we anticipate that the sequencing of larger panels of such cases will reveal additional molecular subtypes or unifying characteristics. It will be interesting to determine in larger cohorts whether the subset of B2M-positive NS cases have distinguishing clinical and molecular features. Our methodology provides an opportunity for further prospective comprehensive genomic exploration of the less common subtypes of cHL and of treatment-resistant and recurrent disease.
There is an Inside Blood Commentary on this article in this issue.
The online version of this article contains a data supplement.
The publication costs of this article were defrayed in part by page charge payment. Therefore, and solely to indicate this fact, this article is hereby marked “advertisement” in accordance with 18 USC section 1734.
Acknowledgments
The authors thank Maryke Appel of KAPA Biosystems, Daniel Burgess of Roche NimbleGen, and Chad Locklear of Integrated DNA Technologies for thoughtful discussions regarding library preparation, exome capture, and adapter oligos.
This work was supported by the Department of Pathology and Laboratory Medicine of Weill Cornell Medical College; the Tri-Institutional Training Program in Computational Biology and Medicine (J.R.); the Schwartz Family Research Fund and the Robert H. Lurie Comprehensive Cancer Center (providing support for tissue microarrays from the Chicago cohorts); the Brazilian Ministry of Higher Education Foundation CAPES (Coordination for the Improvement of Higher Education Personnel) (R.G.); the Ministry of Health (RF 2010-2313979) (C.C.-S. and G.I.); and the Italian Association for Cancer Research grant 15835 (C.C.-S.).
Authorship
Contribution: E.C. and M.R. conceived of the experiment, advised on every aspect, and conceived of the manuscript; M.R. and J.R. sorted primary cases; J.R., R.G., and M.R. optimized and constructed libraries; J.R. analyzed data computationally with O.E., who advised on the computational analyses; M.R. performed the transfection experiment; E.C., A.C., P.G.R., L.G.-R., G.I., C.C.-S., A.S., and D.R. compiled clinical cohort data; P.G.R. and L.G.-R. ran the survival analysis; Y.L., W.T., A.C., and E.C. performed immunohistochemistry and evaluated the staining; K.E. examined samples for loss-of-heterozygosity (not reported); J.B. provided a primary sample; and J.T. performed validation of B2M mutations using Sanger sequencing (not shown).
Conflict-of-interest disclosure: The authors declare no competing financial interests.
The current affiliation for M.R. is Departments of Laboratory Medicine and Pathology, Memorial Sloan Kettering Cancer Center, New York, NY.
Correspondence: Mikhail Roshal, Departments of Laboratory Medicine and Pathology, Memorial Sloan Kettering Cancer Center, 1275 York Ave, New York, NY 10065; e-mail: roshalm@mskcc.org; and Ethel Cesarman, Department of Pathology and Laboratory Medicine, Weill Cornell Medical College, 1300 York Ave, New York, NY 10065; e-mail: ecesarm@med.cornell.edu.
