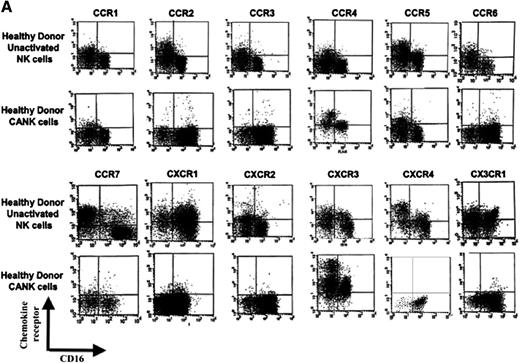
In the 15 November 2005 issue, there are errors in Figures 2, 4, 5, and 7. In Figure 2A on page 3469, the authors would like to explicitly clarify that the representative fluorescence-activated cell sorting (FACS) staining for unactivated NK cells were presented in a previous article from the authors' laboratory,1 as they were representative of 3 to 23 independent replicates performed as indicated in the figure legend. Importantly, the CANK data presented were obtained and analyzed simultaneously with unactivated NK cells shown in Figure 2A. FACS plots for CXCR4 and CCR2 on CANK cells were inadvertently duplicated in Figure 2A. The corrected Figure 2A is shown, featuring the validated CXCR4 staining on CANK cells.

Chemokine receptor distribution on the cell surfaces of healthy donor–derived NK-cell subsets. Unactivated peripheral NK cells and CANK cell lines were generated and quadruple stained, as described in “Materials and methods.” (A) Chemokine receptor expression on healthy donor CD16+ and CD16− unactivated NK and CANK cells. (B-C) Representative chemokine receptor expression values on unactivated NK and CANK cells based on their CD16 phenotype. Indicated values represent the percentage of cells of the total cell population positive for a certain chemokine receptor. (D-G) Time-dependent changes in chemokine receptor expression on NK cells stimulated with 50 U/mL IL-2 in comparison with CANK cells. (D) CXCR3 changes on CD16+ NK. (E) CXCR4 changes on CD16− NK. (F) CCR2 changes on polyclonal NK. (G) CX3CR1 changes on CD16+ NK. Values indicate mean fluorescence intensity (MFI) values for each staining. (H) Migration assay for healthy donor polyclonal unactivated NK (light gray) and CANK cell lines (dark gray) to multiple chemokines at optimal concentration levels was performed, as described in “Materials and methods.” Matching receptor and concentration used for each chemokine are indicated in brackets. Results are from 1 representative experiment of 3 to 23 experiments performed.

Chemokine receptor distribution on the cell surfaces of healthy donor–derived NK-cell subsets. Unactivated peripheral NK cells and CANK cell lines were generated and quadruple stained, as described in “Materials and methods.” (A) Chemokine receptor expression on healthy donor CD16+ and CD16− unactivated NK and CANK cells. (B-C) Representative chemokine receptor expression values on unactivated NK and CANK cells based on their CD16 phenotype. Indicated values represent the percentage of cells of the total cell population positive for a certain chemokine receptor. (D-G) Time-dependent changes in chemokine receptor expression on NK cells stimulated with 50 U/mL IL-2 in comparison with CANK cells. (D) CXCR3 changes on CD16+ NK. (E) CXCR4 changes on CD16− NK. (F) CCR2 changes on polyclonal NK. (G) CX3CR1 changes on CD16+ NK. Values indicate mean fluorescence intensity (MFI) values for each staining. (H) Migration assay for healthy donor polyclonal unactivated NK (light gray) and CANK cell lines (dark gray) to multiple chemokines at optimal concentration levels was performed, as described in “Materials and methods.” Matching receptor and concentration used for each chemokine are indicated in brackets. Results are from 1 representative experiment of 3 to 23 experiments performed.
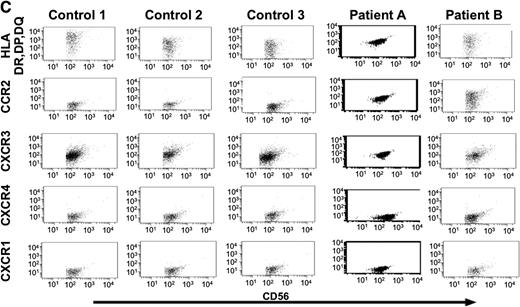
In Figure 4 on page 3470 and Figure 7C on page 3471, inadvertent duplication in the assembly of FACS panels occurred. In Figure 4, duplication occurred in unactivated T cells from patient A and C samples, unactivated NK cells from the control, and mother samples. In Figure 7C, duplication occurred between controls and patients' samples. Because the authors could not track down the original FACS data files for these stainings, the experiments were repeated with all ethical and experimental approvals in place. The corrected Figures 4 and 7C are shown (patient A staining was not replaced in Figure 7C).

Specific augmented expression of CCR2 on CANK cells derived from patients with TAP-2 deficiency. Surface expression levels of CCR2 on unactivated, CANK, and activated T cells derived from multiple blood samples obtained from healthy donors (representative staining for 1 of 23 healthy donors), the mother of patients A, B, and C with TAP-2 deficiency, and the patients themselves. Indicated values represent the percentages of cells positive for CCR2 of that total lymphocyte subset. Results are from 1 representative experiment of 3 experiments performed on lymphocytes and cell lines generated on 3 independent occasions from each donor.

Specific augmented expression of CCR2 on CANK cells derived from patients with TAP-2 deficiency. Surface expression levels of CCR2 on unactivated, CANK, and activated T cells derived from multiple blood samples obtained from healthy donors (representative staining for 1 of 23 healthy donors), the mother of patients A, B, and C with TAP-2 deficiency, and the patients themselves. Indicated values represent the percentages of cells positive for CCR2 of that total lymphocyte subset. Results are from 1 representative experiment of 3 experiments performed on lymphocytes and cell lines generated on 3 independent occasions from each donor.

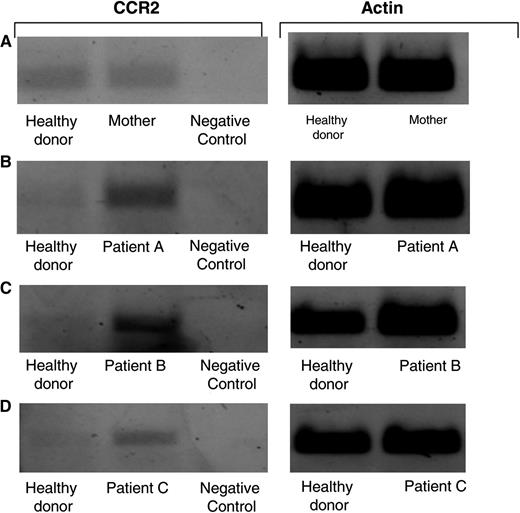
Increased mRNA levels of CCR2 receptor in TAP-2–deficient CANK cells. Semiquantative RT-PCR analysis for CCR2 mRNA levels was performed on various cDNA libraries obtained. Healthy donor–derived cDNA was prepared from an mRNA pool purified from equal numbers of CANK cells from 7 healthy persons. cDNA obtained from 1106 melanoma cell line was used as a negative control for CCR2 receptor. RT-PCR analysis was performed to compare intensities of CCR2 levels on CANK cell lines between healthy donors and (A) the mother of patients A, B, and C with TAP-2 deficiency, (B) patient A, (C) patient B, and (D) patient C. Results are from 1 independent experiment of 4 experiments performed.

Increased mRNA levels of CCR2 receptor in TAP-2–deficient CANK cells. Semiquantative RT-PCR analysis for CCR2 mRNA levels was performed on various cDNA libraries obtained. Healthy donor–derived cDNA was prepared from an mRNA pool purified from equal numbers of CANK cells from 7 healthy persons. cDNA obtained from 1106 melanoma cell line was used as a negative control for CCR2 receptor. RT-PCR analysis was performed to compare intensities of CCR2 levels on CANK cell lines between healthy donors and (A) the mother of patients A, B, and C with TAP-2 deficiency, (B) patient A, (C) patient B, and (D) patient C. Results are from 1 independent experiment of 4 experiments performed.

Analysis of NK cells and cytokines in serum and bronchioalveolar lavage samples from patients with TAP-2 deficiency. (A) Serum samples obtained from patients A, B, and C, their mother, and 9 healthy donors were analyzed by ELISA assays for the detection of MCP-1 ( ), SDF1 (□), IP10 (■), and secondary lymphoid tissue chemokine (SLC;
  ) chemokines. Results are of 1 representative experiment of 3 experiments performed on serum samples obtained on 3 independent occasions from each donor. (B) MCP-1 (
 ) and IL-2 (□) levels in BAL samples obtained from patients A and B were compared with those in BAL samples obtained from 5 controls without underlying pulmonary disease. (C) Purified NK cells from BAL samples obtained from patients A and B were compared with those of BAL samples obtained from 3 immunosuppressed patients with sustained lung infection and inflammation and were analyzed for the expression of HLA-DR, DP, DQ, CCR2, CXCR3, CXCR4, and CXCR1 receptors. **P < .001 by Student t test. Error bars indicate SD.

Analysis of NK cells and cytokines in serum and bronchioalveolar lavage samples from patients with TAP-2 deficiency. (A) Serum samples obtained from patients A, B, and C, their mother, and 9 healthy donors were analyzed by ELISA assays for the detection of MCP-1 ( ), SDF1 (□), IP10 (■), and secondary lymphoid tissue chemokine (SLC;
  ) chemokines. Results are of 1 representative experiment of 3 experiments performed on serum samples obtained on 3 independent occasions from each donor. (B) MCP-1 (
 ) and IL-2 (□) levels in BAL samples obtained from patients A and B were compared with those in BAL samples obtained from 5 controls without underlying pulmonary disease. (C) Purified NK cells from BAL samples obtained from patients A and B were compared with those of BAL samples obtained from 3 immunosuppressed patients with sustained lung infection and inflammation and were analyzed for the expression of HLA-DR, DP, DQ, CCR2, CXCR3, CXCR4, and CXCR1 receptors. **P < .001 by Student t test. Error bars indicate SD.
In Figure 5 on page 3470, the wrong gel images belonging to a different experiment were inadvertently used and misassembled. To resolve this, the authors repeated this experiment with all ethical and experimental approvals in place. The corrected Figure 5 is shown.
These inadvertent mistakes do not change the conclusions made in the article. The authors apologize for these mistakes.
1. Hanna J, Wald O, Goldman-Wohl D, et al. CXCL12 expression by invasive trophoblasts induces the specific migration of CD16− human natural killer cells. Blood. 2003;102(5):1569-1577.

This feature is available to Subscribers Only
Sign In or Create an Account Close Modal