Abstract
Introduction:
Azacytidine (Aza) is first-line treatment for patients with higher-risk MDS but only around 50% of patients respond to therapy. Overall survival for this patient group is short and clinical decision-making tools are highly warranted. As Aza may improve survival also in patients with hematologic improvement or stable disease, survival may be a better response predictor than response rate.
Methods:
We evaluated the impact of clinical parameters (n=134), mutations (n=90) and DNA methylation profiles (n=42) on response and survival in a cohort of consecutive patients with higher-risk MDS treated with Aza. Targeted sequencing of 42 genes involved in myeloid disease and Illumina 450 methylation arrays were applied for mutational assessment and methylation profiling, respectively. The IWG criteria were used for response scoring.
Results:
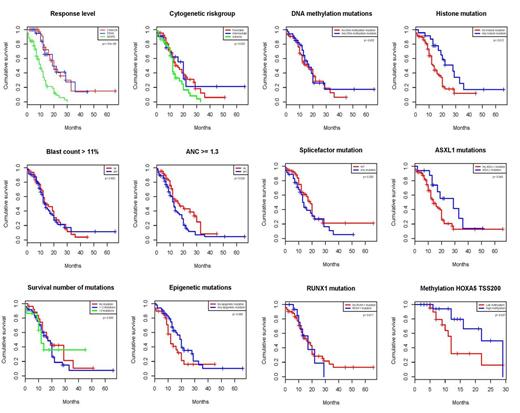
Patients were eligible for analysis if they had received ≥1 dose of Aza. Median number of cycles given was 6 (range 1-29). Responses were scored as CR (22%), mCR (11%), PR (3%), HI (13%), SD (27%) and PD (13%). Fifteen patients (11%) were not evaluated for response due to early death. Disease duration was negatively associated with both response (p=0.035) and survival (p=0.001). Adverse cytogenetics and high absolute neutrophil count was associated with shorter survival (p=0.03 and p=0.02) but not with response.
No single mutation or group of mutations was associated with response although there was a weak positive trend for TET2 and ASXL1. When using survival as endpoint, ASXL1 showed a strong trend towards prolonged survival (median 29 vs 14 months, p=0.07) and, importantly, the group of patients with any mutation in histone modulators (ASXL1, EZH2, MLL) had a significant longer survival (median 28 vs 13 months, p=0.01). This remained significant in the cox regression model (HR 0.3223 (0.16-0.70 95% CI); p=0.002). No other mutations or group of mutations were associated with survival. Interestingly, previously reported negative prognostic factors including RUNX1 (p=0.82), TP53 (p=0.54), and the number of mutations (p=0.37), were not associated with survival in this Aza-treated cohort
DNA methylation profiling identified 233 differentially methylated regions (DMRs) between responders and non-responders, corresponding to 200 genes, including six HOX-genes, which were highly enriched for gene ontology pathways involved in development and differentiation. High methylation of HOXA5, the most significant DMR, was associated with prolonged survival (22 vs 12 months, p=0.03). We also studied the methylation level of HOXA5 in CD34+ cells from patients with high-risk MDS and sorted compartments during myeloid differentiation in normal bone marrow. The methylation profile in responding patients was closer to that of differentiated cells while non-responding cells were closer to progenitor cells.
Discussion:
Single mutations have a limited impact on response rates. Howver, we demonstrate a clear survival benefit for patients with mutations in histone modulators, which previously have been reported as negative prognostic factors (Bejar, NEJM 2013; Haferlach, Leukemia 2014). Moreover, several negative risk factors, such as RUNX1, TP53, and the number of mutations were neutralized by Aza. Histone modulation mutations may therefore be used in the clinical decision-making for higher-risk MDS. We demonstrate for the first time that methylation profiles in genes involved in differentiation and development differ between responders and non-responders and that hypermethylation of HOXA5 is positively associated with survival (p=0.03). Since methylation pattern in HOXA5 is linked to differentiation status, we hypothesize that non-responding patients are skewed towards more immature differentiation.
DNA methylation levels at the HOXA5 locus. Squares represent gene location with light green=TSS-1500; Dark green=TSS-200; Red=Gene body; Magenta=1st Exon; Dark blue=5’UTR; Cyan=3’UTR and diamonds represent sample values. A=Median methylation level of responders illustrated with orange diamonds (MNCs) and non-responders with blue diamonds (MNCs). B=Added CD34+ cells with red diamonds. C=All patients. D=Normal bone marrow with PMN illustrated with brown diamonds and CMP with green diamonds.
DNA methylation levels at the HOXA5 locus. Squares represent gene location with light green=TSS-1500; Dark green=TSS-200; Red=Gene body; Magenta=1st Exon; Dark blue=5’UTR; Cyan=3’UTR and diamonds represent sample values. A=Median methylation level of responders illustrated with orange diamonds (MNCs) and non-responders with blue diamonds (MNCs). B=Added CD34+ cells with red diamonds. C=All patients. D=Normal bone marrow with PMN illustrated with brown diamonds and CMP with green diamonds.
No relevant conflicts of interest to declare.
Author notes
Asterisk with author names denotes non-ASH members.


This feature is available to Subscribers Only
Sign In or Create an Account Close Modal