Abstract
The molecularly defined cell-of-origin (COO) subtypes of diffuse large B-cell lymphoma (DLBCL), activated B-cell like (ABC) and germinal center B-cell like (GCB), have distinct underlying biology and outcomes in the R-CHOP treatment era. The recent advent of therapeutic agents that show subtype-specific activity has made the robust assignment of COO increasingly important for identifying patients that will respond to these agents. Although it has become common practice to use widely applicable immunohistochemistry-based algorithms to assign COO, these methods are reported to have widely variable concordance with COO as determined by gene expression profiling (GEP). Furthermore, using these IHC-based algorithms, the relationship between COO and treatment outcome to R-CHOP has been very inconsistent. We recently described an accurate and robust gene expression based assay for determining COO applicable to formalin-fixed paraffin-embedded (FFPE) biopsies. Here we sought to determine the prognostic significance of COO assigned using this assay and the relationship with other established prognostic factors.
The Lymph2Cx assay, a 20 gene assay based on NanoString technology, was applied, as previously described (Scott et al Blood 2014;123:1214-17), to RNA extracted from the diagnostic FFPE biopsies (tumor content ≥ 60%) of 274 patients with de novo DLBCL. The median follow-up of living patients within this cohort, uniformly treated with R-CHOP at the BC Cancer Agency (Vancouver, Canada) was 6.1 years (range 1.2 – 13.2). Tissue microarrays of duplicate 0.6mm cores were stained for MYC and BCL2 (DAKO 124) to assess the proportion of tumor cells that expressed these proteins. Identification of MYC+/BCL2+ tumors (as described in Johnson et al J Clin Oncol 2012; 30: 3452-9; cut-offs: MYC ≥ 40%, BCL2 ≥ 50%) was performed independently by two expert hematopathologists (AM and PF) with consensus on discordant cases reached with a third hematopathologist (RDG).
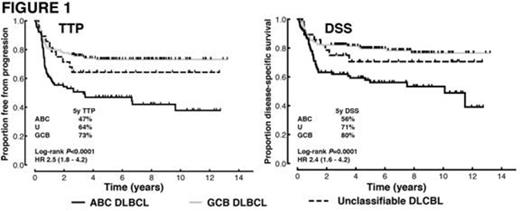
GEP data of sufficient quality was obtained from 271/274 (99%) of the biopsies, assigning the following COOs: 90 (33%) ABC, 153 (56%) GCB and 28 (10%) were unclassifiable. In comparison with the GCB group, the ABC group had a greater proportion of patients with stage III/IV disease (63% vs 45%, P=0.01) and higher IPI scores (P=0.03). The ABC subtype was associated with significantly inferior outcomes compared with the GCB group (Figure 1). This association was independent of IPI groupings (low (0-1), intermediate (2-3) and high (4-5)) in multivariate analyses. The prognostic significance of the COO was most evident in the intermediate IPI group (5 year time-to-progression (TTP) ABC 45% vs GCB 71%; log-rank P=0.001, HR 2.7 (95% CI 1.6 – 6.3)).
It has been proposed that the prognostic power of COO is largely attributable to the greater proportion of MYC+BCL2+ cases within the ABC subtype (Hu et al Blood 2013; 121: 4021-31). We confirm that the proportion of tumors that are MYC+/BCL2+ by IHC is significantly higher in the ABC vs GCB subtype (57% vs 21%, P<0.001). However, multivariate analyses demonstrated that COO was significantly associated with TTP and disease specific survival, independent of MYC/BCL2 IHC. The significant association between MYC+/BCL2+ IHC and inferior outcomes was only observed in the GCB group, while the association between COO and treatment outcomes was observed only in the non-MYC+/BCL2+ group (Figure 2). When multivariate analyses were performed including the IPI groupings, MYC/BCL2 IHC and COO as variables, only the IPI and COO were significantly associated with TTP.
We have previously shown the accuracy of the Lymph2Cx assay at assigning COO, establishing its potential as a predictive biomarker. This large study of R-CHOP treated patients demonstrates that this assay separates patients into groups with significantly different outcomes, recapitulating the results of COO assigned using GEP on frozen tissue (Lenz et al N Engl J Med 2008; 359: 2313-23). Furthermore, the prognostic significance is independent of established and recently described prognostic factors providing additional support for its use in clinical trials and, ultimately, routine clinical practice.
Treatment outcomes according to COO. Log-rank P values are for the comparison between ABC and GCB subgroups. HR: hazard ratio with the 95% CI in brackets.
Treatment outcomes according to COO. Log-rank P values are for the comparison between ABC and GCB subgroups. HR: hazard ratio with the 95% CI in brackets.
Treatment outcomes according to COO and MYC/BCL2 immunohistochemistry.
Scott:NIH: Patents & Royalties. Wright:NIH: Patents & Royalties. Staudt:NIH: Patents & Royalties. Connors:NIH: Patents & Royalties. Rimsza:NIH: Patents & Royalties. Gascoyne:NIH: Patents & Royalties; Celgene: Consultancy.
Author notes
Asterisk with author names denotes non-ASH members.


This feature is available to Subscribers Only
Sign In or Create an Account Close Modal