Abstract
Introduction
Immune mediated self-response is an established feature of aplastic anaemia (AA) and up to 70% of patients respond to immunosuppressive therapy (IST). Reduced number and function of Tregs and an increase in Th17 cells, similar to other autoimmune conditions, have been reported in AA. Nevertheless, the potential role of these cells in response to IST is not fully understood. Our understanding of human Tregs and Th17 cells and their plasticity has been greatly improved by discovery of phenotypically and functionally distinct subsets. However, due to low number of such cells and technical difficulties for multicolour staining, it is challenging to investigate these subsets in AA and their potential role in response to IST.
Mass cytometry (as implemented in the Fluidigm CyTOF instrument) is a technology which allows functional phenotypying of currently up to 40 parameters on a single cell level. In contrast to conventional polychromatic flow cytometry, where the overlap of fluorochrome emission spectra limit the maximum number of 12-14 markers, mass cytometry uses metal isotope-conjugated antibodies to enable "deep immune profiling".
We have designed mass cytometry panels for both cell surface and intracellular antigens and used the CyTOF instrument to acquire immune signatures of peripheral blood (PB) samples of AA patients.
Patients and Methods
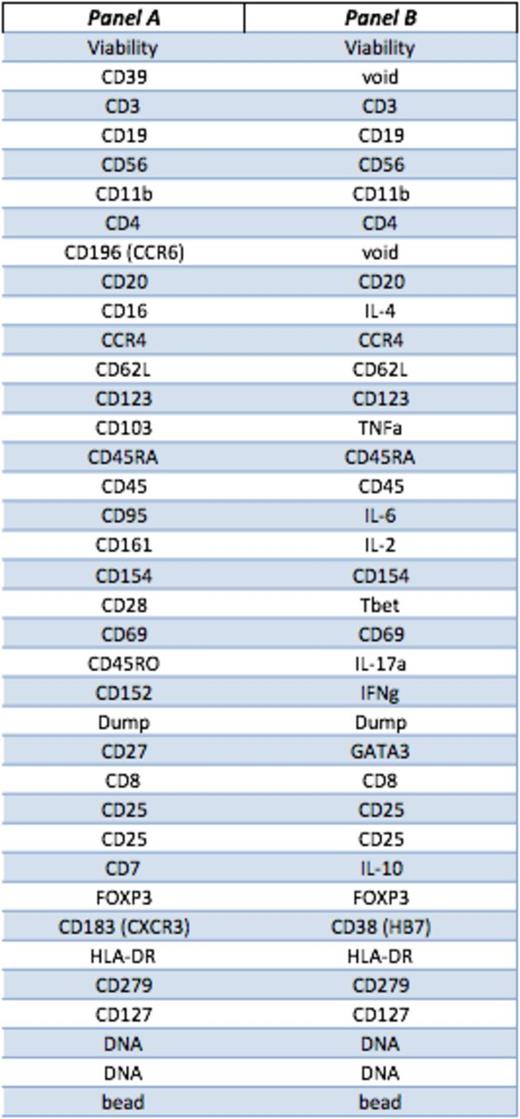
Peripheral blood samples from 9 AA patients (7 responders to IST, 2 non-responsers) and 2 healthy donors were collected at diagnosis and following treatment with rabbit or horse ATG and ciclosporin. PBMCs were rested overnight and stained (surface and intracellular) without and with 4 hours stimulation with Phorbol 12-myristate 13-acetate (PMA)/ ionomycin. We designed and optimised 2 separate panels of antibodies based on 41 surface markers, transcription factors and cytokines (table 1). Each antibody is tagged with a unique lanthanide isotope. Acquired data were analysed as .fcs files by both conventional gating and multidimensional Spanning tree Progression of Density normalized Events (SPADE) clustering.
Results
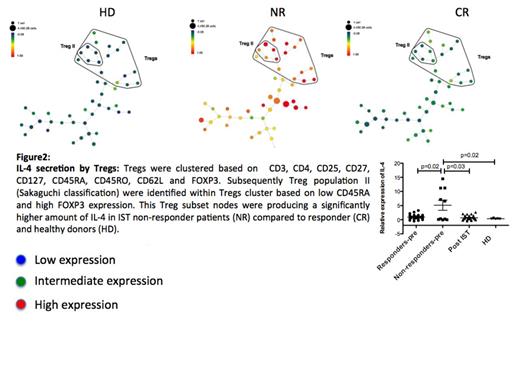
Viable Lymphocytes were identified by gating on cell length, DNA content, Rh viability dye and CD45 expression. Tregs were then clustered based on CD3, CD4, CD25, CD27, CD127, CD45RA, CD45RO, CD62L and FOXP3. Treg subset II (as defined by Sakaguchi, et al) was identified within total Tregs, based on CD45RA_lo, CD127_lo and FOXP3_hi. The relative expression of all the other markers on Treg II cluster was then calculated based on median values and scale cofactor.
AA Tregs at diagnosis expressed significantly higher CD45RA (p<0.001), CD127 (p<0.001), CD7 (p=0.04), CD69 (p=0.03), CD103 (p=0.02), T-bet (p=0.01), and IL-4 (p=0.008) compared to HD, whereas the expression of CD152 (CTLA-4) and HLA-DR were significantly lower in AA (p=0.04 and p=0.03).
When patients were grouped as responders and non-responders to IST, Tregs from non-responders patients expressed significantly higher CD11b (p=0.04), CD45RA (p<0.001), CD127 (p<0.001), CCR4 (p=0.02), IL-2 (p=0.03), IL-4 (p=0.02), IL-6 (p=0.04), T-bet (p=0.008), IL-17 (p=0.01) and GATA3 (p<0.001) while the expression of FOXP3 (p=0.03), CD7 (p=0.01) and CD25 (p=0.03) was lower compared to responders.
Following IST the expression of CD45RA, CD7 and IL-4 by Tregs were reduced (p=0.004, p<0.001 and p=0.02) whereas CD152 increased (p<0.01) compared to pre-treatment Tregs. When Treg cytokine profiles following response to IST were compared to pre-treatment Tregs from non responder patients, we have noticed a significantly lower secretion of other pro-inflammatory cytokines including IL-6 (p=0.01) and IL-17 (p=0.03) as well as IL-2 (p=0.03) by post IST Tregs. These Tregs were also less T-bet positive (p=0.02)(figures 1 and 2).
Conclusions
We demonstrate the ability of mass cytometry to define in high resolution the immunophenotypes of very specific subsets of Tregs in AA that is extremely challenging by conventional flow-cytometry. Our data indicate that a combination of pro-inflammatory and activation markers defines a subset of Tregs, which could potentially predict response to IST. Similar studies in a larger cohort of patients should delineate a more specific immune signature for the evaluation of response and follow up of AA patients following non-transplant treatments.
No relevant conflicts of interest to declare.
Author notes
Asterisk with author names denotes non-ASH members.


This feature is available to Subscribers Only
Sign In or Create an Account Close Modal