

Key Points
Abnormal signatures in TGF-β1 signaling gene expression were identified in spleen and marrow from the Gata1low model of MF.
These signatures include abnormalities in individual gene (Id2, Stat1, mTOR) in spleen and of gene pathways (Smads and BMPs) in marrow.
Abstract
Primary myelofibrosis (PMF) is characterized by fibrosis, ineffective hematopoiesis in marrow, and hematopoiesis in extramedullary sites and is associated with abnormal megakaryocyte (MK) development and increased transforming growth factor (TGF)-β1 release. To clarify the role of TGF-β1 in the pathogenesis of this disease, the TGF-β1 signaling pathway of marrow and spleen of the Gata1low mouse model of myelofibrosis (MF) was profiled and the consequences of inhibition of TGF-β1 signaling on disease manifestations determined. The expression of 20 genes in marrow and 36 genes in spleen of Gata1low mice was altered. David-pathway analyses identified alterations of TGF-β1, Hedgehog, and p53 signaling in marrow and spleen and of mammalian target of rapamycin (mTOR) in spleen only and predicted that these alterations would induce consequences consistent with the Gata1low phenotype (increased apoptosis and G1 arrest both in marrow and spleen and increased osteoblast differentiation and reduced ubiquitin-mediated proteolysis in marrow only). Inhibition of TGF-β1 signaling normalized the expression of p53-related genes, restoring hematopoiesis and MK development and reducing fibrosis, neovascularization, and osteogenesis in marrow. It also normalized p53/mTOR/Hedgehog-related genes in spleen, reducing extramedullary hematopoiesis. These data identify altered expression signatures of TGF-β1 signaling that may be responsible for MF in Gata1low mice and may represent additional targets for therapeutic intervention in PMF.
Introduction
Transforming growth factor (TGF)-β1, the first member identified of a growth factor family involved in tissue development and repair,1 is expressed by all cell types but is particularly abundant in platelets (Plt) (20 mg/kg), the source for its original purification in 1983.2 Expression of TGF-β1 is regulated by TGF-β1 itself,3 whereas its activity is regulated by proteases that convert the latent complex into an active form.4 TGF-β1 induces growth arrest of several cell types, suggesting that activation of TGF-β1 signaling may induce cancer cells into dormancy and be beneficial at the early stages of cancer.1 However, TGF-β1, by activating the expression of both extracellular matrix components (collagen type I and fibronectin) and their cognate receptors, may also promote interactions between cancer cells and the microenvironment, favoring cancer progression toward the metastatic phase.1 The recognition of the pleiotropic functions of TGF-β1 has prompted the development of at least 21 pharmaceutical inhibitors (neutralizing antibodies, peptide antagonists, and small inhibitory molecules) of TGF-β1 signaling, some of which are in phase 1/2 trials for a variety of clinical applications.5
Primary myelofibrosis (PMF), the most severe of the Philadelphia-negative myeloproliferative neoplasms, is characterized by marrow fibrosis, failure of hematopoiesis in the bone marrow (BM), and development of hematopoiesis in spleen and other extramedullary sites.6 The disease is associated with unique abnormalities in megakaryocyte (MK) development, which include increased proliferation, retarded maturation, and pathological neutrophil peripolesis, which induces para-apoptosis.7 Early immunohistological observations indicated that MKs from the BM of 10 PMF patients expressed high levels of TGF-β1 receptor type I but normal levels of TGF-β1 and its type II receptor.8 Later studies consistently reported that sera, CD34pos cells, and MKs of PMF patients contain levels of total and bioactive TGF-β1 2-fold higher than normal.9,10 Whether such modest increases play a major role in the pathogenesis of PMF is debated.11 BM from animal models and PMF patients contain increased levels of tumor necrosis factor (TNF)α and other cytokines, suggesting that fibrosis may be the consequence of a proinflammatory microenvironment signature.12-15 In addition, the observations that BM from PMF patients express high levels of CXCL1216 (the chemokine that by binding to its cognate receptor CXCR4 retains normal hematopoietic stem cells in BM)17 and that an epigenomic mechanism suppresses CXCR4 expression in their stem cells18 have suggested that abnormalities in the CXCL12/CXCR4 axis may be responsible for abnormal stem cell trafficking and extramedullary hematopoiesis.
In mice, experimental manipulations that increase the levels of thrombopoietin (TPO), the MK-specific growth factor (TPOhigh mice), or reduce expression of the MK-specific transcription factor GATA1 (Gata1low mice) induce MK abnormalities similar to those found in PMF patients and result in myelofibrosis (MF).19 TPOhigh mice harbor a mutation similar to the genetic lesions found in most PMF patients20 and develop acute MF leading to death in 1-2 mo.21 The Gata1low mice harbor a hypomorphic mutation similar to the GATA1R216Q recently identified in 2 families with X-linked thrombocytopenia associated with PMF22 and develop chronic MF after >1 y.23 Experimental studies have established that TGF-β1 plays, through a mechanism still to be identified, a major role in the development of MF in TPOhigh mice. These mice express 8- to 20-fold more TGF-β1 in their plasma and BM than normal mice21,24 and are treatable by TGF-β1 ablation. TPOhigh stem cells do not transmit MF by transplantation if they lack the TGF-β1 gene21 or if recipient mice express a dominant-negative TGF-β1 receptor I.24 By contrast, the role of TGF-β1 in the pathogenesis of MF in Gata1low mice is not clear, because as PMF patients, they express normal levels of total TGF-β1 in plasma and 2-fold higher than normal in BM.25,26 In addition, like PMF patients, they express other abnormalities, such as increased VEGF and CXCL12 expression in BM and reduced CXCR4 expression in progenitor cells.16,25 The levels of proinflammatory cytokines expressed by this model are not known.
To clarify whether small increases in TGF-β1 expression may determine development of MF and to identify the underlying mechanism, the content of total and bioactive TGF-β1 in plasma, BM, and spleen of PMF patients and Gata1low mice was first compared and the proinflammatory cytokine profiles of BM and spleen of the animals determined. Next, the TGF-β1 signaling profiles of BM and spleen from Gata1low and wild-type littermates were compared. Finally, the TGF-β1–signaling alterations identified by profiling were validated by analyzing the effects of pharmacological inhibition of TGF-β1 on the phenotype of Gata1low mice. The BM and spleen of Gata1low mice did not express a proinflammatory cytokine signature. Although the levels of total and bioactive soluble TGF-β1 in PMF patients and Gata1low mice were confirmed to be modestly (0.5-to 2-fold) increased, the TGF-β1 content of MKs from the patients and animals was found increased by 5- to 10-fold. In addition, both BM and spleen of Gata1low mice expressed abnormal TGF-β1 signaling profiles. The abnormalities observed in the 2 organs were different and consistent with the phenotype induced by the mutation. Inhibition of TGF-β1 signaling rescued both the TGF-β1 signaling profile and the phenotype of Gata1low mice, reducing fibrosis/neovascularization/osteogenesis and increasing hematopoiesis in BM while reducing hematopoiesis in spleen. These results indicate that, in spite of modest increases of soluble TGF-β1, this growth factor plays a major role in determining both micro-environmental and hematopoietic abnormalities observed in Gata1low mice and provides a mechanism for the pathobiological role of this growth factor in patients with PMF.
Materials and methods
Human subjects
Spleen (n = 10), BM (n = 6), and plasma (n = 64) were collected from PMF patients diagnosed according to WHO criteria.27 JAK2V617F status is known for 58 patients. “Nondiseased” controls were spleen (n = 4) from males <30 y old who underwent a splenectomy following trauma, BM (n = 4) from adults >50 y old who underwent orthopedic surgery, and plasma from blood donors (n = 29). Samples were collected in accordance with the Declaration of Helsinki and guidelines established by the local ethical committees for human subject studies and made available as de-identified material through protocol MPD-RC/106 of the Myeloproliferative Disease-Research Consortium Tissue Bank.28
Mice
Wild-type and Gata1low littermates were generated as described.23 Gata1low mice were treated with SB431542 (cat no. S4317-5GM, Sigma-Aldrich, St Louis, MO), an inhibitor of the tyrosine kinase activity of TGF-β1 receptor type I.29 Two experiments were performed, one with 7- to 9-mo-old Gata1low mice and the second with 12-mo-old mice (12 mice/experiment) (supplemental Figure 1). Because data obtained in the 2 experiments were similar, only those obtained in the first experiment are presented. Mice were intraperitoneally injected with SB431542 (60 µg/kg per d) or vehicle (same volume) for 2 cycles of 5 consecutive days 2 d apart, rested for 1 mo, and then treated for 2 additional cycles. Treatment was well tolerated. No death was recorded over ∼2 mo in the vehicle- and SB431542-treated groups. SB431542 treatment induced statistically significant increases (∼10%) in body weight and luster of the coat (supplemental Figure 2) and markedly improved levels of physical activity. Experiments were performed under protocols approved by institutional animal care committees.
Quantitative RT-PCR analysis and TGF-β pathway profiling
RNA prepared in Trizol (Gibco BRL, Paisley, UK) was reverse transcribed with the Superscript Kit (Invitrogen, Milan, Italy). Reactions were performed in an ABI PRISM 7700 Sequence Detection System (Applied Biosystems, Carlsbad, CA). Cycle thresholds (Ct) were calculated with the SDS software and messenger RNA (mRNA) levels expressed in relative units using 2−ΔCt (ΔCt = target gene Ct − β-2 microglobulin Ct) values observed in the untreated Gata1low group as reference.30 TGF-β pathway profiles were obtained with the Mouse TGF-β RT2Profiler PCR array kit (SABiosciences, Frederick, MD) as described by the manufacturer. Differences in gene expression ≥2-fold between untreated or vehicle-treated or SB431542-treated Gata1low mice and wild-type controls were identified using the PCR Array Data Analyses Web portal (SABiosciences) and considered statistically significant with a P < .05 by a 2-tailed, Student t test. Biological consequences of gene expression alterations were predicted with the David Bioinformatic Database (David Bioinformatics Resources 6.7 NIAID/NIH). In selected cases, microarray analyses (GSE44795 and GSE44797) were validated by quantitative reverse-transcription polymerase chain reaction (RT-PCR).
Cytokine determinations
Hematological parameters
Blood (20-40 μL/sampling) was collected from the retro-orbital plexus into microcapillary tubes. Hematocrit (Hct), Plts, and white blood cell (WBC) counts were determined manually.
Flow cytometry and cell sorting
Cells were labeled with either phycoerythrin (PE)-conjugated anti-CD34 and allophycocyanin-conjugated anti-CD117 (cKit) (progenitor cells), PE-conjugated CD71/ fluorescein isothiocyanate-conjugated TER119 (erythroid cells), or PE-conjugated CD41/fluorescein isothiocyanate-conjugated CD61 (MK) (PharMingen, San Diego, CA). Cell fluorescence was analyzed with an ARIA cell sorter (Becton Dickinson, Franklin Lakes, NJ). Common erythroid/MK and common myeloid/granulocyte/monocyte progenitors, erythroid cells, and MKs were prospectively isolated as cKitpos/CD34neg, cKitpos/CD34pos, CD71posTER119pos, and CD41posCD61pos cells (>90% pure upon reanalysis).
CFC determinations
Colony-forming cells (CFCs) were determined by culturing purified progenitor cells (103 cells/mL) in methylcellulose assays, as previously described.30
Histology
Sections were stained with hematoxylin-eosin, Gomory-silver (MicroStain MicroKit, Diapath, Bologna, Italy), anti-CD34 (for vessel microdensity determinations, clone MEC14.7, CL8927AP, Cedarlane Laboratories, Burlington, NC), or anti-TGF-β1 (sc-146, Santa Cruz Biotechnology, Santa Cruz, CA) antibodies.26,31 Immunoreactions were detected with avidin-biotin immunoperoxidase (Vectastain Elite ABC Kit, Vector Laboratories, Burlingame, CA). Images acquired with the AXIOSKOPE microscope (ZEISS, Jena, Germany) equipped with a Coolsnap Videocamera were quantified with the MetaMorph 6.1 Software (Universal Imaging Corp, Downingtown, PA).32 Electron microscopy (EM) and immuno-EM observations were performed as described.33
Statistical methods
Comparisons were carried out using analyses of variance methods with Origin 3.5 software for Windows (Microcal Software Inc., Northampton, MA). To investigate differences in Hct, Ptl, and WBC between SB431542 (12 mice)- and vehicle (8 mice)-treated groups, the level of each parameter was determined at days 14/15/22/29/30/35/36/43/48/57/63/71 posttreatment (supplemental Figure 1). To investigate whether changes in the levels of each parameter over time differ between SB431542- and vehicle-treated groups, linear mixed-effects regression models were used, which incorporate treatment group and time as fixed effects with animal as a random effect. These models also take into account varying numbers of observations.34 These analyses were carried out using SAS V.9.2.
Results
Increased TGF-β1 content in MKs is the most prominent cytokine abnormality in both PMF patients and Gata1low mice
The plasma concentration of bioactive and total TGF-β1 of PMF patients was 2- to 3-fold greater than that observed in nondiseased controls (Table 1)10 . Plasma from homozygous JAK2V617F PMF patients contained 2 times more total TGF-β1 than that from PMF patients heterozygous or wild type for JAK2V617F. However, the plasma content of bioactive TGF-β1 was similar in all the patients. Similar results were observed in Gata1low mice. The increases in levels of bioactive (0.2-fold) and total (0.7-fold) TGF-β1 observed in the plasma of the animals were modest (Table 1).
Bioactive and total TGF-β1 content in the plasma of PMF patients and nondiseased controls and in that of wild-type and Gata1low mice
| Specimen | Bioactive TGF-β1, ng/mL* | Total TGF-β1, ng/mL |
|---|---|---|
| Human plasma | ||
| Nondiseased controls (n = 29) | 18 (0.05-144) | 52 (8-860) |
| PMF patients All (n = 64, 52 plus 6 of unknown JAK2V617F status) | 43 (4-218) | 153 (32-1000) |
| P = .014 | P = .005 | |
| JAK2V617F negative (n = 24) | 44 (8-136) | 130 (25-400) |
| JAK2V617F heterozygous (n = 20) | 44 (4-200) | 135 (30-500) |
| JAK2V617F homozygous (n = 14) | 26.2 (15-112) | 200 (100-1000) (P = .03 and .05 with respect to JAK2V617F heterozygous or negative) |
| Murine plasma | ||
| Wild type | 1.5 (0.01-8.2) (n = 12) | 10.5 (2.5-23) (n = 9) |
| Gata1low | 2.4 (0.01-8.2) P < .01 (n = 20) | 17.7 (8.5-39) P < .01 (n = 20) |
Values observed in PMF patients according to JAK2V617F state are also reported.
Values are expressed as median (min-max) determinations.
We previously reported that the levels of bioactive TGF-β1 in paired plasma and BM samples from PMF patients are similar, whereas those of total TGF-β1 are significantly higher in BM than in plasma.10 In this study, the amount of bioactive TGF-β1 was also significantly lower in BM from patients with PMF than in that of nondiseased controls, whereas the total levels of TGF-β1 in the 2 groups were comparable. Similar results were obtained in Gata1low mice. The levels of bioactive and total TGF-β1 in BM washes were either 2-fold lower or similar, respectively, to those detected in wild-type littermates: the median levels of bioactive and total TGF-β1 were 6 (2.4-18) vs 3.6 (2.2-11) (P < .005) and 99 (38-150) vs 45 (21-200) (P = .8) ng/mL in BM from wild-type and Gata1low littermates. The levels of bioactive and total TGF-β1 at 20% to 30% higher than normal were observed in spleen washes: the median levels of bioactive and total TGF-β1 were 8.2 (6.2-40) vs 8.4 (5.8-8.8) (P < .05) and 150 (56-600) vs 200 (120-300) (P < .05) ng/mL in spleen washes from wild-type and Gata1low mice, respectively.
BM sections from PMF patients contained 4 times more MKs than those from nondiseased donors and great numbers of MKs were also detectable in their spleen (151.2 ± 70.6/mm2 vs 2-3 MK detected in spleen from only 1 of 4 nondiseased controls analyzed) (Figure 1; Table 2).7,33,35 These MKs reacted 34 times more intensely than those from nondiseased BM with the TGF-β1 antibody (Figure 1A-B; Table 2). The MK content of Gata1low BM and spleen was also 2- to 3-fold higher than normal and these MKs reacted 2 to 8 times more intensely with the TGF-β1 antibody than normal MKs by immuno-optical and immuno-EM determinations (Figure 1A-C; Table 2).

The TGF-β1 content of MKs from PMF patients and Gata1low mice is similarly increased. (A-B) TGF-β1–specific immunohistochemistry of representative BM (A) and spleen (B) sections of one nondiseased donor and one PMF patient, untreated wild-type, or Gata1low mice, and Gata1low mice treated with either SB431245 or vehicle, as indicated. Arrows indicate representative MKs. Human MKs are on average twice as large as murine MKs. Original magnification ×20 (A) and ×40 (B). Quantifications of MK frequency and intensity of TGF-β1 immunostaining for the different groups are presented in Table 1. (C) TGF-β1 immunogold-staining of one representative MK (C1-4) from untreated wild-type and Gata1low mice and from Gata1low mice treated with either SB431245 or vehicle. The selected areas of the MK cytoplasm indicated by rectangles are shown at a higher magnification in C5-8. Arrowheads indicate TGF-β1–specific gold particles. The mean (±SD) number of immunogold-particles/14 μm2 of MK cytoplasm obtained in 5 replicate measurements is indicated below each panel. Values statistically different (P < .05) between untreated wild-type and Gata1low mice and vehicle- and SB431542-treated Gata1low mice are indicated by & and *, respectively. Magnification ×4400 in C1-4 and 30 000× in C5-8.
The TGF-β1 content of MKs from PMF patients and Gata1low mice is similarly increased. (A-B) TGF-β1–specific immunohistochemistry of representative BM (A) and spleen (B) sections of one nondiseased donor and one PMF patient, untreated wild-type, or Gata1low mice, and Gata1low mice treated with either SB431245 or vehicle, as indicated. Arrows indicate representative MKs. Human MKs are on average twice as large as murine MKs. Original magnification ×20 (A) and ×40 (B). Quantifications of MK frequency and intensity of TGF-β1 immunostaining for the different groups are presented in Table 1. (C) TGF-β1 immunogold-staining of one representative MK (C1-4) from untreated wild-type and Gata1low mice and from Gata1low mice treated with either SB431245 or vehicle. The selected areas of the MK cytoplasm indicated by rectangles are shown at a higher magnification in C5-8. Arrowheads indicate TGF-β1–specific gold particles. The mean (±SD) number of immunogold-particles/14 μm2 of MK cytoplasm obtained in 5 replicate measurements is indicated below each panel. Values statistically different (P < .05) between untreated wild-type and Gata1low mice and vehicle- and SB431542-treated Gata1low mice are indicated by & and *, respectively. Magnification ×4400 in C1-4 and 30 000× in C5-8.
Frequency and TGF-β1 immunostaining of MKs in the spleen of normal donors and PMF patients and wild-type and Gata1low mice
| BM | Spleen | |||
|---|---|---|---|---|
| Frequency MK/mm2 | TGF-β1 content/MK count difference, % | Frequency MK/mm2 | TGF-β1 content/MK count difference, % | |
| Normal donor | 98.0 ± 34.62 | 0.5 ± 0.1 | 2.7 ± 2.7 | 11.7 ± 2.7 |
| PMF patients | 435.8 ± 28.1* | 17.1 ± 2.4* | 151.2 ± 70.6* | 34.9 ± 2.1* |
| Wild-type mice | 320.0 ± 35.8 | 6.4 ± 1.2 | 93.3 ± 20.1 | 3.2 ± 0.3 |
| Gata1low mice untreated | 920.6 ± 136.8* | 20.2 ± 2.0* | 146.7 ± 20.1* | 24.4 ± 2.2* |
| Gata1low vehicle treated | 880.1 ± 110.3* | 18.9 ± 0.8 | 584.0 ± 60.1* | 24.3 ± 0.9* |
| Gata1lowSB431542 treated | 504.0 ± 29.9*† | 5.3 ± 1.1† | 296.0 ± 54.1*† | 9.2 ± 0.7† |
MK frequency was determined on 5 randomly chosen sections and TGF-β immunostaining by Methamorph analyses on 5-7 randomly chosen MKs per smear. MK frequencies and TGF-β immunostaining are presented as mean (±SD) of values observed in the BM from 6 PMF patients and 4 normal donors, the spleen from 10 PMF patients and 4 normal donors, and BM and spleen of 3-5 Gata1low animals per experimental group. Results statistically different between nondiseased and diseased samples (P < .01) or between SB431542- and vehicle-treated Gata1low mice (P < .05) are indicated by * and †, respectively.
Gata1low mice expressed levels of TGF-β1 and VEGF mRNA 2 to 3 times greater than normal in BM and spleen and levels of CXCL12 mRNA 6 times lower than normal in BM (Figure 2),16,26 suggesting that these organs may express a proinflammatory cytokine signature. To test this hypothesis, the content of 19 cytokines in BM and spleen washes of Gata1low and wild-type littermates was compared by cytokine array (Table 3). Of the 9 cytokines detectable with this assay, washes of Gata1low BM contained normal levels of IFNγ, IL-5, IL-12, and TNFα, significantly reduced levels of IL-2 (∼67%), IL-3 (∼80%), IL-9 (∼74%), and CXCL-1 (∼65), and nonsignificantly increased levels of regulated on activation normal T expressed and secreted (RANTES) (219 ± 49). Washes from Gata1low spleen contained normal levels of IFNγ, IL-2, IL-3, IL-9, and RANTES and significantly reduced levels of IL-5 (∼37%), IL-12 (∼81), and TNFα (∼62).

TGF-β, VEGF, and CXCL12 expression is increased in both BM and spleen from wild-type and Gata1low mice and inhibition of TGF-β signaling reduces expression of TGF-β but not that of VEGF or CXCL12. Expression levels were analyzed by quantitative RT-PCR analyses and are normalized to those detected in BM from untreated Gata1low mice. Results are presented as mean (±SD) of 3 independent determinations with 3 mice per experimental point. Values observed in untreated wild-type and Gata1low mice are presented as gray and pink boxes, respectively. Values statistically different (P < .05) between untreated wild-type and Gata1low mice and vehicle- and SB431542-treated Gata1low mice are indicated by & and *, respectively. Similar differences in TGF-β expression among the various groups were also detected by microarray profiling and are not included in Table 3, because they were <2-fold, the cutoff that defined differences in expression in this Table.
TGF-β, VEGF, and CXCL12 expression is increased in both BM and spleen from wild-type and Gata1low mice and inhibition of TGF-β signaling reduces expression of TGF-β but not that of VEGF or CXCL12. Expression levels were analyzed by quantitative RT-PCR analyses and are normalized to those detected in BM from untreated Gata1low mice. Results are presented as mean (±SD) of 3 independent determinations with 3 mice per experimental point. Values observed in untreated wild-type and Gata1low mice are presented as gray and pink boxes, respectively. Values statistically different (P < .05) between untreated wild-type and Gata1low mice and vehicle- and SB431542-treated Gata1low mice are indicated by & and *, respectively. Similar differences in TGF-β expression among the various groups were also detected by microarray profiling and are not included in Table 3, because they were <2-fold, the cutoff that defined differences in expression in this Table.
Comparison of the cytokine content of BM and spleen washes from 10-mo-old wild-type and Gata1low mice
| BM | Spleen | |
|---|---|---|
| IFNγ | 72 ± 15 | 68 ± 25 |
| IL- 2 | 67 ± 1 | 154 ± 36 |
| IL- 3 | 80 ± 1 | 82 ± 15 |
| IL- 5 | 85 ± 6 | 37 ± 12 |
| IL- 9 | 74 ± 8 | 88 ± 5 |
| IL- 12 | 109 ± 5 | 81 ± 2 |
| CXCL-1 | 65 ± 11 | 76 ± 7 |
| RANTES | 219 ± 49 | 98 ± 25 |
| TNFα | 75 ± 11 | 62 ± 11 |
| BM | Spleen | |
|---|---|---|
| IFNγ | 72 ± 15 | 68 ± 25 |
| IL- 2 | 67 ± 1 | 154 ± 36 |
| IL- 3 | 80 ± 1 | 82 ± 15 |
| IL- 5 | 85 ± 6 | 37 ± 12 |
| IL- 9 | 74 ± 8 | 88 ± 5 |
| IL- 12 | 109 ± 5 | 81 ± 2 |
| CXCL-1 | 65 ± 11 | 76 ± 7 |
| RANTES | 219 ± 49 | 98 ± 25 |
| TNFα | 75 ± 11 | 62 ± 11 |
The content of 19 cytokines [GM-CSF, IFNγ, IL-1α, IL-1β, IL-2, IL-3, IL-4, IL-5, IL-6, IL-9, IL-10, IL-12, IL-13, IL-17, CXCL1, MCP-1, M-CSF, RANTES, and TNFα] was determined. The concentrations of GM-CSF, IL-1α, IL-1β, IL-4, IL-6, IL-10, IL-13, IL-17, and M-CSF were below detection (<1 pg/50 μg total protein) in all the samples analyzed. The concentrations of the other cytokines were determined using 3 mice per experimental group and are presented as mean (±SD) percent of the total cytokine content per organ detected in wild-type animals. Bold fonts indicate Gata1low values significantly (P < .05) lower than those observed in wild-type mice
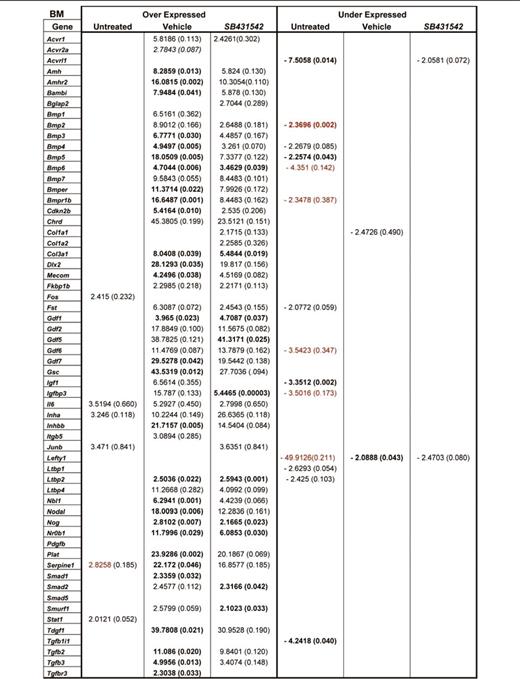
BM and spleen from Gata1low mice express distinctive alterations in TGF-β signaling profile
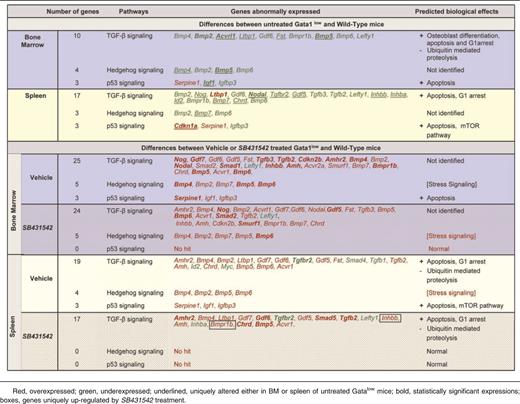
To clarify the consequences of altered TGF-β1 expression in MKs, the TGF-β pathway profiles of BM and spleen from wild-type and Gata1low mice were compared. Several genes of the TGF-β pathway were abnormally expressed in BM and spleen from Gata1low mice. In BM, the expression of 20 genes was altered, 6 were up-regulated by 2- to 3-fold, and 14 were down-regulated by 2- to 50-fold (Figure 3). Five of those genes, Bmp2, Bmp5, Acvrl1, Tgfblil, and Igf1, were down-regulated at levels significantly different from wild-type (Table 4). In spleen, the expression of 36 genes was altered, 7 were up-regulated by 2-to 3-fold, and 29 were down-regulated by 2- to 5-fold. Alterations were statistically significant for 4 genes: Cdkn1a and Ltbp1 overexpressed by 2-to 3-fold and Gdf2 and Nodal underexpressed by 3-to 5-fold. David-assisted pathway analyses of all abnormally expressed genes identified activation of TGF-β, Hedgehog, and p53 signaling pathway both in BM and spleen (Table 5). The biological consequences predicted by these abnormalities are consistent with the Gata1low phenotype. Alterations of TGF-β signaling predict increased levels of osteoblast differentiation in BM but not in spleen from Gata1low mice, increased apoptosis and G1 arrest both in BM and spleen but reduced ubiquitin-mediated proteolysis, a pathway indispensable for erythroid maturation,36 in BM only and activation of mammalian target of rapamycin (mTOR), a positive regulator of translation which improves erythropoiesis,37 in spleen (Table 5). These predictions are consistent with observations indicating that although Gata1low erythroblasts have increased apoptotic rates both in BM and spleen,25,38 progress in maturation occurs in spleen, which becomes the major erythroid site in these animals.30

Unique altered expression signatures characterize the TGF-β pathway profiles of BM and spleen of Gata1low mice. (A) Hierarchical clustering of normalized gene expression in BM and spleen from untreated wild-type and Gata1low mice and from Gata1low treated with either vehicle or SB431542, as indicated (each line a different mouse, 3 mice per experimental group). (B) Venn diagram depicting overlap of differentially expressed genes in BM and spleen of untreated Gata1low mice or in Gata1low mice treated with either vehicle or SB431542, as indicated. Only genes with ≥ 2-fold differences in expression levels were considered. For further details, see Table 3. (C) Quantitative RT-PCR determinations of the mRNA levels for Acvrl1, Bmp2, and Igf1 in BM and of Id2, Stat1, and Ltbp1 in spleen of untreated wild-type and Gata1low mice and of Gata1low mice treated with either vehicle or SB431542, as indicated. Results are normalized to those observed in wild-type mice and are presented as mean (±SD) of those observed, with 3 mice per experimental group. Values statistically different (P < .05) from those observed in wild-type or untreated Gata1low mice are indicated with * or &. Differences in gene expression among the 4 experimental groups are similar to those observed by microarray analyses.
Unique altered expression signatures characterize the TGF-β pathway profiles of BM and spleen of Gata1low mice. (A) Hierarchical clustering of normalized gene expression in BM and spleen from untreated wild-type and Gata1low mice and from Gata1low treated with either vehicle or SB431542, as indicated (each line a different mouse, 3 mice per experimental group). (B) Venn diagram depicting overlap of differentially expressed genes in BM and spleen of untreated Gata1low mice or in Gata1low mice treated with either vehicle or SB431542, as indicated. Only genes with ≥ 2-fold differences in expression levels were considered. For further details, see Table 3. (C) Quantitative RT-PCR determinations of the mRNA levels for Acvrl1, Bmp2, and Igf1 in BM and of Id2, Stat1, and Ltbp1 in spleen of untreated wild-type and Gata1low mice and of Gata1low mice treated with either vehicle or SB431542, as indicated. Results are normalized to those observed in wild-type mice and are presented as mean (±SD) of those observed, with 3 mice per experimental group. Values statistically different (P < .05) from those observed in wild-type or untreated Gata1low mice are indicated with * or &. Differences in gene expression among the 4 experimental groups are similar to those observed by microarray analyses.
Fold regulation and P values of genes differentially expressed between untreated or vehicle- or SB431542-treated Gata1low mice with respect to wild-type mice

David Bioinformatics Database-generated ranking and predicted biological effects of genes expressed with a 2-fold difference between BM and spleen from untreated or vehicle- or SB431542-treated Gata1low mice and the corresponding tissues from wild-type littermates
These alterations were validated by performing similar analysis on Gata1low mice treated with the TGF-β1 inhibitor SB431542 or vehicle, as control. SB431542 treatment significantly reduced by ∼20% TGF-β1 mRNA levels (Figure 2) and by 2-to 4-fold the intensity of TGF-β1 staining of MK both in BM and spleen (Figure 1A-C; Table 2). The effects on TGF-β1 expression were specific, because SB431542 treatment did not reduce VEGF or CXCL12 mRNA levels in either BM or spleen (Figure 2).
Both vehicle and SB431542 treatments altered the expression of numerous TGF-β pathway genes in BM and spleen of Gata1low mice (Figure 3; Table 4). In BM, the expression of 50 genes, 48 up-regulated by 2-to 50-fold and 2 down-regulated by 2-fold, was altered in vehicle-treated mice. In their SB431542-treated littermates, of the 48 genes expressed, 46 were up-regulated by 2-to 40-fold and 2 were down-regulated by 2-fold. Thirty-nine of the alterations occurred in both groups and were not detected in untreated animals. These common alterations included increased expression of BMP4, the gene that controls the stress pathway. In the cases of 3 genes (Acvrl1, Bmp2, and Igf1), alterations in expression were validated by quantitative RT-PCR (Figure 3C). Only 6 of the alterations that had been detected in untreated mice persisted after treatment. Four of them (Il6, Inha, Serpine1, Lefty) persisted in mice treated either with vehicle or SB431542 and 2 of them (Junb and Acvr2a) persisted only in SB431542-treated mice. No gene was identified with altered expression in vehicle-treated mice only (Figure 3B). David-assisted analyses identified that the abnormalities in the TGF-β and Hedgehog pathways persisted both in vehicle- and SB431542-treated mice but that p53 signaling was abnormal only in vehicle-treated mice, predicting that apoptosis would persist in vehicle- but not in SB431542-treated BM (Table 5).
In spleen, the expression of 49 genes, 38 up-regulated by 2- to 20-fold and 11 down-regulated by 2-to 5-fold, and of 43 genes, 37 up-regulated by 2- to 13-fold and 6 down-regulated by 2- to 5-fold, was altered in vehicle- and SB431542-treated animals, respectively (Figure 3; Table 5). The expression of 30 genes was altered by both treatments but was normal in the untreated mice. The treatments affected the expression of 11 genes, which were expressed at altered levels also in untreated Gata1low mice. Five of these genes (FKbp1, Ltbp1, Serpine1, Cd79a, and Tgfbr2) remained expressed at altered levels in both groups of mice; 4 of them (Gdf3, Inhba, Lefty, and Tgfb3) were expressed at normal levels in vehicle-treated mice only and 2 genes (Id2 and Stat1) were expressed at normal levels in the SB431542-treated mice only. Data on Id2 and Stat1 expression were validated by quantitative RT-PCR (Figure 3C). David-assisted pathway analyses identified alterations in TGF-β signaling consistent with increased apoptosis and G1 arrest and reduced ubiquitin-mediated proteolysis both in vehicle- and SB431542-treated mice, but the Hedgehog and p53 pathways were normal in SB431542-treated mice (Table 5).
These results predict that inhibition of TGF-β1 signaling by SB431542 treatment had activated hematopoiesis in BM while reducing hematopoiesis in spleen of Gata1low mice.
Inhibition of TGF-β1 signaling rescued both microenvironment and hematopoietic abnormalities in BM
The effects of inhibition of TGF-β1 signaling in BM of Gata1low were evaluated by morphological and functional studies (Figures 4 and 5).

Inhibition of TGF-β1 signaling reduces fibrosis, neo-angiogenesis, and osteogenesis in the BM of Gata1low mice. (A) Morphological appearance of a femur (original magnification ×1.5), (B) BM cellularity, and representative (C-D) reticulinic fiber determinations by Gomori-Silver and (E,F) microvessel density determinations by CD34 staining of femur sections from vehicle- and SB431542-treated Gata1low mice. Original magnification ×20. Quantification with the Methamorph program of the Gomori-Silver and CD34 staining are presented as mean (±SD) of results obtained with 3 mice per experimental point in D and F. Results are compared with those observed in untreated Gata1low and wild-type littermates (pink and gray horizontal bars). Values statistically different (P < .05) between untreated wild-type and Gata1low mice and vehicle- and SB431542-treated Gata1low mice are indicated by & and *, respectively. (G) Hematoxylin-eosin staining of femur/tibias from untreated wild-type and Gata1low mice or from Gata1low mice treated with either SB431542 or vehicle, as indicated. Representative areas of medulla entrapped within the bone are presented at larger magnification on the right. Blue arrowheads indicate bone trabeculae protruding within the medulla. Red arrowheads indicate MKs embedded in areas of medulla surrounded by the bones. Magnification ×4 and ×20, as indicated.
Inhibition of TGF-β1 signaling reduces fibrosis, neo-angiogenesis, and osteogenesis in the BM of Gata1low mice. (A) Morphological appearance of a femur (original magnification ×1.5), (B) BM cellularity, and representative (C-D) reticulinic fiber determinations by Gomori-Silver and (E,F) microvessel density determinations by CD34 staining of femur sections from vehicle- and SB431542-treated Gata1low mice. Original magnification ×20. Quantification with the Methamorph program of the Gomori-Silver and CD34 staining are presented as mean (±SD) of results obtained with 3 mice per experimental point in D and F. Results are compared with those observed in untreated Gata1low and wild-type littermates (pink and gray horizontal bars). Values statistically different (P < .05) between untreated wild-type and Gata1low mice and vehicle- and SB431542-treated Gata1low mice are indicated by & and *, respectively. (G) Hematoxylin-eosin staining of femur/tibias from untreated wild-type and Gata1low mice or from Gata1low mice treated with either SB431542 or vehicle, as indicated. Representative areas of medulla entrapped within the bone are presented at larger magnification on the right. Blue arrowheads indicate bone trabeculae protruding within the medulla. Red arrowheads indicate MKs embedded in areas of medulla surrounded by the bones. Magnification ×4 and ×20, as indicated.

Inhibition of TGF-β1 signaling normalizes the number and expression profile of progenitor cells, erythroid cells, and MKs in BM of Gata1low mice. (A) Frequency by flow cytometry for CD34/CD117 expression, (B), total numbers, and (C) expression profiling of Common erythroid/MK and common erythroid/MK and common myeloid/granulocyte/monocyte progenitors from BM of vehicle- and SB431542-treated Gata1low mice. Results are compared with those observed with untreated Gata1low and wild-type littermates (pink and gray horizontal bars). B (right) presents the total number of progenitor cells calculated on the basis of CFC evaluations. (D) Frequency by flow cytometry for Ter119/CD71 expression, (E) total numbers, and (F) expression profiling of erythroid cells from BM of vehicle- and SB431542-treated Gata1low mice. (G) Frequency by flow cytometry for CD61/CD41 expression, (H) total cell number, (I) representative morphology by EM of MKs from BM of vehicle- and SB431542-treated Gata1low mice, and (J) expression profiling. I, Magnification ×4400; Neu indicates a neutrophil. Total cell numbers were calculated by multiplying the mean frequencies presented in Table 6 per the total number of BM cells in the 3 animals analyzed in this experiment. Quantitative results are presented as mean (±SD) of at least 3 independent determinations with 3 mice per experimental point and are compared with those observed with the corresponding populations purified from untreated Gata1low and wild-type animals (pink and gray horizontal bars). Values statistically different (P < .01) between untreated Gata1low and wild-type animals and between vehicle- and SB431542-treated Gata1low mice are indicated by & and *, respectively.
Inhibition of TGF-β1 signaling normalizes the number and expression profile of progenitor cells, erythroid cells, and MKs in BM of Gata1low mice. (A) Frequency by flow cytometry for CD34/CD117 expression, (B), total numbers, and (C) expression profiling of Common erythroid/MK and common erythroid/MK and common myeloid/granulocyte/monocyte progenitors from BM of vehicle- and SB431542-treated Gata1low mice. Results are compared with those observed with untreated Gata1low and wild-type littermates (pink and gray horizontal bars). B (right) presents the total number of progenitor cells calculated on the basis of CFC evaluations. (D) Frequency by flow cytometry for Ter119/CD71 expression, (E) total numbers, and (F) expression profiling of erythroid cells from BM of vehicle- and SB431542-treated Gata1low mice. (G) Frequency by flow cytometry for CD61/CD41 expression, (H) total cell number, (I) representative morphology by EM of MKs from BM of vehicle- and SB431542-treated Gata1low mice, and (J) expression profiling. I, Magnification ×4400; Neu indicates a neutrophil. Total cell numbers were calculated by multiplying the mean frequencies presented in Table 6 per the total number of BM cells in the 3 animals analyzed in this experiment. Quantitative results are presented as mean (±SD) of at least 3 independent determinations with 3 mice per experimental point and are compared with those observed with the corresponding populations purified from untreated Gata1low and wild-type animals (pink and gray horizontal bars). Values statistically different (P < .01) between untreated Gata1low and wild-type animals and between vehicle- and SB431542-treated Gata1low mice are indicated by & and *, respectively.
Femurs from untreated and vehicle-treated Gata1low mice were pale, a sign of poor erythropoiesis, with a 50% reduction in cell content (Figure 4A-B). The femur from SB431542-treated mice was reddish and had normal cell content. In addition, SB431542 treatment reduced fibrosis (Figure 4C-D) and vessel microdensity (both by 1-log) (Figure 4E-F). Bone trabeculae were barely detectable in the medulla of SB431542-treated Gata1low mice, whereas these structures were common in the medulla of untreated or vehicle-treated Gata1low mice (Figure 4G). In addition, the bone from untreated and vehicle-treated Gata1low mice contained numerous hematopoietic lacunae, which included several MKs, whereas hematopoietic lacunae were rare and deprived of MKs in the bone from wild-type and SB431542-treated Gata1low mice.
The frequency of hematopoietic progenitor cells in BM was determined both as CD117pos cells and as CFC and was found to be similar in vehicle- and SB431542-treated mice (Figure 5A; Table 6). However, due to increased BM cellularity (Figure 4B), the total number of progenitor cells in BM increased by 5-fold after SB431542 treatment (Figure 5B). Progenitor cells from BM of Gata1low mice express an altered profile characterized by reduced expression of Gata1 and the cell cycle regulator p27kip (Figure 5C)30,39 . SB431542 treatment, but not vehicle treatment, normalized the levels of both Gata1 and p27kip1 mRNA expressed by these cells.
Frequency of progenitor cells, erythroid cells, and MK precursors in the BM and spleen of vehicle- and SB431542-treated Gata1low mice
| Wild type | Gata1low | |||
|---|---|---|---|---|
| Untreated | Vehicle treated | SB431542 treated | ||
| CD117pos | ||||
| BM | 9.8 ± 3.5 | 3.5 ± 1.2* | 6.5 ± 1.9 | 7.8 ± 1.1† |
| Spleen | 0.2 ± 0.5 | 4.6 ± 2.1* | 6.6 ± 2.1 | 11.5 ± 2.1† |
| CD71pos/Ter119pos, % | ||||
| BM | 19.3 ± 8.1 | 13.9 ± 4.3 | 14.7 ± 1.6 | 26.7 ± 2.8† |
| Spleen | 8.5 ± 2.9 | 14.2 ± 5.5* | 12.7 ± 3.6 | 13.2 ± 2.3 |
| CD41pos/CD61neg, % | ||||
| BM | 9.9 ± 5.8 | 30.5 ± 8.7* | 30.9 ± 3.1 | 28.8 ± 4.6 |
| Spleen | 12.8 ± 5.7 | 23.7 ± 3.1* | b.d.‡ | b.d.‡ |
| CD41pos/CD61pos, % | ||||
| BM | 3.8 ± 1.0 | 8.1 ± 2.5* | 14.5 ± 4.7 | 10.6 ± 3.4 |
| Spleen | 2.3 ± 1.1 | 19.4 ± 2.3* | 16.7 ± 3.4 | 10.7 ± 3.0‡ |
Data are presented as mean (±SD) of 3-6 determinations per experimental point. MK precursors were defined as CD41pos cells and divided into immature (CD61neg) and mature (CD61pos) MKs. *, †, and ‡, P < 0.05 between untreated Gata1low and wild-type mice, SB431542- and vehicle-treated Gata1low mice, or treated and untreated Gata1low mice, respectively. The cloning efficiency of CD117pos cells prospectively isolated from vehicle- and SB431542-treated animals was 55 ± 12 vs 44 ± 5 CFC/103 plated cells, respectively.
b.d., below detection.
SB431542 treatment significantly increased by 2-to 3-fold both the frequency and total number of erythroblasts (Ter119posCD71pos cells) present in BM (Figure 5D-E; Table 6). In addition, it normalized the expression profile of these cells by increasing by 10- to 100-fold Gata1 and α- and β-globin expression and reducing Gata2 expression by 10-fold. The expression profile of vehicle-treated erythroblasts remained similar to that of untreated Gata1low mice (Figure 5F).
Using flow cytometry, the frequency of MK precursors was determined using CD41 and CD61. CD41 is expressed by immature MK precursors, including cells that cannot be recognized by morphology. CD61 is expressed by mature MK. SB431542 treatment did not reduce the frequency of MKs in BM, which remained greater than normal. The total frequency of MK precursors was 31% for CD41pos/CD61neg and 15% for CD41pos/CD61pos = ∼46% vs 29% for CD41pos/CD61neg and 11% for CD41pos/CD61pos = ∼31% in vehicle- and SB431542-treated mice vs 31% for CD41pos/CD61neg and 8% for CD41pos/CD61pos = ∼39% in BM of untreated mice (Table 6) and increased by 2-fold the total MK number (Figure 5H). SB431542 treatment, however, significantly reduced by 2-fold the frequency of MKs recognized by microscopic evaluation in BM sections (Table 2). To clarify the effects of the treatment on MK maturation, EM evaluations were performed (Figure 5J). These observations indicated that MKs from SB431542-treated Gata1low mice had a mature morphology with well-organized Plt territories, the region of the MK cytoplasm that generates the Plts, whereas Plt territories were barely detectable in MKs from vehicle-treated animals. In addition, the frequency of MK embedded with neutrophils was 0.5 ± 0.01 vs 1 ± 0.04/field (P < .05) in SB431542- and vehicle-treated mice, indicating that SB431542 treatment had reduced by 2-fold the pathological emperipolesis occurring between neutrophils and MKs. SB431542 treatment also reduced MK death by 4-fold, because the frequency of para-apoptotic MKs was 3.9 ± 4.4 vs 31.2 ± 12.5% (P < 10−5) in SB431542- and vehicle-treated mice, respectively. These observations indicate that SB431542 treatment increases the maturation profile of MK in BM of Gata1low mice. In agreement with this hypothesis, SB431542 treatment restored the expression profile of MKs by increasing Gata1, Acetyl cholinesterase, and von Willebrand factor expression by 10-fold and reducing by 50% the expression of Plt factor 4 and of P-Selectin, the receptor that triggers the process of pathological neutrophil emperipolesis7 (Figure 5I).
Inhibition of TGF-β1 signaling reduces hematopoiesis in spleen
Morphological and functional studies were also performed to evaluate the effects of inhibition of TGF-β1 signaling on hematopoiesis in spleen of Gata1low mice (Figure 6).

Inhibition of TGF-β1 signaling reduces splenomegaly in Gata1low mice. (A) Morphological appearance (original magnification ×1.5), (B) weight, and (C) total cell number of a representative spleen from vehicle- and SB431542-treated Gata1low mice, as indicated. (D) Frequency by flow cytometry for CD117/CD34 expression and total number of progenitor cells, (E) frequency by flow cytometry for Ter119/CD71 expression and total number of erythroid cells, and (F) frequency by flow cytometry for CD61/CD41 expression and total number of MKs in the spleen from vehicle- and SB431542-treated Gata1low mice are also presented. Results are compared with those observed in untreated Gata1low and wild-type animals (pink and gray horizontal bars). Total numbers of progenitor cells, erythroid cells, and MKs are calculated by multiplying the frequency of the different populations obtained by FACS (Table 6) per the total number of cells in the organs of the animals analyzed in these experiments and are presented as mean (±SD) of 5-6 independent determinations per experimental point. Values statistically different (P < .05) between untreated wild-type and Gata1low mice and vehicle- and SB431542-treated Gata1low mice are indicated by & and *, respectively.
Inhibition of TGF-β1 signaling reduces splenomegaly in Gata1low mice. (A) Morphological appearance (original magnification ×1.5), (B) weight, and (C) total cell number of a representative spleen from vehicle- and SB431542-treated Gata1low mice, as indicated. (D) Frequency by flow cytometry for CD117/CD34 expression and total number of progenitor cells, (E) frequency by flow cytometry for Ter119/CD71 expression and total number of erythroid cells, and (F) frequency by flow cytometry for CD61/CD41 expression and total number of MKs in the spleen from vehicle- and SB431542-treated Gata1low mice are also presented. Results are compared with those observed in untreated Gata1low and wild-type animals (pink and gray horizontal bars). Total numbers of progenitor cells, erythroid cells, and MKs are calculated by multiplying the frequency of the different populations obtained by FACS (Table 6) per the total number of cells in the organs of the animals analyzed in these experiments and are presented as mean (±SD) of 5-6 independent determinations per experimental point. Values statistically different (P < .05) between untreated wild-type and Gata1low mice and vehicle- and SB431542-treated Gata1low mice are indicated by & and *, respectively.
SB431542 treatment reduced the size by 2.5-fold and the total cell number by 1.5-fold of the spleen (Figure 6A-C). It did not decrease the frequency and total number of hematopoietic progenitor cells or decrease the frequency of erythroblasts (Ter119posCD71pos cells) or the frequency of MK (CD41pos/CD61pos cells). Calculations of total numbers indicated that the treatment significantly reduced both erythroid cells and MKs in spleen (Figure 6; Table 5). MK precursors (CD41pos/C61pos) were barely detectable in spleen from both SB431542- and vehicle-treated mice (Table 6).
Inhibition of TGF-β1 signaling increases Ptl counts and decreases WBC and poikilocytes but does not decrease Hct in blood
To assess whether reduced hematopoiesis in spleen induced by SB431542 treatment resulted in anemia, blood cell counts were evaluated.
Hct levels did not significantly decrease with time in either the SB431542- or vehicle-treated group (P = .327). Although Hct levels in the SB431542-treated group were significantly lower than in the vehicle-treated group (P = .006), this reduction is only ∼6% of the Hct level of the vehicle-treated group (Figure 7A).

Inhibition of TGF-β1 signaling increases Ptl numbers and reduces WBC counts and frequency of poikilocytes but does not affect Hct levels in blood of Gata1low mice. Hct (A), Ptl numbers (B), and WBC counts (C) of Gata1low mice during treatment with SB431542 (red, 12 mice) or vehicle (black, 8 mice), as indicated. The vertical lines indicate the time of the treatment (see also supplemental Figure 1). The results are compared with those of untreated age- and sex-matched wild-type (gray box) and Gata1low (pink box) controls (10 mice each). Results are presented as mean (±SD) of independent measurements and analyzed with the mixed effects regression models using Restricted Maximum Likelihood Method, as summarized in the corresponding tables, on the right. (D) May-Grunwald staining of blood smears from representative untreated wild-type and Gata1low mice and Gata1low mice from vehicle- or SB431542-treated Gata1low mice. Representative poikilocytes are indicated by arrows. Original magnification ×40.
Inhibition of TGF-β1 signaling increases Ptl numbers and reduces WBC counts and frequency of poikilocytes but does not affect Hct levels in blood of Gata1low mice. Hct (A), Ptl numbers (B), and WBC counts (C) of Gata1low mice during treatment with SB431542 (red, 12 mice) or vehicle (black, 8 mice), as indicated. The vertical lines indicate the time of the treatment (see also supplemental Figure 1). The results are compared with those of untreated age- and sex-matched wild-type (gray box) and Gata1low (pink box) controls (10 mice each). Results are presented as mean (±SD) of independent measurements and analyzed with the mixed effects regression models using Restricted Maximum Likelihood Method, as summarized in the corresponding tables, on the right. (D) May-Grunwald staining of blood smears from representative untreated wild-type and Gata1low mice and Gata1low mice from vehicle- or SB431542-treated Gata1low mice. Representative poikilocytes are indicated by arrows. Original magnification ×40.
Ptl levels significantly increased by .0009 per day for both groups of animals (P = .032). Furthermore, Ptl levels in the SB431542-treated group were significantly greater by .13 than those in the vehicle-treated group (P ≤ .0001) (Figure 7B).
WBC levels did not significantly increase with time for either group (P = 0.463). However, WBC levels in the SB431542-treated group were significantly lower by 1436 than those in the vehicle-treated group (P ≤ .0001) (Figure 7C)
Poikilocytes, red blood cells that acquire a deformed morphology when passing through a fibrotic mesh, were commonly observed on peripheral smears of vehicle-treated Gata1low mice but were rare on smears from SB431542-treated animals (11 vs <4 poikilocytes/200 red blood cells, respectively) (Figure 7D).
Discussion
Solid evidence indicates that TGF-β1 is responsible for MF in TPOhigh animals.21,24 However, the downstream signaling abnormalities that mediate this effect have not been identified. The role of TGF-β1 in the pathogenesis of PMF in humans is still to be established because of the modest 2- to 3-fold increases of soluble TGF-β1 observed, lack of information on alterations in signaling downstream of TGF-β1, and the recent identification of prominent alterations in other proinflammatory cytokines, such as TNFα.
The aim of this study was to clarify whether modest increases of soluble TGF-β1 similar to those observed in patients may be responsible for MF in animal models and to identify the mechanism(s) underlying such induction. We used the Gata1low animal model of MF, because these animals express 2-to 3-fold increases in total TGF-β1 protein and develop MF over a long period of time, allowing detailed analysis of mechanisms that may determine insurgency of the disease.
Levels of total and bioactive TGF-β1 in plasma and BM and spleen washes of PMF patients and Gata1low mice were compared. These experiments identified that the soluble content of bioactive TGF-β1 was only 2-to 3-fold higher than normal in both cases. However, these experiments identified that the TGF-β1 content of MKs of BM and spleen from both PMF patients and Gata1low mice is 5- to 10-fold higher than normal. These preliminary experiments also excluded a role for proinflammatory cytokines in the development of MF in Gata1low mice, because the BM and spleen from these animals contained normal levels of TNFα and other flammatory cytokines and treatments with the anti-inflammatory drug dexamethasone did not alter their MF phenotype (not shown). Therefore, increased TGF-β1 content in MK from BM and spleen is a major abnormality of both PMF patients and Gata1low mice.
To evaluate whether increased TGF-β1 content had altered the activation state of the TGF-β1 signaling in BM and spleen of Gata1low mice, the TGF-β1 signaling profiles of these organs were determined. These experiments identified that BM and spleen from Gata1low mice express 2 different altered expression signatures involving 20-35 genes of the TGF-β1 signaling pathway with important hematopoietic functions. In BM, there was significant down-regulation of Bmp2, Bmp5, Acvrl1, and Igf1, whereas in spleen, there was significant overexpression of Cdkn1a and Ltbp1 and underexpression of Gdf2 and Nodal. David-assisted pathway analyses of the 2 altered expression signatures identified activation of signaling pathways that promote apoptosis both in BM and spleen. However, activation of pathways promoting osteoblast differentiation and suppression of those promoting ubiquitin-mediated proteolyses were observed in BM but not in spleen and activation of mTOR signaling only in spleen. Based on these expression signatures, the David program predicted osteopetrosis and hematopoietic failure in BM and activation of hematopoiesis in spleen, which is exactly the phenotype expressed by Gata1low mice.
The physiological relevance of these expression signatures was validated by comparing the effects of pharmacological inhibition of TGF-β1 on the activation status of its signaling pathway and on the phenotype of Gata1low mice.
Vehicle treatment induced a “storm” of gene expression alterations, including increases of TGF-β1 and VEGF mRNA in spleen and reduced the frequency of mature MK in BM and spleen. However, it did not normalize the TGF-β1 expression signatures or the phenotype of Gata1low mice. Treated mice were subjected to repeated <40-μL bleedings. To clarify whether bleeding was responsible for alterations observed in vehicle-treated mice, levels of TGF-β1, VEGF, and CXCR4 mRNA and frequency of MKs in the BM and spleen from bled Gata1low mice were determined (supplemental Figure 3). Bleeding alone induced effects similar to those observed in vehicle-treated animals. It increased by 2.5-fold the expression of TGF-β1 and VEGF mRNA in spleen but not in BM and reduced the frequency of mature MKs both in BM and spleen by 2-fold.
Normalization of the TGF-β1 expression signatures occurred only in SB431542-treated animals. In BM, David-assisted pathway analyses identified that genes involved in osteoblast proliferation and apoptosis were no longer activated in this experimental group, predicting a reduction of osteogenesis, and possibly other MF traits, and activation of hematopoiesis. In agreement with this prediction, SB431542 treatment increased the total cell count by 2-fold and decreased the presence of bone trabeculae in the medulla. It also decreased both fibrosis and vessel microdensity by >10-fold and increased by 5-fold the total number, but not frequency, of progenitor cells and the frequency and total number of erythroblasts by 2- to 5-fold. Reduction of vessel micro-density was not associated with reduced VEGF expression. However, the number of myofibroblasts, a cell population that plays a pivotal role in the vascularization of solid tumors, was greatly reduced by SB431542 treatment (M. Zingariello, F. Martelli, L. Sancillo, R.A. Rana, and A.R. Migliaccio, manuscript in preparation). It did not reduce the frequency or total number of MKs detected by flow cytometry but reduced the number of MKs detected by morphological analyses and improved the maturation of the MKs that displayed well-developed Plts territories and reduced levels of neutrophil emperipolesis and para-apoptosis. It also normalized Gata1 and p21Kip1 expression in progenitor cells and expression profiles of erythroblasts and MK.
In spleen, SB431542 treatment restored expression of Id2 and Stat1. In addition, David-assisted analyses identified that SB431542 treatment had reduced ubiquitin-mediated proteolysis and mTOR activation without affecting the apoptosis pathway that remained activated. This profile predicted that SB431542 treatment would reduce hematopoiesis in spleen. In agreement with this prediction, SB431542 treatment reduced by 2.5-fold the weight and by 2-fold the total cell number and total numbers of progenitor cells, erythroblasts, and MKs in spleen. Thus, normalization of the altered TGF-β1 expression signatures by SB431542 treatment was associated with gain of hematopoietic functions in BM and reduction of hematopoiesis in spleen.
These TGF-β1 expression signatures provide insights on the elements downstream to TGF-β1 that may induce MF in Gata1low mice and have implications for clinical results recently reported for PMF patients. In the case of BM, alteration patterns rather than single genes are likely to mediate suppression of hematopoiesis. This concept is exemplified by Smad1 and Smad2 activations, which were not detected in untreated Gata1low mice, were both activated in vehicle treatment mice, but only Smad2 was activated in SB431542-treated mice. Gain-/loss-of-function studies have indicated that TGF-β1 may either suppress or activate hematopoiesis, depending on the type of Smad signaling activated by its downstream partner TIF1γ40. TIF1γ activation of Smad4 induces an antiproliferative response, whereas activation of Smad2/3 induces proliferation. Activation of Smad2 in the absence of Smad4 observed in the BM of SB431542-treated mice is consistent with the improved hematopoiesis observed in this organ.
Reduced Gata1 expression in MKs is observed in Gata1low mice, TPOhigh mice, and PMF patients and is consistently associated with loss of hematopoietic functions in BM.26,41 The hypomorphic mutation itself is responsible for reducing Gata1 expression in Gata1low mice, but the mechanism for reduced Gata1 expression in TPOhigh mice and PMF patients is unknown. In Drosophila, the decapentaplegic gene (Dpp), the equivalent of TGF-β1, inhibits the maturation of crystal cells, the blood cells corresponding to mammalian MKs by suppressing the expression of Serpent, the GATA transcription factor in flies.42,43 The conserved nature of the biological functions of the TGF-β family1 suggests that TGF-β1 may also suppress Gata1 expression in mammalian MKs. In support of this hypothesis, SB431542 treatment, but not vehicle treatment, restored Gata1 expression in hematopoietic cells, including MKs, from BM of Gata1low mice. However, whether the TGF-β1 signaling suppresses Gata1 expression in mammalian cells remains to be investigated.
In spleen, 2 genes, Id2 and Stat1, were expressed at normal levels and the mTOR pathway was no longer activated only in SB431542-treated mice, suggesting that mTOR, Stat1, and Id2 may be responsible for activation of hematopoiesis in spleen. The role of mTOR in activation of hematopoiesis in extramedullary sites is also supported by clinical studies reporting reduction in spleen size as the major clinical effect induced by pharmacological inhibition of mTOR in PMF patients.44 The possible role of Stat1 in the development of extramedullary hematopoiesis is also supported by clinical data. The discovery that 50% of PMF patients express the JAK2V617 mutation led to the development of JAK1/2 inhibitors and clinical trials with these drugs are underway.7,45 These trials have consistently described rapid reductions of spleen size and decrease in debilitating systemic symptoms. However, these treatments do not reduce the JAK2V617F allele burden, suggesting that JAK1/2 inhibitors may not target the mutated PMF clone.45 In addition to JAK2V617F, JAK1/2 inhibitors inhibit numerous wild-type proteins, including Stat1. Our results suggest that inhibition of Stat1 may be responsible for reducing spleen size in PMF patients treated with these inhibitors.
The mechanism(s) leading to suppression of hematopoiesis in BM and development of extramedullary hematopoiesis in PMF has not been elucidated as yet. Until recently, the consensus was that fibrosis was passively responsible for both traits by establishing space constrain that induces stem cells to leave BM to colonize extramedullary sites. However, it was recently recognized that fibrosis alone cannot be responsible for these PMF traits.46 In fact, fibrosis associated with BM irradiation does not induce extramedullary hematopoiesis47 and PMF patients are cured by transplantation in spite of BM fibrosis.48 Gata1 is localized on the X chromosome.49 Due to the lionization process, heterozygous females are a mosaic of 2 stem cell populations, one expressing the normal and the other one expressing the Gata1low allele, at a 50:50 ratio. Heterozygous females contain wild-type stem cells but develop MF with traits identical to those developed by hemizygous males.23 Splenectomy, however, prevents development of MF in heterozygous females, suggesting that spleen provides a supportive microenvironment for Gata1low stem cells.30 This concept was recently validated by the observation that the spleen of PMF patients is uniquely enriched for PMF stem cells.50 The great numbers of PMF stem cells observed in the spleen of the patients and the different TGF-β1 alteration signatures of BM and spleen described here suggest a model for the development of MF, according to which TGF-β1 released by the MK progeny of MF stem cells induce different TGF-β1 expression signatures in BM and spleen, which suppress normal hematopoiesis in BM and activate MF hematopoiesis in spleen (supplemental Figure 4). This model predicts that, in spite of the encouraging results obtained with JAK2 inhibitors in PMF, the disease will be better controlled by therapies combining JAK2 inhibitors with drugs, still to be identified, and that may reactivate normal hematopoiesis in BM. We suggest that these drugs may be represented by compounds that normalize all (TGF-β1 inhibitors) or part (such as Smad signaling modulators) of the TGF-β1 expression signature of Gata1low BM.
The online version of this article contains a data supplement.
The publication costs of this article were defrayed in part by page charge payment. Therefore, and solely to indicate this fact, this article is hereby marked “advertisement” in accordance with 18 USC section 1734.
Acknowledgments
The authors thank Antonio Di Virgilio and Agostino Eusebi for performing animal manipulations, Maria Verrucci for quantitative RT-PCR analyses, and Jolanda Mernacej for proof-reading the manuscript.
This work was supported by the National Cancer Institute (grant no. P01-CA108671), the Italian Ministry of Education (grant no. FIRB2010 accordi di programma), and Associazione Italiana Ricerca sul Cancro.
Authorship
Contribution: M.Z., F. Martelli, F.C., F. Masiello, B.G., M.M., and L.S. performed experiments and analyzed data; E.D. assured compliance of the animal protocols with good veterinary practice and supervised the well-being of the mouse colony; G.B. provided samples from PMF patients and normal donors and assured compliance of the study with institutional IRB; X.L. and J.D.G. performed the longitudinal analysis of the mice experiments; and R.A.R. and A.R.M. designed research, analyzed the data, and wrote the manuscript. All the authors have read the manuscript, concur with its content, and state that its content has not been submitted elsewhere.
Conflict of interest disclosure: The authors declare no competing financial interests.
Correspondence: Anna Rita Migliaccio, Department of Medicine, Mount Sinai School of Medicine, One Gustave L Levy Place, Box #1079, New York, NY 10029; e-mail: annarita.migliaccio@mssm.edu.
