To the editor:
We read with interest the report from Hong et al1 on the incremental prognostic value of gene expression signatures in diffuse large B-cell lymphoma (DLBCL). We were surprised by the conclusions that these “signatures are inferior to clinical factors and provide little added value in risk assessment” when considering a 2-gene score (TGS) and a 6-gene score described by us2-4 and others.5 The authors’ claim that “all studies assess predictive significance based on P value from multivariable Cox regression” was also surprising, because dedicated parts of prior studies specifically addressed added prognostic value. We reported robust risk reclassification by integration of molecular indices (TGS) with clinical factors within the international prognostic index (IPI) (TGS-IPI),2 and both our study and the study of Lenz et al5 demonstrated splitting of IPI strata using molecular signatures.
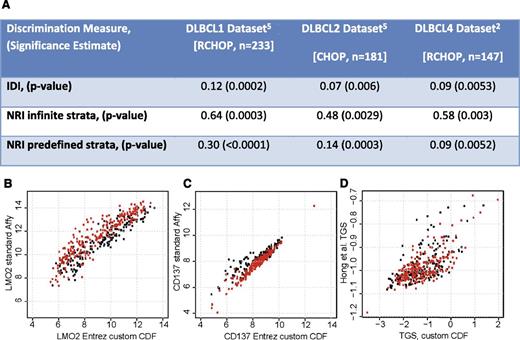
We favored risk reclassification as a measure of added value from molecular indices over more complex statistical tests for several reasons (pie charts in figure 4B of Alizadeh et al2 ). First, even statistically significant biomarkers may yield minimal improvement in the area under the curve.6,7 Therefore, many statisticians consider C-statistics unsuitable for assessing improvement in prediction, preferring the use of measures such as net reclassification improvement and integrated discrimination improvement (IDI).7-10 Second, C-statistics and IDI lack an intuitive interpretation for clinicians. However, most surprisingly, we came to the opposite conclusion as the authors in considering these indices in 3 cohorts of DLBCL patients (n = 561), including an important validation cohort that they did not consider. We provide these new data here (Figure 1A), having originally opted not to present them for space considerations.
Gene expression signatures add to risk assessment in DLBCL. (A) Estimates of prognostic value added by consideration of expression of two genes (TGS) to the five components of the IPI for predicting risk of death with DLBCL reflect significant improvement in a combined risk model (TGS-IPI) than with clinical indices alone (IPI). NRI, net reclassification improvement.9 NRI was considered both with infinite strata and with 3 predefined risk strata considering 0% to 10%, 11% to 30%, and >30% risk of death within the follow-up interval. Use of alternate microarray probe set summarization methods to estimate expression levels of (B) LMO2 and (C) TNFRSF9 and double logarithm transformation result in significant distortion of the (D) TGS, whether in patients treated with CHOP (black) or RCHOP (red).
Gene expression signatures add to risk assessment in DLBCL. (A) Estimates of prognostic value added by consideration of expression of two genes (TGS) to the five components of the IPI for predicting risk of death with DLBCL reflect significant improvement in a combined risk model (TGS-IPI) than with clinical indices alone (IPI). NRI, net reclassification improvement.9 NRI was considered both with infinite strata and with 3 predefined risk strata considering 0% to 10%, 11% to 30%, and >30% risk of death within the follow-up interval. Use of alternate microarray probe set summarization methods to estimate expression levels of (B) LMO2 and (C) TNFRSF9 and double logarithm transformation result in significant distortion of the (D) TGS, whether in patients treated with CHOP (black) or RCHOP (red).
Although Hong et al do not provide detailed methods to fully address this, several aspects of the analysis may have led to the discrepancy in their conclusions.
There is an error in the LIM domain only 2 (rhombotin-like 1) (LMO2) coefficient (0.032 instead of 0.32) for calculating the TGS.
The model parameters we reported weight gene expression values measured by quantitative real-time reverse-transcription polymerase chain reaction, with array data needing appropriate rescaling. The TGS values obtained by the authors are thus incorrect, because rescaling is equivalent to changing the relative weightings of the genes in the model, similar to how an equation considering “age” would differ depending on whether it was measured in days or years.
We used a custom gene-level chip definition to renormalize probe-level Affymetrix array data from Lenz et al,5 providing more accurate gene expression quantification (Figure 1B-C).
The publicly available normalized expression data used by the authors are already log2 transformed. Doing this again as suggested in the methods would result in data distortion (Figure 1D).
The authors state that gene expression scores do not add to “clinical factors,” but it is not stated whether they considered the 4 original IPI risk groups or its individual components, which yield up to 6 strata. If the latter, then the authors have refit (over-fit) the components of IPI to the test cohort and instead should have compared IPI to TGS-IPI, a composite model that we defined and tested in independent cohorts receiving the R-CHOP regimen (combining Rituximab with Cyclophosphamide, Hydroxydaunorubicin, Oncovin [vincristine], and Prednisone) (Figure 1A).
Importantly, the authors only assess TGS (derived in patients receiving rituximab) in an older cohort of patients not receiving rituximab. This is of little direct clinical relevance because RCHOP is the current therapeutic standard for DLBCL. They also suggest that gene signatures may provide additional information only in intermediate-risk patients. We argue that this is exactly the population where more refined prognostic indices are most valuable, because these are the patients for whom it is most difficult to make therapeutic decisions based on the current care standards.
Authorship
Contribution: A.J.G. and A.A.A. designed and performed analyses, and wrote the article.
Conflict-of-interest disclosure: The authors declare no competing financial interests.
Correspondence: Andrew J. Gentles, Stanford University Lucas Center for Imaging, 1201 Welch Rd, Stanford, CA 94305; email: andrewg@stanford.edu.

