Key Points
SOX11 silencing promotes the shift from a mature B cell into the initial plasmacytic differentiation phenotype in MCL.
SOX11 promotes tumor growth of MCL cells in vivo, highlighting its implication in the aggressive behavior of conventional MCL.
Abstract
Mantle cell lymphoma (MCL) is one of the most aggressive lymphoid neoplasms whose pathogenesis is not fully understood. The neural transcription factor SOX11 is overexpressed in most MCL but is not detected in other mature B-cell lymphomas or normal lymphoid cells. The specific expression of SOX11 in MCL suggests that it may be an important element in the development of this tumor, but its potential function is not known. Here, we show that SOX11 promotes tumor growth in a MCL-xenotransplant mouse model. Using chromatin immunoprecipitation microarray analysis combined with gene expression profiling upon SOX11 knockdown, we identify target genes and transcriptional programs regulated by SOX11 including the block of mature B-cell differentiation, modulation of cell cycle, apoptosis, and stem cell development. PAX5 emerges as one of the major SOX11 direct targets. SOX11 silencing downregulates PAX5, induces BLIMP1 expression, and promotes the shift from a mature B cell into the initial plasmacytic differentiation phenotype in both primary tumor cells and an in vitro model. Our results suggest that SOX11 contributes to tumor development by altering the terminal B-cell differentiation program of MCL and provide perspectives that may have clinical implications in the diagnosis and design of new therapeutic strategies.
Introduction
Mantle cell lymphoma (MCL) is one of the most aggressive lymphoid neoplasms.1 This biological behavior has been attributed to the molecular mechanisms involved in its pathogenesis combining the deregulation of cell proliferation, disruption of the DNA-damage–response pathways, and the activation of cell-survival mechanisms.2 Recent studies have identified a subgroup of patients with MCL that have an indolent clinical behavior and long survival even without chemotherapy. These tumors have very stable karyotypes and frequently carry hypermutated IGHV, indicating an origin in cells that have experienced the follicular germinal center microenvironment.3-7 A gene expression profiling (GEP) study has shown that these indolent MCL differ from conventional MCL in a particular gene signature that lacks the expression of some transcription factors of the high-mobility group (HMG). One of the best discriminatory genes between these 2 subtypes of tumors is SOX11 (SRY [sex-determining region-Y]-box11),4,6 a neural transcription factor whose function in normal and neoplastic B-cell development is unknown.
SOX11 belongs to the SOX gene family encoding for transcription factors that play a critical role in the regulation of cell fate and differentiation in major developmental processes. In mice, Sox11 is important in organ development and neurogenesis.8,9 SOX11 upregulation has been detected in various types of human solid tumors.10,11 SOX4, the SOX family member with the highest homology to SOX11, is a prominent transcription factor in lymphocytes of both B- and T-cell lineage12 and is crucial for B-cell lymphopoiesis.13 In contrast, SOX11 has no known lymphopoietic function and it is not expressed in lymphoid progenitors or in mature normal B-cells. However, it is expressed in virtually all aggressive MCL and at lower levels in a subgroup of Burkitt and acute lymphoblastic lymphomas, but not in other lymphoid neoplasms.14-16 These findings suggest that SOX11 plays a relevant role in the pathogenesis of these tumors. However, the function of SOX11 and its potential target genes in lymphoid cells remain unknown.
To identify direct target genes, transcriptional programs, and oncogenic pathways regulated by SOX11 in malignant lymphoid cells, we have used genome-wide promoter analysis and GEP after SOX11 silencing in MCL cell lines, followed by the validation in an in vivo murine model and in primary MCL tumors.
Materials and methods
Cell lines and patient samples
A total of 6 MCL cell lines, 5 SOX11 positive (Z138, GRANTA519, REC1, HBL2, and JEKO1) and 1 SOX11 negative (JVM2),17 were used for chromatin immunoprecipitation (ChIP) microarray (ChIP-chip) and/or ChIP quantitative polymerase chain reaction (qPCR) experiments, gene expression analysis after SOX11 silencing, and western blot (WB) experiments. Human embryonic kidney 293 (HEK293) cells were used for luciferase assays.
Microarray GEP data previously generated in 38 primary MCL (16 SOX11-positive and 22 SOX11-negative) were used for gene set enrichment analysis (GSEA) (GSE36000).7 Immunophenotypic surface markers were investigated in 6 of these primary MCL (3 SOX11 positive and 3 SOX11 negative) by flow cytometry.
Details on cell culture and primary tumor’s information are provided in “supplemental Materials and methods.”
ChIP
Z138, GRANTA519, and JVM2 cell lines were used for ChIP-chip and/or ChIP-qPCR analysis. Cells were crosslinked with 1% of formaldehyde for 10 minutes and chromatin sonicated using Branson Sonifer 250 followed by Biorupter sonicator from Diagenode. SOX11 antibody (sc-17347; Santa Cruz Biotechnology, Santa Cruz, CA) was used to immunoprecipitate protein-DNA complexes. Immunocomplexes were amplified in 2 steps using a GenomePlex Whole Genome Amplification WGA Kit (Sigma, St Louis, MO), following the manufacturer’s instructions, and used for ChIP-chip analysis and/or ChIP-qPCR. We performed ChIP assays in triplicate from Z138-SOX11-positive cells and in a single experiment from JVM2 cell line as negative control (supplemental Materials and methods).
ChIP-qPCR
Primers for the qPCR analysis of the SOX11 ChIP-enriched genomic DNA regions were designed using Primer3 (http://frodo.wi.mit.edu/) (supplemental Table 1). Amplified SOX11-ChIP DNA and 1:100 diluted input samples were analyzed in triplicate by qPCR using Fast SYBR Green Master Mix in a StepOnePlus PCR detection system (Applied Biosystems, Foster City, CA).
Reporter plasmid constructs and luciferase assay
The SOX11-binding site from the regulatory region of PAX5 gene (ChIP-peak region from 2435 bp to −1884 bp) was amplified by PCR using GRANTA519 genomic DNA and primers are listed in supplemental Table 1. Subsequently, the PCR fragment was cloned in front of a minimal promoter luciferase reporter vector pGL4.23[luc2/minP] (Promega, Leiden, The Netherlands). Constructs were sequenced using internal primers prior to use.
Lipofectamine 2000 system (Invitrogen, Life Technologies, Carlsbad, CA) was used for transient cotransfection experiments in HEK293 cells following the manufacturer’s instructions. Cotransfected HEK293 cells were harvested and luciferase activity was measured 24 hours after transfection with Dual-Glo Luciferase Assay System (Promega) and a Modulus microplate luminometer (Turner BioSystems, Sunnyvale, CA). All assays were performed in triplicate on separated days.
Gene expression profiling
Total RNA of Z138 cells stably transduced with short hairpins targeting SOX11 and control short hairpin was extracted with the TRIzol reagent following the manufacturer’s recommendations (Invitrogen). RNA integrity was examined with the Agilent 2100 Bioanalyser (Agilent Technologies, Palo Alto, CA) and hybridized to HG-U133plus2.0 GeneChips (Affymetrix) according to Affymetrix standard protocols. The analysis of the GEP is detailed in “supplemental Materials and methods.”
GSEA
We performed GSEA18 on 2 preranked lists of genes derived from in vitro SOX11 silencing microarray data and from our series of 38 purified primary MCL data. To generate these preranked lists, we analyzed the GEP of our in vitro cell line model as well as the GEP of 38 primary MCL according to their SOX11 expression levels. Details on GSEA are provided in “supplemental Materials and methods.”
SOX11 silencing by lentiviral infection
SOX11 shRNA lentiviral particles (shRNASOX11.1, clone ID NM_003108.3-982s1c1; shRNASOX11.2, clone ID NM_003108.3-1235s1c1; and shRNASOX11.3, clone ID NM_003108.3-454s1c1) were purchased from Sigma-Aldrich. Control shRNA lentiviral particle (Clone ID sc-108080) was purchased from Santa Cruz Biotechnology.
SOX11 knockdown stable MCL cell lines were generated by lentiviral transduction of PLKO1-puro–shSOX11 and PLKO1-puro–scramble constructs in 3 MCL cell lines (Z138, GRANTA519, and JEKO1). Details on SOX11 silencing are provided in “supplemental Materials and methods.”
WB analysis
Protein extract preparation and WB experiments were performed as previously described19 using antibodies against hemagglutinin (Roche Applied Science, Indianapolis, IN; 12CA5), SOX11 (Atlas Antibodies, Stockholm, Sweden [HPA000536]; Santa Cruz Biotechnology [H-290 and C-20]), PAX5 (Santa Cruz Biotechnology; C-20), BLIMP1 (CNIO, Madrid, Spain; Ros 195G/G5), IRF4 (Santa Cruz Biotechnology; M-17), GAPDH (Santa Cruz Biotechnology; A-3), and α-tubulin (Oncogene, Uniondale, NY; CP06-100UG). Membranes were developed with chemiluminescence substrate Pierce ELC WB substrate (Thermo Fisher Scientific, South Logan, UT) and visualized on a LAS4000 device (Fujifilm, Tokyo, Japan). Protein quantification was done with Image Gauge software (Fujifilm).
qRT-PCR
qRT-PCR was performed as described before19 using a designed primer set and TaqMan MGB probe for SOX11 using Primer Express Software Version 2.0 (Applied Biosystems) (primers used are shown in supplemental Table 1). Inventoried TaqMan Gene Expression Assays were used for HSPD1 (Hs01941522_u1), SUV39H2 (Hs00226595_m1), SEPT2 (Hs00189358_m1), MSI2 (Hs-00292670_m1), PAX5 (Hs00277134_m1), VPREB3 (Hs00429452_m1), SPIB (Hs0062150_m1), EBF1 (Hs00365513_m1), CD19 (Hs00174333_m1), IKZF3 (Hs00232635_m1), LEF1 (Hs01547250_m1), and LCK (Hs00178427_m1). Relative quantification of gene expression was analyzed with the 2−ΔΔCt method using GUS (Hs00939627_m1) as the endogenous control.
Flow cytometry studies
For immunophenotype analysis, 500 000 cells of interest were collected in 1.5-mL tubes, washed once in phosphate-buffered saline 0.5% bovine serum albumin (BSA), and stained with 5 μL of antibody against CD20 (2H7), CD24 (ML5), immunoglobulin (Ig) M (G20-127), IgD (IA6-2), CD5 (UCHT2), CD19 (HIB19), CD38 (HIT2) (all from BD Pharmingen, San Diego, CA), and CD138 (B-A38; Beckman Coulter, Carlsbad, CA) for 30 minutes at 4°C in the dark. Cells were then washed 3 times in phosphate-buffered saline 0.5% BSA and acquired and analyzed using the Attune Acoustic Focusing Cytometer and Software (Applied Biosystems). For the analysis, 10 000 events were collected in the lymphocyte gate. Details on proliferation assay, cell-cycle analysis, and apoptosis assay are provided in “supplemental Materials and methods.”
Xenograft mouse model and tumor phenotyping
CB17 severe combined immunodeficient (CB17-SCID) mice (Charles River Laboratory, Wilmington, MA) were housed in the animal care facility under a 12/12-hour light/dark cycle at 22°C, and they received a standard diet and acidified water ad libitum. With the use of a protocol approved by the animal testing Ethical Committee of the University of Barcelona, mice were subcutaneously inoculated into their lower dorsum with 1 × 10⁷ Z138shSOX11.1 (n = 8), shSOX11.3 (n = 6), shControl (n = 7), JEKOshSOX11.3 (n = 5), JEKOshControl (n = 5), GRANTA519shSOX11.3 (n = 5), and GRANTA519shControl (n = 5) in Matrigel basement membrane matrix (Becton Dickinson, San Jose, CA). The shortest and longest diameters of the tumor were measured with external calipers every 3 days, and tumor volume (in mm3) was calculated with the use of the following standard formula: (the shortest diameter)2 × (the longest diameter) × 0.5. Animals were sacrificed according to institutional guidelines, and tumor xenografts were paraffin embedded on silane-coated slides in a fully automated immunostainer (Bond Max; Vision Biosystems, Mount Waverley, Australia).
Immunohistochemical staining
Immunohistochemical studies were performed as previously described16,20 using antibodies against human Ki67, kappa, lambda, and IgM (ready to use; Dako, Glostrup, Denmark), anti-phosphohistone H3 (Epitomics, Burlingame, CA; polyclonal), anti–caspase-3 cleaved (Cell Signaling Technology, Danvers, MA; 5A1E), SOX11 (Atlas Antibodies; HPA000536), cyclin D1 (Thermo Fisher Scientific; EPR2241IHC), PAX5 (Santa Cruz Biotechnology; sc-1974), and BLIMP1 (CNIO; Ros 195G/G5).
Necrotic areas were quantified using the digitalized images of the activated caspase-3 immunohistochemical staining acquired with an Olympus BX51 microscope at original magnification ×4 and analyzed with an Olympus Cell B Basic Imaging Software. Necrotic areas were delineated by cleaved caspase-3–positive staining and quantified as the sum of all necrotic areas (μm2) divided by the total area of the core analyzed (μm2).
Statistical analysis
Data are represented as mean ± standard deviation (SD) of 3 independent experiments. Statistical tests were performed using SPSS v16.0 software. Comparison between 2 groups of samples was evaluated by independent-sample t test, and results were considered statistically significant when P < .05.
Results
Genome-wide promoter analysis of SOX11 in MCL
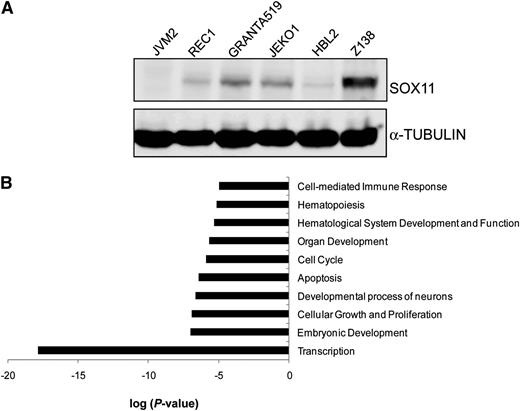
We first investigated the direct target genes of SOX11 using ChIP and DNA microarrays (ChIP-chip). We used a MCL cell line with high SOX11 expression (Z138) and one negative for SOX11 (JVM2) (Figure 1A). ChIP was performed using a SOX11 specific antibody (supplemental Figure 1). ChIP-enriched DNA sequences were amplified and hybridized to a high-resolution DNA tiling array spanning promoter regions of the whole human genome. These experiments identified 5842 significant enriched peaks belonging to 1133 unique genes (SOX11-bound genes) that were consistently enriched in immunoprecipitated material across all 3 independent Z138 replicates after subtracting the corresponding nonspecific immunoprecipitated material in JVM2 (supplemental Table 2).
ChIP-chip screening of SOX11-bound target genes in MCL cell lines. (A) The expression levels of SOX11 protein in different MCL cell lines (JVM2, REC1, GRANTA519, JEKO1, HBL2, and Z138) were detected by WB using an anti-SOX11 antibody (H-290). α-Tubulin was used as a loading control. (B) IPA functional annotation tool related to the high-confidence SOX11-bound genes. The 10 most significant biological-process GO terms and their log P values are shown.
ChIP-chip screening of SOX11-bound target genes in MCL cell lines. (A) The expression levels of SOX11 protein in different MCL cell lines (JVM2, REC1, GRANTA519, JEKO1, HBL2, and Z138) were detected by WB using an anti-SOX11 antibody (H-290). α-Tubulin was used as a loading control. (B) IPA functional annotation tool related to the high-confidence SOX11-bound genes. The 10 most significant biological-process GO terms and their log P values are shown.
The promoter region of SOX11 was not identified in this analysis. We have reported that SOX11 expression is associated with active histone marks.19 We have now observed a significant reduction in the enrichment of the activating histone mark H3K4me3 at the SOX11 promoter upon SOX11 silencing (supplemental Figure 2), suggesting that SOX11 may indirectly regulate its own expression by epigenetic mechanisms.
Gene ontology (GO) term enrichment analysis showed several biological processes overrepresented in the SOX11-bound genes, including transcription, embryonic and neuronal development, cell growth and proliferation, cell death and apoptosis, cell cycle, hematopoiesis, and hematological system development and function (Figure 1B).
Differential gene expression profiling after SOX11 silencing
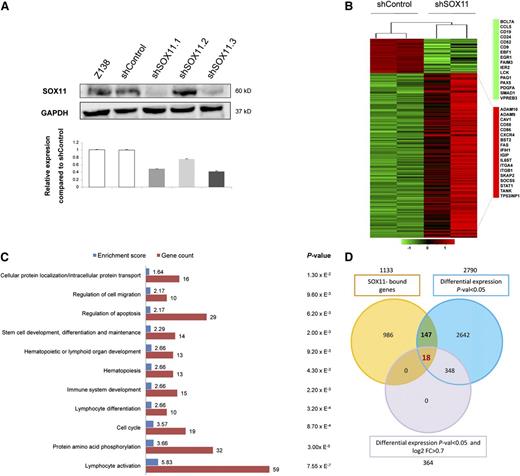
To determine the transcriptional programs regulated by SOX11, we generated a MCL cellular model by silencing SOX11 expression (Figure 2A). We then compared the GEP of stably transduced shSOX11 and shControl Z138 cells (Figure 2B and supplemental Table 3). The top annotated functions of the differentially expressed genes included lymphocyte activation and differentiation, phosphorylation, cell cycle, immune system development, and hematopoiesis (Figure 2C). A GSEA using the genes differentially expressed in primary SOX11-positive and SOX11-negative MCL confirmed that the GEP observed in our in vitro model was representative of that observed in these primary MCL (supplemental Table 4 and supplemental Figure 3).
GEP upon SOX11 silencing. (A) SOX11 silencing in Z138 stably transduced with shSOX11.1, shSOX11.2, and shSOX11.3 was verified (upper panel) at the protein level by WB using GAPDH as a loading control and (lower panel) at the transcriptional level by qRT-PCR. A scramble shControl and untransduced cells (Z138) are also shown. Bar plot represents the mean ± SD of 3 independent experiments. (B) Heat map illustrating 366 significant differentially expressed genes (adjusted P < .05 and log2 FC > 0.7) in Z138 shSOX11.1 and shSOX11.3 compared with 2 Z138-shControl cells. Red indicates increased expression and green decreased expression relative to the median expression level according to the color scale shown. (C) DAVID functional annotation of the 366 differentially expressed genes. The 11 most significant (P < .05) biological process GO terms, their P value, enrichment score, and gene count are shown. (D) Venn diagram depicting the overlap of 1133 SOX11-bound genes (orange circle), 2790 significant differentially expressed genes (P < .05) upon SOX11 silencing (blue circle), and differentially expressed genes using more stringent statistical criteria (P < .05 and log2 FC > 0.7) (purple circle).
GEP upon SOX11 silencing. (A) SOX11 silencing in Z138 stably transduced with shSOX11.1, shSOX11.2, and shSOX11.3 was verified (upper panel) at the protein level by WB using GAPDH as a loading control and (lower panel) at the transcriptional level by qRT-PCR. A scramble shControl and untransduced cells (Z138) are also shown. Bar plot represents the mean ± SD of 3 independent experiments. (B) Heat map illustrating 366 significant differentially expressed genes (adjusted P < .05 and log2 FC > 0.7) in Z138 shSOX11.1 and shSOX11.3 compared with 2 Z138-shControl cells. Red indicates increased expression and green decreased expression relative to the median expression level according to the color scale shown. (C) DAVID functional annotation of the 366 differentially expressed genes. The 11 most significant (P < .05) biological process GO terms, their P value, enrichment score, and gene count are shown. (D) Venn diagram depicting the overlap of 1133 SOX11-bound genes (orange circle), 2790 significant differentially expressed genes (P < .05) upon SOX11 silencing (blue circle), and differentially expressed genes using more stringent statistical criteria (P < .05 and log2 FC > 0.7) (purple circle).
Interestingly, among the significant differentially expressed genes between shSOX11 and shControl cells, we observed upregulation of key regulators of plasma cell differentiation and pronounced downregulation of B-cell genes. To further characterize the significance of these changes, we performed a GSEA using well-defined gene signatures related to the different steps of the mature B-cell and plasma cell differentiation programs (supplemental Table 4).21-24 These analyses showed that the GEP of Z138shControl cells was enriched for gene signatures related to the mature B-cell program whereas Z138shSOX11 cells were enriched in gene signatures related to the plasma cell differentiation program (supplemental Table 5 and supplemental Figure 4). These findings indicate that SOX11 silencing triggers a shift from the mature B cell to a plasmacytic gene expression program in MCL cells.
SOX11 directly regulates the transcription of PAX5
To determine the direct targets transcriptionally regulated by SOX11, we overlaid the list of SOX11-bound genes and those with differential expression upon SOX11 knockdown and found 147 genes in common. From these 147 genes, 18 genes still overlapped using more stringent statistical criteria (P < .05 and log2 fold change > 0.7) (Figure 2D and supplemental Table 6).
Interestingly, among these 18 genes we identified PAX5, an essential transcription factor regulating B-cell identity in early B-cell development25 and late B-cell differentiation,26 as one of the highest-confident SOX11-bound genes (false discovery rate [FDR] < 0.1 and peak score ≥ 0.5). We also found genes that can contribute to SOX11 hematopoietic and B-cell activation functions (MSI2 and HSPD1, respectively).
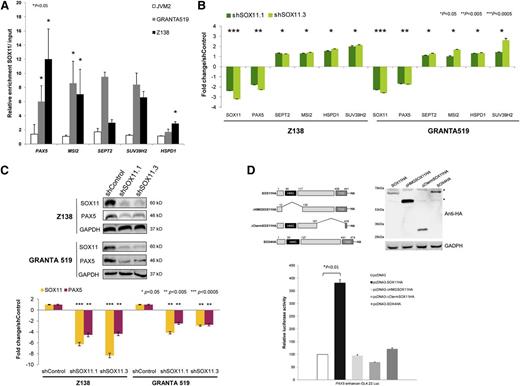
We then verified the direct binding of SOX11 to the regulatory regions of the most significantly overlaid genes by ChIP-qPCR in Z138 and GRANTA519 MCL cell lines. As expected, no binding within these regulatory regions was detected in the SOX11-negative JVM2 (Figure 3A). Downregulation of PAX5 in stable SOX11-knockdown MCL cell lines was confirmed by qRT-PCR and WB (Figure 3B-C, respectively). Upregulation of MSI2, HSPD1, SUV39H2, and SEPT2 was also observed but to a much lesser extent than PAX5, prompting us to focus on the SOX11-PAX5 relationship.
SOX11 directly regulates PAX5 transcription. (A) Binding of SOX11 to regulatory regions of PAX5, MSI2, SEPT2, SUV39H2, and HSPD1 was confirmed by ChIP-qPCR in different MCL cell lines. Results are shown as enrichment relative to input. (B) Levels of the indicated transcripts in Z138 and GRANTA519 quantified by qRT-PCR after SOX11 silencing. Fold-change differences compared with control cells are shown. (C) Upper panel: Levels of SOX11 and PAX5 in Z138 and GRANTA519 cell lines stably transduced with shControl, shSOX11.1, or shSOX11.3 determined by WB, using GAPDH as a loading control. Lower panel: Fold-change differences of SOX11 and PAX5 protein expression levels between control and silenced cells. SOX11 and PAX5 expression levels were corrected by quantification of GAPDH expression levels. (D) Luciferase assays in transient cotransfections of PAX5 enhancer-GL4.23 Luc with SOX11 full-length, the truncated SOX11 proteins (SOX11ΔHMG and SOX11ΔCtermTAD), or SOX4 full-length expression vectors, in HEK293 cells. Upper panel: Schematic representation of the constructs and results of the WB experiment of SOX11 mutants are shown. *Nonspecific bands. Bottom panel: Results are shown as fold induction relative to luciferase activity in cotransfection with the empty vector (pcDNA3). Bar plot represents the mean ± SD of 3 independent experiments. The significance of difference was determined by paired t test. HA, hemagglutinin.
SOX11 directly regulates PAX5 transcription. (A) Binding of SOX11 to regulatory regions of PAX5, MSI2, SEPT2, SUV39H2, and HSPD1 was confirmed by ChIP-qPCR in different MCL cell lines. Results are shown as enrichment relative to input. (B) Levels of the indicated transcripts in Z138 and GRANTA519 quantified by qRT-PCR after SOX11 silencing. Fold-change differences compared with control cells are shown. (C) Upper panel: Levels of SOX11 and PAX5 in Z138 and GRANTA519 cell lines stably transduced with shControl, shSOX11.1, or shSOX11.3 determined by WB, using GAPDH as a loading control. Lower panel: Fold-change differences of SOX11 and PAX5 protein expression levels between control and silenced cells. SOX11 and PAX5 expression levels were corrected by quantification of GAPDH expression levels. (D) Luciferase assays in transient cotransfections of PAX5 enhancer-GL4.23 Luc with SOX11 full-length, the truncated SOX11 proteins (SOX11ΔHMG and SOX11ΔCtermTAD), or SOX4 full-length expression vectors, in HEK293 cells. Upper panel: Schematic representation of the constructs and results of the WB experiment of SOX11 mutants are shown. *Nonspecific bands. Bottom panel: Results are shown as fold induction relative to luciferase activity in cotransfection with the empty vector (pcDNA3). Bar plot represents the mean ± SD of 3 independent experiments. The significance of difference was determined by paired t test. HA, hemagglutinin.
To verify the transcriptional effect of SOX11 on the PAX5 promoter, the amplified SOX11 ChIPed-PAX5 fragment (supplemental Figure 5) was cloned in front of a minimal promoter luciferase reporter and tested in transient cotransfections with SOX11 expression vector. The induction in luciferase activity was detected in the coexpression with SOX11 but not with SOX4 or truncated SOX11 proteins lacking the HMG domain (ΔHMGSOX11) or the C-terminal TAD domain (ΔTADSOX11) (Figure 3D), both of which are required for its transcriptional activity.27,28 These findings demonstrate the specificity of SOX11 in regulating the transcription of PAX5.
SOX11-knockdown MCL cell lines display early plasmacytic differentiation
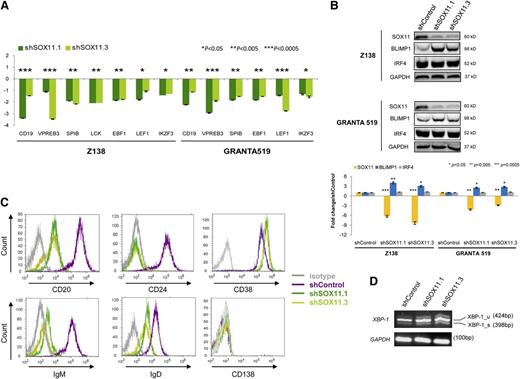
PAX5 is the critical transcription factor that determines and maintains B-cell identity by activating the expression of B-cell–specific genes and simultaneously repressing genes that promote plasma cell differentiation.25,26 The significant shift from a mature B cell to a plasmacytic gene expression program identified by GSEA in our SOX11-knockdown cells was highly suggestive of a major effect of the direct modulation of PAX5 by SOX11 in these tumor cells. These observations prompted us to further investigate the expression of genes regulated by PAX5 in SOX11-knockdown cells. As expected, several B-cell genes were downregulated (CD19, VPREB3, SPIB, LCK, EBF1, LEF1, and IKZF3) in SOX11 knockdown cells compared with control cells (Figure 4A).
SOX11 activates B-cell–specific genes and represses plasma cell gene program. (A) Messenger RNA expression levels of the indicated genes were analyzed by qRT-PCR in Z138 and GRANTA519 stably transduced with shSOX11.1 or shSOX11.3. Figure shows the fold differences compared with the corresponding control cells (±SD; n = 3 technical replicates). P values are shown. The significance of difference was determined by independent-samples t test. (B) Upper panel: BLIMP1 and IRF4 expression levels in Z138 and GRANTA519 stably transduced with shControl, shSOX11.1, or shSOX11.3 assessed by WB, using GAPDH as a loading control. Lower panel: Fold-change differences of SOX11, BLIMP1, and IRF4 protein expression levels between control and silenced cells. SOX11, BLIMP1, and IRF4 expression levels were corrected by quantification of GAPDH expression levels. (C) Histograms showing the expression of B-cell and plasma cell surface markers (CD20, CD24, CD38, and CD138) and surface IgM and IgD measured by flow cytometry in shControl, shSOX11.1, and shSOX11.3 Z138 cell lines. Isotype control is shown in gray. (D) XBP1 mRNA expression levels by RT-PCR in Z138shControl, shSOX11.1, or shSOX11.3. GADPH was used for the loading control.
SOX11 activates B-cell–specific genes and represses plasma cell gene program. (A) Messenger RNA expression levels of the indicated genes were analyzed by qRT-PCR in Z138 and GRANTA519 stably transduced with shSOX11.1 or shSOX11.3. Figure shows the fold differences compared with the corresponding control cells (±SD; n = 3 technical replicates). P values are shown. The significance of difference was determined by independent-samples t test. (B) Upper panel: BLIMP1 and IRF4 expression levels in Z138 and GRANTA519 stably transduced with shControl, shSOX11.1, or shSOX11.3 assessed by WB, using GAPDH as a loading control. Lower panel: Fold-change differences of SOX11, BLIMP1, and IRF4 protein expression levels between control and silenced cells. SOX11, BLIMP1, and IRF4 expression levels were corrected by quantification of GAPDH expression levels. (C) Histograms showing the expression of B-cell and plasma cell surface markers (CD20, CD24, CD38, and CD138) and surface IgM and IgD measured by flow cytometry in shControl, shSOX11.1, and shSOX11.3 Z138 cell lines. Isotype control is shown in gray. (D) XBP1 mRNA expression levels by RT-PCR in Z138shControl, shSOX11.1, or shSOX11.3. GADPH was used for the loading control.
The transcription factors BLIMP1, XBP1, and IRF4 are critical regulators promoting plasma cell differentiation whereas PAX5 inhibits plasma cell development by repressing BLIMP1 and XBP1 expression.26,29 We next examined the modulation of these transcription factors in SOX11-knockdown MCL cells. IRF4 was already expressed in control cells and SOX11 silencing did not modify its expression levels. On the contrary, SOX11 knockdown resulted in a marked increase of BLIMP1 protein levels compared with control cells (Figure 4B and supplemental Figure 6C). Consistent with BLIMP1 function as a repressor of the B-cell program during plasma cell differentiation,30 we found decreased or undetectable expression of B-cell surface markers CD20, CD24, IgD, and IgM in SOX11-silenced cells compared with control cells. The plasma cell marker CD38 was already expressed in control cells and only marginally upregulated in SOX11 knockdown whereas expression of CD138 was undetected in both control and silenced cell lines (Figure 4C).
Full plasma cell differentiation includes synthesis and secretion of immunoglobulins, and this secretory program is controlled by the activated splicing form of XBP1. SOX11 knockdown slightly increased the levels of XBP1(u) but the levels of the spliced form of XBP1(s) did not change (Figure 4D).
Altogether, these findings indicate that SOX11 silencing in MCL cell lines promotes the initial steps into plasmacytic differentiation with downregulation of mature B-cell markers and increasing levels of BLIMP1. However, the absence of XBP1 splicing and CD138 expression indicates that the full plasma cell program is not completed.31,32
SOX11 promotes tumor growth of MCL in vivo
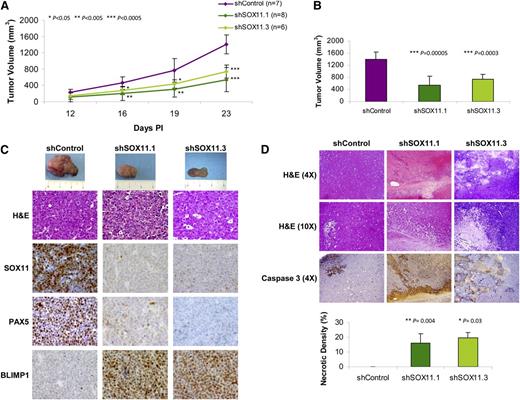
To investigate the potential tumorigenic ability of SOX11 in vivo, we studied the effect of SOX11 downregulation in a MCL-xenotransplant model by inoculating CB17-SCID mice with stably transduced Z138shSOX11 and shControl cell lines. Tumor growth was followed up, and at 23 days postinoculation (PI) tumor size in control mice reached 8.8% of the body weight. SOX11 silencing reduced tumor growth compared with SOX11-positive control tumors, and significant differences in tumor size were already achieved at day 16 PI (Figure 5A). Tumors isolated from mice bearing shSOX11.1- and shSOX11.3-silenced cells showed 73.1% and 54.9% reduction in tumor burden, respectively, compared with SOX11-positive tumors (Figure 5B). We also observed a similar significant reduction in tumor growth and size, at day 23 PI, of the tumors derived from JEKO1shSOX11 and GRANTA519shSOX11 compared with their SOX11-positive tumor counterparts, JEKO1shControl and GRANTA519shControl (supplemental Figure 6A-B).
SOX11 silencing inhibits the growth of MCL tumors in SCID mice. (A) Z138 stably transduced with shSOX11.1, shSOX11.3, and shControl (107cells/mouse) were subcutaneously inoculated into the right flank of CB17-SCID mice. Tumor growth was measured using a caliper at the indicated days PI. Bar plot represents the mean ± SD. (B) Tumor volume (mm3) of Z138shSOX11.1 (n = 8), Z138shSOX11.3 (n = 6), and Z138shControl (n = 7) cells at day 23 PI into the lower dorsum of CB17-SCID mice. (C) Macroscopic appearance (upper panel) and consecutive histological sections from representative shSOX11 and shControl tumors stained with hematoxylin and eosin (H&E) and specific antibodies anti-human SOX11, PAX5, and BLIMP1 (×40). (D) Histologic sections of representative shSOX11 and shControl tumors (upper panels, H&E ×4 and ×10). shSOX11 tumors show extensive necrotic areas that are minimal in shControl tumors. Necrotic areas are highlighted by the immunostaining for activated caspase-3 (×4). Lower panel: Density (percentage of necrotic areas vs total area of the histologic section) of necrotic areas in control and SOX11-silenced tumors delineated by the presence of activated caspase-3–positive areas. Bar plot represents the mean percentage ± SD. P values are shown. The significance of difference was determined by independent-samples t test.
SOX11 silencing inhibits the growth of MCL tumors in SCID mice. (A) Z138 stably transduced with shSOX11.1, shSOX11.3, and shControl (107cells/mouse) were subcutaneously inoculated into the right flank of CB17-SCID mice. Tumor growth was measured using a caliper at the indicated days PI. Bar plot represents the mean ± SD. (B) Tumor volume (mm3) of Z138shSOX11.1 (n = 8), Z138shSOX11.3 (n = 6), and Z138shControl (n = 7) cells at day 23 PI into the lower dorsum of CB17-SCID mice. (C) Macroscopic appearance (upper panel) and consecutive histological sections from representative shSOX11 and shControl tumors stained with hematoxylin and eosin (H&E) and specific antibodies anti-human SOX11, PAX5, and BLIMP1 (×40). (D) Histologic sections of representative shSOX11 and shControl tumors (upper panels, H&E ×4 and ×10). shSOX11 tumors show extensive necrotic areas that are minimal in shControl tumors. Necrotic areas are highlighted by the immunostaining for activated caspase-3 (×4). Lower panel: Density (percentage of necrotic areas vs total area of the histologic section) of necrotic areas in control and SOX11-silenced tumors delineated by the presence of activated caspase-3–positive areas. Bar plot represents the mean percentage ± SD. P values are shown. The significance of difference was determined by independent-samples t test.
Concordant with the in vitro results, the in vivo SOX11-silenced tumors showed SOX11 and PAX5 downregulation and BLIMP1 upregulation compared with SOX11-positive tumors (Figure 5C and supplemental Figure 6D). The Ki-67 proliferation index and phosphohistone H3 were similar in control and silenced tumors (supplemental Figure 7A). We did not observe significant changes in cell density, proliferation, cycle phases, or viability after SOX11 silencing in cell lines in culture (supplemental Figure 7B-E). However, in vivo SOX11-silenced tumors had large necrotic areas with high levels of activated cleaved caspase-3 that were minimal or not observed in SOX11-positive tumors (Figure 5D and supplemental Figure 6D). These results suggest that SOX11 sustains the B-cell differentiation program and tumor cell survival in vivo and support the implication of SOX11 expression in the aggressive behavior of these tumors.
SOX11 expression and B-cell differentiation program in primary tumors
We next investigated whether SOX11 modulation of the mature B-cell and early plasmacytic differentiation programs observed in vitro also occurred in primary cells from SOX11-positive and SOX11-negative MCL tumors.
We first investigated whether the expression of the SOX11-bound genes was modulated in MCL. GSEA analysis showed a statistically significant enrichment of SOX11 high-confident bound genes identified by ChIP-chip (supplemental Table 2) in both Z138shControl and primary SOX11-positive MCL (supplemental Figure 8), indicating that in these models SOX11 significantly activates the expression of its target genes.
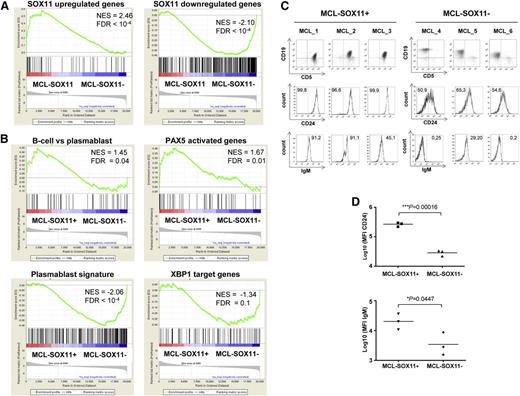
We then defined 2 gene sets related to SOX11 transcriptional program extracted from our in vitro microarray data: SOX11-upregulated genes (genes downregulated upon SOX11 silencing) and SOX11-downregulated genes (upregulated upon knockdown) (supplemental Table 4). Notably, we found that SOX11-positive primary MCL had a GEP significantly enriched in SOX11-upregulated genes (normalized enrichment score [NES] = 2.46, FDR < 10−4). Conversely, SOX11-negative primary MCL presented an enrichment in SOX11-downregulated genes (NES = −2.10, FDR < 10−4) (Figure 6A).
MCL SOX11-negative primary tumors lose B-cell identity and gain in a plasmablast gene signature. (A-B) GSEA analysis on preranked lists. (A) Using our customized gene sets described in “supplemental Materials and methods,” SOX11 upregulated and downregulated genes and primary MCL-SOX11+ tumors are enriched for SOX11-upregulated genes whereas primary MCL-SOX11− tumors are enriched in SOX11-downregulated genes. (B) MCL-SOX11+ tumors are enriched in B-cell vs plasmablast and PAX5 activated genes gene sets whereas MCL-SOX11− tumors are enriched in plasmablast signature and XBP1 target genes. NES and FDR are shown. Statistical significance is considered when FDR < 0.1. (C) Analysis of CD24 and surface IgM expression in CD19+ CD5+ cells (MCL-SOX11+) or CD19+ CD5− cells (MCL-SOX11−). Numbers inside the histograms indicate the percentage of positive cells above the isotype control. (D) Mean fluorescence intensity (MFI) of surface CD24 and IgM expression in primary MCL tumors.
MCL SOX11-negative primary tumors lose B-cell identity and gain in a plasmablast gene signature. (A-B) GSEA analysis on preranked lists. (A) Using our customized gene sets described in “supplemental Materials and methods,” SOX11 upregulated and downregulated genes and primary MCL-SOX11+ tumors are enriched for SOX11-upregulated genes whereas primary MCL-SOX11− tumors are enriched in SOX11-downregulated genes. (B) MCL-SOX11+ tumors are enriched in B-cell vs plasmablast and PAX5 activated genes gene sets whereas MCL-SOX11− tumors are enriched in plasmablast signature and XBP1 target genes. NES and FDR are shown. Statistical significance is considered when FDR < 0.1. (C) Analysis of CD24 and surface IgM expression in CD19+ CD5+ cells (MCL-SOX11+) or CD19+ CD5− cells (MCL-SOX11−). Numbers inside the histograms indicate the percentage of positive cells above the isotype control. (D) Mean fluorescence intensity (MFI) of surface CD24 and IgM expression in primary MCL tumors.
These results suggest that the SOX11 transcriptional program derived from our knockdown experiments is also observed in primary tumors, prompting us to evaluate whether the modulation of B-cell and plasmacytic differentiation programs also occurs in these primary tumors.
We thus performed a GSEA with gene signatures of the different steps of the mature B-cell and plasma cell differentiation programs used in our previous analysis (supplemental Table 4). In line with the in vitro observations, this analysis revealed that SOX11-positive MCL were significantly enriched in B-cell vs plasmablast and PAX5 activated genes gene sets (NES = 1.45, FDR = 0.04 and NES = 1.67, FDR = 0.01, respectively) whereas SOX11-negative MCL showed statistical significance in the plasmablast signature23 and XBP1 target genes (NES = −2.06, FDR < 10−4 and NES = −1.34, FDR = 0.1, respectively) (Figure 6B).
We then studied the same panel of surface B-cell markers in the primary MCL cohort by flow cytometry. Concordant with the in vitro studies, SOX11-positive tumors had stronger expression of the mature B-cell marker CD24 and brighter IgM than SOX11-negative MCL (Figure 6C-D).
SOX11-silenced tumors in xenografted experiments showed increased apoptotic cells. We performed a GSEA using gene signatures related to apoptotic pathways and observed that SOX11-knockdown MCL cell lines were enriched in several apoptotic gene signatures (Fas, apoptosis, and caspase pathways). The caspase-pathway gene signature was also significantly enriched in SOX11-negative primary MCL (supplemental Figure 9). These results suggest that SOX11 may regulate cell survival by controlling the expression of apoptotic genes in MCL cells.
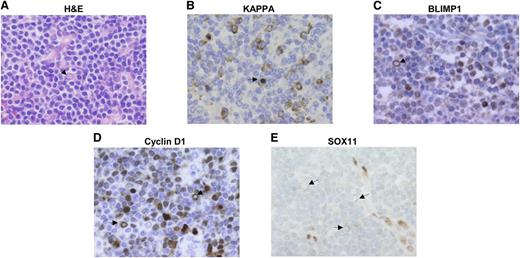
Primary MCL have a monotonous cell morphology lacking the modulation toward plasmacytic differentiation observed in other types of B-cell lymphomas.1 Intriguingly, some rare cases of MCL may show plasmacytic differentiation.33 We postulated that this differentiation would occur in SOX11-negative MCL. In a review of our files, we found 2 MCL with plasmacytic differentiation expressing IgM, kappa, and BLIMP1 (Figure 7A-C). All tumor cells, including the cells with plasmacytic differentiation, expressed strong cyclin D1 but were SOX11 negative (Figure 7D-E). These results reinforce the idea that SOX11-negative MCL may modulate the mature B-cell and early plasma cell differentiation programs in primary tumors whereas the strong expression of SOX11 in conventional MCL may block the cells in a mature B-cell stage, preventing their further progress into differentiation.
Plasma cells in MCL tumors are SOX11 negative. (A) MCL with focal plasmacytic differentiation. Some cells show Dutcher bodies corresponding to the accumulation of restricted immunoglobulins (arrow) (H&E; ×60). (B-C) Tumor cells expressing restricted kappa light chain and BLIMP1 (×60). (D) Tumor cells expressing cyclin D1 (×60). (E) SOX11 expression is negative in the tumor cells but positive in internal controls such as endothelial and histiocytic cells (×60). Arrows point to tumor cells with Dutcher bodies.
Plasma cells in MCL tumors are SOX11 negative. (A) MCL with focal plasmacytic differentiation. Some cells show Dutcher bodies corresponding to the accumulation of restricted immunoglobulins (arrow) (H&E; ×60). (B-C) Tumor cells expressing restricted kappa light chain and BLIMP1 (×60). (D) Tumor cells expressing cyclin D1 (×60). (E) SOX11 expression is negative in the tumor cells but positive in internal controls such as endothelial and histiocytic cells (×60). Arrows point to tumor cells with Dutcher bodies.
Discussion
In this study, we have used a ChIP-chip approach to reveal the first human genome-wide promoter analysis of SOX11 and identified 1133 unique genes as putative targets of this transcription factor in MCL. Using GEP, we have also identified 366 genes whose expression was modulated by silencing SOX11 in MCL cell lines. GO analyses identified that genes regulated by SOX11 in these lymphoid cells were involved in lymphocyte activation and differentiation, phosphorylation, cell cycle, immune system development, hematopoiesis, and lymphoid organ development as the top annotated functions, but also in stem cell development, apoptosis, and cell migration.
The role of different members of the SOX gene family, including SOX11, as direct regulators of an expression program of early neural lineage development has been recently recognized in a murine model.34 Our ChIP-chip study confirmed SOX11 binding to regulatory regions of similar genes involved in neuronal development (BTG2, MEIS1, and NR2E1), but these genes were not expressed in our lymphoid model, indicating the tissue-specific regulation of the SOX11-bound genes. In our study, the main target genes modulated by SOX11 were involved in immune system development and hematopoiesis, and PAX5, MSI2, and HSPD1 were among the most significant genes directly regulated by SOX11.
The significant shift from a mature B cell to a plasmacytic gene expression program identified by GSEA in our SOX11 knockdown cells was highly suggestive of a major effect of the direct modulation of PAX5 by SOX11 in these tumor cells. We have demonstrated here that PAX5 is a direct target gene regulated by SOX11 and the constitutional expression of SOX11 in these tumors maintains the downstream PAX5 program. Thus, several B-cell–specific genes directly activated by PAX5 were downregulated in SOX11-knockdown MCL cell lines whereas BLIMP1 was upregulated upon SOX11 repression. The slight upregulation of XBP1(u) variant and the surface phenotype of Z138shSOX11 cells confirmed that SOX11 downregulation is able to initiate the terminal B-cell differentiation process but is not sufficient to drive the full plasma cell program.
SOX11 is constitutively overexpressed in the vast majority of MCL.14-16 However, recent studies have identified a subset of SOX11-negative MCL4 that differ from conventional SOX11-positive tumors in their frequent hypermutated IGHV, leukemic, nonnodal presentation and more indolent clinical behavior.3-5,7 The significant reduction on tumor growth of the SOX11-silenced cells in the xenograft experiments is consistent with the indolent clinical course of the nonnodal SOX11-negative primary MCL and highlights the implication of SOX11 expression in the aggressive behavior of conventional MCL. Some studies have identified SOX11-negative MCL with aggressive behavior but virtually all these cases have TP53 alterations.6,7,35 In our study, we confirmed that the gene signatures modulated upon SOX11 silencing in vitro were also enriched in primary MCL, indicating that our cell line model closely reflects the in vivo situation. Similarly, primary SOX11-positive MCL showed a GEP characteristic of mature B cells whereas negative tumors exhibited a relative shift to genes distinctive of early plasmacytic differentiation steps. However, the downregulation of SOX11 in both the in vitro model and primary tumors is not sufficient to trigger a mature plasma cell program. These results, together with our finding that the uncommon plasmacytic differentiation in MCL appears to occur in SOX11-negative tumors, reinforce the idea that these tumors may modulate the mature B-cell and plasmacytic differentiation programs. Conversely, SOX11 overexpression in aggressive MCL may block the cells in a mature B-cell stage, preventing their further differentiation. The resistance of MCL to new treatments with proteasome inhibitors has been linked to the development of plasmacytic differentiation, suggesting that the findings in our study may also have implications in the design of new therapeutic strategies.36
The significance of blocking plasma cell differentiation program as a relevant oncogenic mechanism in lymphoid neoplasias has been previously observed. The impairment of terminal B-cell differentiation caused by SOX11 overexpression in MCL may parallel the forced expression of PAX5 by the t(9;14)(p13;q32) translocation identified in some B-cell lymphomas,37-39 and the inactivating mutations of PRDM1 in diffuse large B-cell lymphomas.40-42
In summary, our study reveals the global transcriptional network and direct target genes regulated by SOX11 in MCL that may contribute to the development and aggressive behavior of this tumor. Our findings provide an improved understanding of the molecular mechanisms contributing to the pathogenesis of MCL and may have clinical implications in the diagnosis of patients and selection of therapeutic strategies more adapted to the molecular diversity of this tumor.
The online version of this article contains a data supplement.
There is an Inside Blood commentary on this article in this issue.
The publication costs of this article were defrayed in part by page charge payment. Therefore, and solely to indicate this fact, this article is hereby marked “advertisement” in accordance with 18 USC section 1734.
Acknowledgments
This work was supported by grants from the Ministerio de Economía y Competitividad (MINECO) (BFU2009-09235 and RYC-2006-002110) (V.A.), (RYC-2009-05134) (P.P.-G.), (SAF08/3630) (E.C.), and the Instituto de Salud Carlos III RTICC (2006RET2039) (E.C.), (PS09/00060) (G.R.), Fondo Europeo de Desarrollo Regional, Unión Europea, Una manera de hacer Europa.
Authorship
Contribution: M.C.V. performed the ChIP experiments; J.P. performed all in vitro experiments; P.P.-G. performed experiments with the MCL primary cases; G.R. performed the in vivo study supervising; A.M. and J.P. performed in vivo experiments; A.N. generated microarray data from MCL primary tumors; G.C. performed statistical analysis; S.B. provided information of the MCL patients; A.E. and H.S.-C. helped with the ChIP-chip experiments; P.J., G.C., and J.I.M.-S. helped with microarray data; L.H. and D.C. helped with the discussion; N.V. performed fold-change analysis; E.C. performed immunohistochemistry experiments, identified morphologically MCL tumors with PC differentiation, analyzed data, and supervised experiments; V.A. designed, performed, and supervised experiments, analyzed data, and wrote the manuscript; and all authors discussed the results and commented on the manuscript.
Conflict-of-interest disclosure: The authors declare no competing financial interests.
Correspondence: Virginia Amador, Centre Esther Koplowitz (CEK), C/Rosselló 153, Barcelona 08036, Spain; e-mail: vamador@clinic.ub.es.
References
Author notes
M.C.V. and J.P. contributed equally to this study.

This feature is available to Subscribers Only
Sign In or Create an Account Close Modal