Abstract
White adipose tissue (WAT) is the focus of new interest because of the presence of an abundant and complex immune cell population that is involved in key pathologies such as metabolic syndrome. Based on in vivo reconstitution assays, it is thought that these immune cells are derived from the bone marrow (BM). However, previous studies have shown that WAT exhibits specific hematopoietic activity exerted by an unknown subpopulation of cells. In the present study, we prospectively isolated a peculiar hematopoietic stem/progenitor cell population from murine WAT. The cells are phenotypically similar to BM hematopoietic stem cells and are able to differentiate into both myeloid and lymphoid lineages in vitro. In competitive repopulation assays in vivo, they reconstituted the innate immune compartment in WAT preferentially and more efficiently than BM cells, but did not reconstitute hematopoietic organs. They were also able to give rise to multilineage engraftment in both secondary recipients and in utero transplantation. Therefore, we propose that WAT hematopoietic cells constitute a population of immature cells that are able to renew innate immune cell populations. Considering the amount of WAT in adults, our results suggest that WAT hematopoietic activity controls WAT inflammatory processes and also supports innate immune responses in other organs.
Introduction
White adipose tissue (WAT) is present in large amounts at various locations in the body, comprising mature adipocytes and a stroma-vascular fraction (SVF) that accounts for more than half of the cells present in the tissue. Intriguingly, hematopoietic immune cells can comprise up to 40% of SVF in both mice and humans and thus represent almost 25% of the cells present in WAT. These proportions may vary according to the fat pad location and the presence of various pathologies.1,2 Among tissues in an adult organism, apart from hematopoietic organs such as the bone marrow (BM), thymus, and spleen, WAT is the only tissue containing such an abundant and complex population of hematopoietic cells. In most cases, these immune cells come from other sites, probably the BM via blood circulation.3,4
Several years ago, we proposed that a population of immature hematopoietic cells able to reconstitute lethally irradiated mice are located in WAT.5 This hypothesis is consistent with a recent report demonstrating that the bulk of stroma cells host immature hematopoietic cells.6 However, the aforementioned study was performed with a crude preparation of the heterogeneous SVF of WAT without prospective sorting of the cells exhibiting this hematopoietic activity. To begin to address this, we identified previously a c-Kit+/Lin−/Sca-1+ (KLS) cell population in WAT and showed that this sorted population could reconstitute the whole mast cell compartment in the WAT, intestine, and skin, but not in hematopoietic organs.7
In the present study, we further characterized this cell population by investigating whether prospectively isolated WAT-derived KLS cells may be considered true hematopoietic stem cells (HSCs), which are defined by their ability to self-renew and differentiate into all blood cell types. To answer this question, we performed complementary in vitro and in vivo experiments designed to demonstrate the functionality of these cells compared with BM-KLS cells, which are known to contain HSCs, and in vivo imaging. We showed that the WAT-KLS population not only contains peculiar hematopoietic stem/progenitor cells (HSPCs) that share common characteristics with BM-KLS cells, but also displays very unusual behavior in vivo. Indeed, when injected into adults in competition with BM cells, they did not seed in the BM or other hematopoietic organs, including lymph nodes (LNs) localized in adipose tissue. However, they reconstituted the innate immune compartment in WAT preferentially and more efficiently than BM cells. In addition, chimeric mice obtained after in utero or secondary transplantations exhibited multilineage donor cell engraftment. Therefore, the results of the present study suggest that innate immune cells resident in WAT are derived from a peculiar HSPC population localized inside this tissue.
Methods
Animals
Experiments were performed on 6- to 7-week-old male and female C57BL/6J mice (Harlan Laboratories) and congenic male C57BL/6J CD45.1 mice (Charles River Laboratories) or green fluorescent protein (GFP)–expressing mice [C57BL/6 TgN(act-EGFP)OsbC15-001-FJ001, kindly provided by Prof M. Okabe8 ]. Animals were housed in a controlled environment (12-hour light/dark cycles at 21°C) with unrestricted access to water and a standard chow diet (UAR). Before removal of tissues, mice were killed by CO2 inhalation. All experimental procedures were done in compliance with French Ministry of Agriculture regulations for animal experimentation.
Competitive repopulation assays
Competitive repopulation assays were conducted as described previously.9 Briefly, 103 c-Kit+/Lin−/Sca-1+ (KLS) cells sorted from the WAT or BM of donor CD45.1+ or GFP+ mice were mixed with 2 × 10⁵ competitor CD45.2 BM cells. The mixed population was IV injected into lethally irradiated (10 Gy, 137Cs source) recipient CD45.2 mice. Peripheral blood (PB), BM, spleen, thymus, LNs, and WAT were analyzed 4 months after transplantation by flow cytometry for CD45.1 cells (level of long-term engraftment) and multiple lineages on a FACSCanto II flow cytometer (BD Biosciences) as described previously.7
KLS cells were sorted from WAT of primary recipients at times up to 4 months after transplantation and injected via the retroorbital sinus into lethally irradiated secondary recipients (10 Gy) with the same protocol as primary grafts. The recipient mice expressed CD45.2 and engraftment and the phenotype of CD45.1 cells were determined by flow cytometry.
In utero WAT-KLS transplantation
Cohorts of adult C57BL/6 CD45.2 mice were mated overnight and separated the next morning, a time designated as day 0. On day 13 after mating, pregnant dams were kept asleep under isoflurane gas. Under aseptic conditions, donor cells were injected with a Hamilton syringe into the liver of each fetus under direct visualization. The injection consisted of 2 × 10⁴ sorted CD45.1 WAT-KLS cells in a maximum volume of 5 μL of PBS. The abdominal incision was closed up and the mice were allowed to complete pregnancy. Eight weeks after birth, PB, BM, spleen, thymus, and WAT were removed from each pup, cells were isolated (see next paragraph), and analyzed by flow cytometry for the expression of CD45.1.
Isolation of WAT, spleen, thymus, ganglion, and BM cells
Animals were anesthetized with ketamine (100 mg/kg) and xylazine (10 mg/kg) and PB was obtained from the heart ventricle. BM cells were flushed from the femurs with α-MEM medium (Invitrogen). Spleens, thymi, inguinal WAT, and LNs were carefully dissected and mechanically dissociated. WAT fragments were digested at 37°C with collagenase (Roche Diagnostics) for 30 minutes. After elimination of undigested fragments by filtration (25 μm), cells were collected by centrifugation at 630g for 10 minutes. The pellet, defined as the SVF, and the PB, BM, and spleen cells were then incubated for 5 minutes in hemolysis buffer (140mM NH4Cl and 20mM Tris, pH 7.6) to eliminate RBCs and washed by centrifugation in PBS. Cells were counted and used for flow cytometric analysis or sorted before plating or engraftment.
Flow cytometric analysis and cell sorting
Flow cytometry was used to characterize hematopoietic subpopulations. Freshly isolated SVF or BM cells were stained in PBS containing FcR-blocking reagent. Phenotyping was performed by immunostaining with conjugated rat anti–mouse mAbs and comparing with isotype-matched control mAb (BD Biosciences) unless indicated and listed in supplemental Table 1 (available on the Blood Web site; see the Supplemental Materials link at the top of the online article). Cells were washed in PBS and analyzed on a FACSCanto II flow cytometer (BD Biosciences). Data acquisition and analysis were performed using FACSDiva Version 6.3 software (BD Biosciences) or FlowJo Version 7.5 software (TreeStar).
For KSL cell-sorting experiments, BM and WAT cells were stained with allophycocyanin-conjugated lineage markers that included Ly-6G/Ly-6C (Gr-1), CD11b (Mac-1), CD45R/B220, CD3ϵ, and Ter119/Ly76. The cells were also stained with FITC-conjugated Ly-6A/E (Sca-1) and PE-Cy7–conjugated CD117 (c-Kit) Abs. Cells negative for lineage markers were gated, and Sca-1 and CD117 double-positive cells were sorted (FACSAria II; BD Biosciences). The degree of the enrichment of KLS cells was then determined by flow cytometry.
In vivo imaging
To assess the GFP+ cell distribution within the femurs, spleens, and WAT, WAT-GFP+ KLS-reconstituted mice were killed 1 month after injection and confocal endoscopy was performed to visualize the topological distribution of hematopoietic GFP+ cells. An S-300 microprobe was introduced into femurs and an S-1500 macroprobe was passed up at the surface of soft tissues as described previously.10 Video data acquisition and analyses were performed with the CellVizio 488 system and Image Cell Version 3.8 software (Mauna Kea Technologies).
In vitro experiments
For long-term culture (LTC), WAT-KLS or BM-KLS cells were plated on an MS5 feeder layer at 4 × 10⁴ cells/mL and 4 × 10³ cells/mL, respectively, in Myelocult medium supplemented with 10−6 M hydrocortisone (StemCell Technologies). After 5 weeks, cells were plated at 1.5 × 10⁴ cells/mL in methylcellulose containing SCF (50 ng/mL), IL-3 (10 ng/mL), IL-6 (10 ng/mL), and erythropoietin (3 U/mL; Methocult M3434; StemCell Technologies) for 14 days before assessment of colony number. Representative colonies were then individually removed from methylcellulose and examined using May-Grünwald-Giemsa staining.
OP9-DL1 and OP9-control cells were obtained from J. C. Zúñiga-Pflücker (University of Toronto, Toronto, ON).11 OP9 cells were cultured with α-MEM supplemented with 20% FBS and 2.2 g/L of sodium carbonate. WAT-KLS and BM-KLS cells (15 × 103) were cultured on OP9-control or OP9-DL1 cell monolayers (60%-70% confluence) in 6-well plates in the presence of exogenous FMS-like tyrosine kinase receptor-3 ligand (5 ng/mL) and IL-7 (5 ng/mL; R&D Systems) for 2 weeks. Every 4 days, the nonadherent cells were collected by pipetting and replated on fresh OP9 monolayers in OP9 media. Cells were removed at each time point for analysis by flow cytometry.
RT-PCR
Total RNA from sorted WAT-KLS and BM-KLS cells was prepared using the RNeasy Plus microkit (QIAGEN) according to the manufacturer's recommendations. RNA concentration and integrity were evaluated using a model 2100 bioanalyzer (Agilent Biotechnologies). Total RNA (500 pg) was amplified using the Ovation Pico WTA System (NuGEN Technologies) following the manufacturer's instructions.
Expression levels of GATA-1/-2/-3, Runx1, SCL/Tal1, FOG1, PU.1, and C/EBPα were analyzed by real-time PCR with a StepOne Real-Time PCR system (Life Technologies/Applied Biosystems). Briefly, 10 ng of amplified cDNA was analyzed in a final volume of 20 μL using the Power SYBRGreen master mix (Life Technologies/Applied Biosystems) with primers at a 0.3μM final concentration (supplemental Table 2); quantitative RT-PCR conditions were 10 minutes at 95°C, 40 cycles of 15 seconds at 95°C, and 1 minute at 60°C.
Statistical analyses
Comparisons were made between groups using the unpaired Mann-Whitney test. Data are presented as means ± SEM. Statistical significance was defined as P < .05, P < .01, and P < .001.
Results
WAT-KLS and BM-KLS cells exhibit similar marker expression profiles
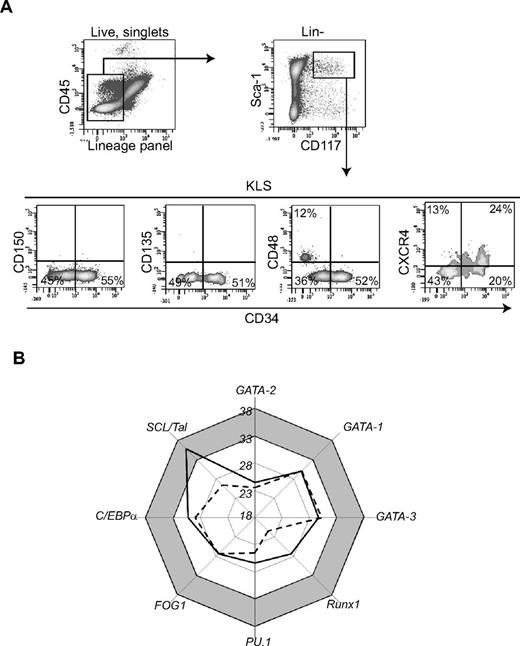
We analyzed the phenotype of WAT-KLS cells identified by cell surface markers c-Kit+/Lin−/Sca-1+ (Figure 1A) as described previously7 for their expression of the murine long-term HSC (LT-HSC), short-term-HSC (ST-HSC), and multipotent progenitor (MPP) markers used for BM HSC phenotyping.12 As in the BM, the WAT-KLS compartment can be divided into 2 distinct subsets based on differential expression of CD34 (Figure 1A). We found no expression of CD150 or CD135 (flk2) in either the CD34+ or the CD34− cell populations. Interestingly, 25% of the KLS CD34− cells (known to be enriched in HSCs in the BM) expressed the CD48 marker representing a more mature HSC population. Therefore, whereas BM LT-HSCs are known to be KLS/CD34-/CD48−/CD150+ cells, WAT-KLS/CD34− cells that do not express CD48 were negative for CD150, suggesting an intermediate stage in the LT-HSC population. Moreover, WAT-KLS/CD34+ cells did not express CD135 (known as a marker of MPP population). A low level of CXCR4 expression was found on both the CD34+ and CD34− cell subsets (Figure 1A). Therefore, our data showed that the CD34− subset of WAT-KLS cells exhibits a phenotype close to that of BM-KLS cells (supplemental Figure 1).
Characterization of WAT-KLS cells. (A) Five-color flow cytometry analyses were performed on KLS cells (gated on singlet, viable c-Kit+/Lin−/Sca-1+). Dot plots are representative of 6-7 independent experiments. (B) Expression of transcription factors involved in hematopoietic commitment was measured by quantitative RT-PCR performed on sorted WAT-KLS cells (solid line) and BM-KLS cells (dotted line). Mean Ct values of 4-6 independent samples are plotted on the graph. Transcription factors with Ct values greater than 33 (gray zone) are considered to be nonexpressed in the cell population.
Characterization of WAT-KLS cells. (A) Five-color flow cytometry analyses were performed on KLS cells (gated on singlet, viable c-Kit+/Lin−/Sca-1+). Dot plots are representative of 6-7 independent experiments. (B) Expression of transcription factors involved in hematopoietic commitment was measured by quantitative RT-PCR performed on sorted WAT-KLS cells (solid line) and BM-KLS cells (dotted line). Mean Ct values of 4-6 independent samples are plotted on the graph. Transcription factors with Ct values greater than 33 (gray zone) are considered to be nonexpressed in the cell population.
WAT-KLS and BM-KLS cells were analyzed by quantitative RT-PCR for their expression profiles of transcription factors involved in hematopoietic commitment. Among the earliest transcription factors analyzed, Runx-1 and GATA-2 were amplified, with Ct values less than 28, demonstrating that these 2 transcription factors were expressed in WAT-KLS and in BM-KLS cells (Figure 1B); this is in contrast to SCL/Tal1, which was expressed only in BM-KLS cells (Ct value greater than 33 in WAT-KLS cells). In addition, transcription factors required for myeloid commitment, such as GATA-1, FOG1, PU.1, and C/EBPα, and for lymphoid lineage differentiation, such as GATA-3, were also amplified, with Ct values ranging from 23-33, showing that they were expressed in both WAT-KLS and BM-KLS cells (Figure 1B). Whereas SCL/Tal1 and, to a lesser extent Runx-1, factors that are dispensable for the survival and self-renewal of HSCs, were differentially expressed in WAT-KLS and BM-KLS cells, our results indicate that WAT-KLS cells have a transcription profile similar to that of BM-KLS cells.
WAT-KLS cells differentiate into both myeloid and lymphoid cells
KLS cells were sorted from inguinal WAT or BM based on the expression of cell surface markers (c-Kit+/Lin−/Sca-1+), as described previously.7
To assess the myeloid potential of WAT-KLS cells, we performed long-term culture assays with sorted WAT-KLS or BM-KLS cells (a positive control) on MS5 cells as a feeder layer.7 Myeloid colonies were obtained with both cell types, confirming our previous results.7 However, the frequency of colonies obtained after culture of WAT-KLS cells was 5 times lower (21% ± 0.036%; P = .0002) than BM-KLS long-term cultures (supplemental Figure 2A). Percentages of mast cell colonies and myeloid colonies were similar in both cultures, accounting for 40% and 60% of the total colonies, respectively (supplemental Figure 2B-C).
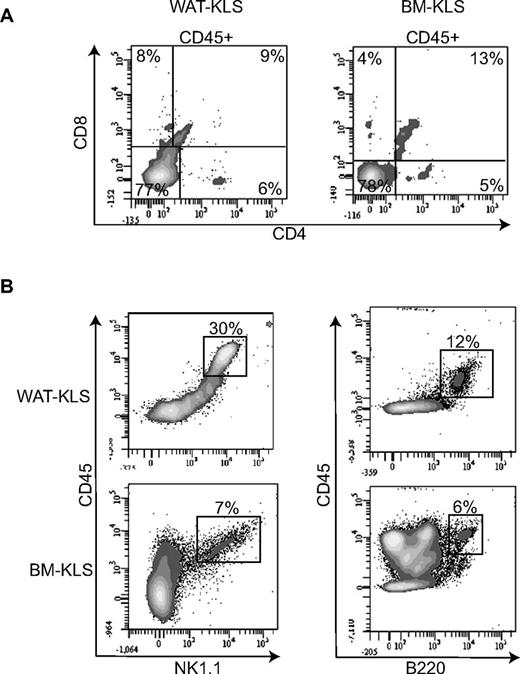
To establish the capacity of WAT-KLS cells to differentiate in lymphoid cells, we used an in vitro T-cell differentiation system established by Dr Zuniga-Pflucker in which BM progenitor cells were cultured on OP9 stromal cells expressing the Notch ligand Delta-like 1 (OP9-DL1).11 We cultured WAT-KLS and BM-KLS cells on OP9-control or OP9-DL1 feeder layers. Similar to BM-KLS cells, WAT-KLS cells cultured on OP9-DL1 cells for 14 days differentiated into a double-positive CD4+/CD8+ population and single-positive CD4+ or CD8+ lymphocytes (Figure 2A), as described previously.11 On the OP9 feeder layer, WAT-KLS and BM-KLS cells differentiated into cells expressing NK1.1 or B220 (Figure 2B). These results demonstrate the propensity of WAT-KLS cells to differentiate into both myeloid and lymphoid lineages.
Lymphoid differentiation of WAT-KLS cells. WAT-KLS or BM-KLS cells were seeded onto a stromal feeder layer of OP9-DL1 (A) or OP9 (B) cells in the presence of the appropriate cytokines. After 14 days, cells were harvested and analyzed by flow cytometry. Dot plots are representative of 4 independent experiments.
Lymphoid differentiation of WAT-KLS cells. WAT-KLS or BM-KLS cells were seeded onto a stromal feeder layer of OP9-DL1 (A) or OP9 (B) cells in the presence of the appropriate cytokines. After 14 days, cells were harvested and analyzed by flow cytometry. Dot plots are representative of 4 independent experiments.
In vivo transplantation of WAT-KLS cells reveals a tissue-specific engraftment
For in vivo competitive transplantations, WAT-KLS or BM-KLS cells were isolated from CD45.1 mice and were mixed with aged-matched congenic CD45.2 total BM cells (103 KLS cells + 2.105 BM cells).
Mice transplanted with WAT-KLS or BM-KLS cells exhibited similar long-term survival (70% vs 72%, respectively). Four months after transplantation with WAT-KLS or BM-KLS cells, the total BM and WAT cellularity was similar in both repopulated mice groups, as was the proportion of hematopoietic cells and the KLS cell total number in BM (Table 1). In contrast, their proportion in the WAT was significantly lower in mice reconstituted with BM-KLS compared with WAT-KLS cells (Table 1).
BM and WAT cellularity in mice repopulated with WAT-KLS or BM-KLS
| . | Total cell no., ×106 . | Percentage of CD45+ cells, % of total cells . | Percentage of CD45.1+ cells, % of CD45+ cells . | Absolute no. of KLS cells, ×104 . | ||||
|---|---|---|---|---|---|---|---|---|
| BM . | WAT . | BM . | WAT . | BM . | WAT . | BM . | WAT . | |
| WAT-KLS–repopulated mice | 9.69 ± 1.71 | 1.36 ± 0.14 | 84.86 ± 1.80 | 64.66 ± 4.27 | 0.94 ± 0.2 | 33.6 ± 4.8 | 2.5 ± 0.4 | 2.4 ± 0.6 |
| BM-KLS–repopulated mice | 7.16 ± 1.03 | 1.32 ± 0.24 | 84.39 ± 1.66 | 43.98 ± 5.39* | 24 ± 6.6† | 30.75 ± 5.7 | 2.1 ± 0.7 | 0.48 ± 0.01‡ |
Lethally irradiated CD45.2 mice were intravenously injected with 103 CD45.1 WAT-KLS or BM-KLS cells together with 2.105 CD45.2 total BM cells. Four months after injection, BM and WAT were removed and total BM and SVF cells were prepared as described in “Isolation of WAT, spleen, thymus, ganglion, and BM cells.” The total cell number was quantified by cell counting and CD45+ and KLS cell numbers were estimated by flow cytometry. Results are expressed as means ± SEM of 7 independent experiments.
P < .001.
P < .0001 in WAT-KLS– versus BM-KLS–repopulated mice.
P < .05.
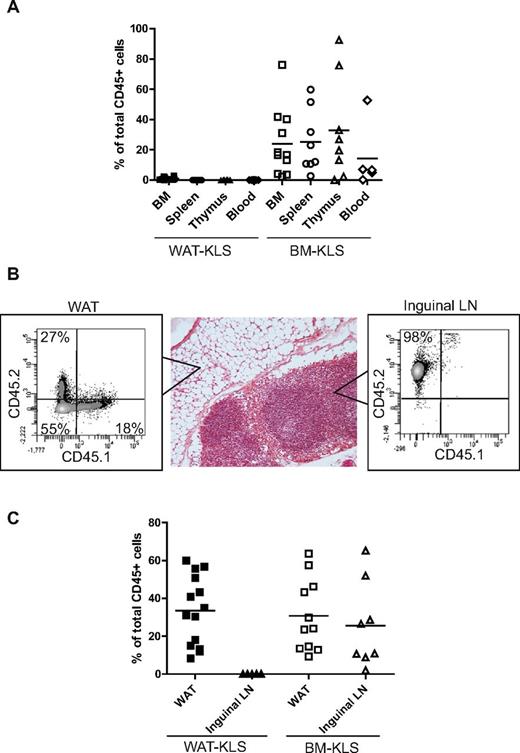
Four months after transplantation, the percentage of CD45.1 donor cells was assessed by flow cytometry in hematopoietic organs such as the BM, spleen, and thymus, and in inguinal WAT and LNs, as well as in the PB. In the BM, spleen, thymus, and PB, no or very weak chimerism was observed after WAT-KLS transplantation compared with BM-KLS transplantation (Figure 3A). Interestingly, WAT-KLS cells were able to reconstitute the hematopoietic compartment of inguinal WAT as BM-KLS cells did, but not the inguinal LN tissue, suggesting that WAT-KLS might home in a preferential WAT niche (Figure 3B-C).
Quantification of chimerism after reconstitution of lethally irradiated mice. Lethally irradiated CD45.2 mice were coinjected with 103 sorted KLS cells isolated from either the WAT or BM of CD45.1 mice and 2.105 total BM cells were harvested from CD45.2 mice. Total chimerism was quantified in hematopoietic organs and peripheral blood (A) and in WAT and inguinal LNs (B-C) in primary recipients 4 months after injection. Chimerism was expressed as a percentage of CD45.1+ cells belonging from WAT-KLS cells (black symbols) or BM-KLS cells (open symbols) of total CD45+ cells in each organ. Dot plots are representative of 6-8 independent experiments.
Quantification of chimerism after reconstitution of lethally irradiated mice. Lethally irradiated CD45.2 mice were coinjected with 103 sorted KLS cells isolated from either the WAT or BM of CD45.1 mice and 2.105 total BM cells were harvested from CD45.2 mice. Total chimerism was quantified in hematopoietic organs and peripheral blood (A) and in WAT and inguinal LNs (B-C) in primary recipients 4 months after injection. Chimerism was expressed as a percentage of CD45.1+ cells belonging from WAT-KLS cells (black symbols) or BM-KLS cells (open symbols) of total CD45+ cells in each organ. Dot plots are representative of 6-8 independent experiments.
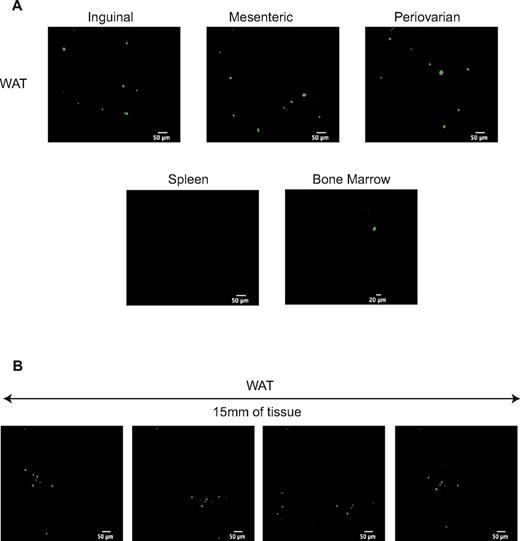
We performed in vivo imaging 1 month after transplantation of 103 WAT-KLS cells expressing GFP and 2.105 non-GFP total BM cells. GFP+ cells were observed in all adipose deposits (ie, inguinal, mesenteric, and periovarian), but not in the hematopoietic tissues (ie, the BM and spleen; Figure 4A), strengthening a preferential tropism of WAT-KLS cells for adipose tissues. Moreover, GFP+ hematopoietic cells derived from injected WAT-KLS cells were found in clusters along the 15 mm of WAT observed with the confocal macroprobe (Figure 4B), suggesting a specific topological organization of hematopoietic cells in WAT.
In vivo cell imaging of immune cells derived from WAT-KLS cells. 1000 GFP+ WAT-KLS cells were IV coinjected with 2.105 GFP− total BM cells into lethally irradiated CD45.2 syngenic mice. One month after injection, videos of intrafemoral BM, spleen, and WAT were performed to track GFP+ cells. (A) Frames of 20-35-second videos acquired at the surface of these organs (spleen and WAT) or inside the length of the femur showing the GFP+ cells observed. Results are representative of 3 independent animals. (B) Successive pictures of 15 mm of WAT observed with the confocal macroprobe.
In vivo cell imaging of immune cells derived from WAT-KLS cells. 1000 GFP+ WAT-KLS cells were IV coinjected with 2.105 GFP− total BM cells into lethally irradiated CD45.2 syngenic mice. One month after injection, videos of intrafemoral BM, spleen, and WAT were performed to track GFP+ cells. (A) Frames of 20-35-second videos acquired at the surface of these organs (spleen and WAT) or inside the length of the femur showing the GFP+ cells observed. Results are representative of 3 independent animals. (B) Successive pictures of 15 mm of WAT observed with the confocal macroprobe.
Transplanted WAT-KLS cells preferentially differentiated into NK and myeloid cells in vivo
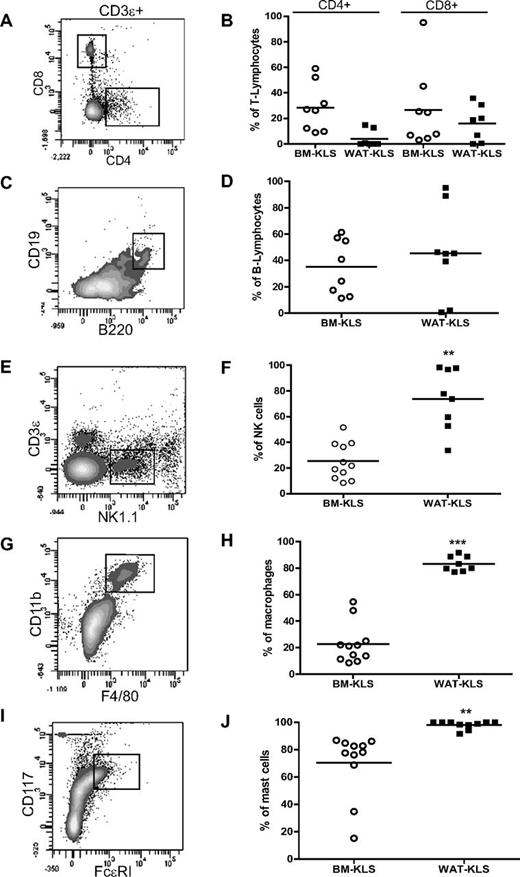
The nature of CD45.1+ cells was then analyzed in inguinal WAT of WAT-KLS transplanted mice by flow cytometry. WAT-KLS cells were able to differentiate in vivo into hematopoietic cells of both lymphoid and myeloid lineages, including CD4+ or CD8+ mature T-lymphocytes (Figure 5A) and B-lymphocytes (Figure 5C), mature natural killer (NK) cells (Figure 5E), macrophages (Figure 5G), and mast cells (Figure 5I). Interestingly, the efficiency of WAT-KLS cells to differentiate toward NK and myeloid cells was higher than their efficiency toward T and B lymphocytes. Almost 70% of NK cells (Figure 5F) and 100% of macrophages (Figure 5H) and mast cells (Figure 5J) in WAT were derived from WAT-KLS cells, in contrast to the lymphocyte population, which exhibited 5% and 40% chimerism, respectively (Figure 5B,D). These results show that WAT-KLS cells are capable of multilineage reconstitution in their tissue of origin, with a higher efficiency toward NK and myeloid cells.
Quantification of chimerism in mature immune cells in WAT after reconstitution of lethally irradiated mice. Lethally irradiated CD45.2 mice were coinjected with 103 CD45.1+ KLS cells sorted from WAT (black symbols) or BM (open symbols) and 2.105 total BM cells isolated from CD45.2 mice. Four months after transplantation, T lymphocytes (CD4+ or CD8+ gated on CD3ϵ+; A), B lymphocytes (CD19+/B220+; C), NK cells (NK1.1+/CD3ϵ−; E), macrophages (CD11b+/F4/80+; G), and mast cells (FcϵRI+/CD117+; I) in WAT were identified by flow cytometry, and the proportion of CD45.1+ cells was analyzed in each population (B, D, F, H, and J). Dot plots are representative of 6-8 independent experiments.
Quantification of chimerism in mature immune cells in WAT after reconstitution of lethally irradiated mice. Lethally irradiated CD45.2 mice were coinjected with 103 CD45.1+ KLS cells sorted from WAT (black symbols) or BM (open symbols) and 2.105 total BM cells isolated from CD45.2 mice. Four months after transplantation, T lymphocytes (CD4+ or CD8+ gated on CD3ϵ+; A), B lymphocytes (CD19+/B220+; C), NK cells (NK1.1+/CD3ϵ−; E), macrophages (CD11b+/F4/80+; G), and mast cells (FcϵRI+/CD117+; I) in WAT were identified by flow cytometry, and the proportion of CD45.1+ cells was analyzed in each population (B, D, F, H, and J). Dot plots are representative of 6-8 independent experiments.
Tissue-specific self-renewal activity of WAT-KLS cells
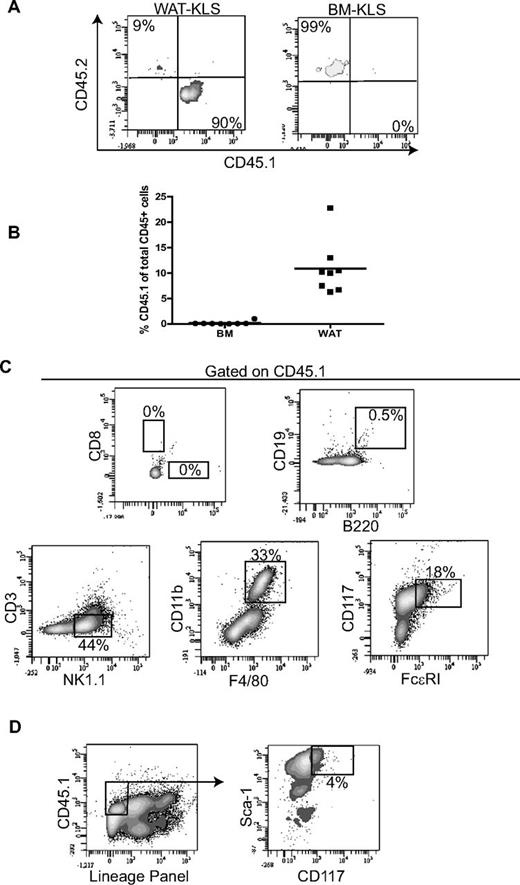
We also determined the self-renewal capacity of WAT-KLS cells by secondary transplantation of WAT-KLS cells obtained from primary recipient mice reconstituted with WAT-KLS. In these primary recipient mice, 90% of WAT-KLS cells expressed CD45.1; this was in contrast to BM-KLS, which were CD45.2+ (Figure 6A).
Self-renewal activity. (A) Determination of the origin of WAT-KLS and BM-KLS cells in primary recipients transplanted with WAT-KLS cells. Representative dot plots show that WAT-KLS cells were able to reconstitute the KLS cell population present in WAT but not in the BM. (B) Total chimerism quantified in WAT and BM in secondary recipients after coinjection of 103 KLS cells sorted from the WAT of primary recipients and 2.105 total BM cells. CD45.1+ cells (donor origin) present in WAT were analyzed by flow cytometry to identify mature immune cells (C) such as T lymphocytes (CD4+ or CD8+), B lymphocytes (CD19+/B220+), NK cells (NK1.1+/CD3ϵ−), macrophages (CD11b+/F4/80+), mast cells (FcϵRI+/CD117+), or KLS cells (D). Dot plots are representative of 8 independent experiments and quantifications are expressed as a percentage of CD45.1+ cells.
Self-renewal activity. (A) Determination of the origin of WAT-KLS and BM-KLS cells in primary recipients transplanted with WAT-KLS cells. Representative dot plots show that WAT-KLS cells were able to reconstitute the KLS cell population present in WAT but not in the BM. (B) Total chimerism quantified in WAT and BM in secondary recipients after coinjection of 103 KLS cells sorted from the WAT of primary recipients and 2.105 total BM cells. CD45.1+ cells (donor origin) present in WAT were analyzed by flow cytometry to identify mature immune cells (C) such as T lymphocytes (CD4+ or CD8+), B lymphocytes (CD19+/B220+), NK cells (NK1.1+/CD3ϵ−), macrophages (CD11b+/F4/80+), mast cells (FcϵRI+/CD117+), or KLS cells (D). Dot plots are representative of 8 independent experiments and quantifications are expressed as a percentage of CD45.1+ cells.
Total KLS cells were sorted from WAT of primary recipient mice independently of CD45.1 expression and coinjected with CD45.2+ BM cells into lethally irradiated secondary recipient mice using the same procedure as for primary grafts (103 KLS cells + 2.105 total BM cells). Although the percentage of CD45.1+ cells in the WAT of secondary recipient mice was lower than that in the WAT of primary recipients, CD45.1 chimerism was found in the WAT but not in the BM (Figure 6B), reinforcing a specific pattern of tissue engraftment by WAT-KLS cells. WAT of the secondary recipient mice was reconstituted with CD45.1+-expressing NK cells, macrophages, and mast cells, but not lymphocytes (Figure 6C). In addition, KLS/CD45.1+ cells were also found in the WAT of secondary recipients (Figure 6D). These results indicate that some WAT-KLS subpopulations exhibit a self-renewal activity, and that these cells are not only prone to differentiate toward NK cells and myeloid lineages, but also to renew the KLS cell pool in WAT.
In utero WAT-KLS transplantation
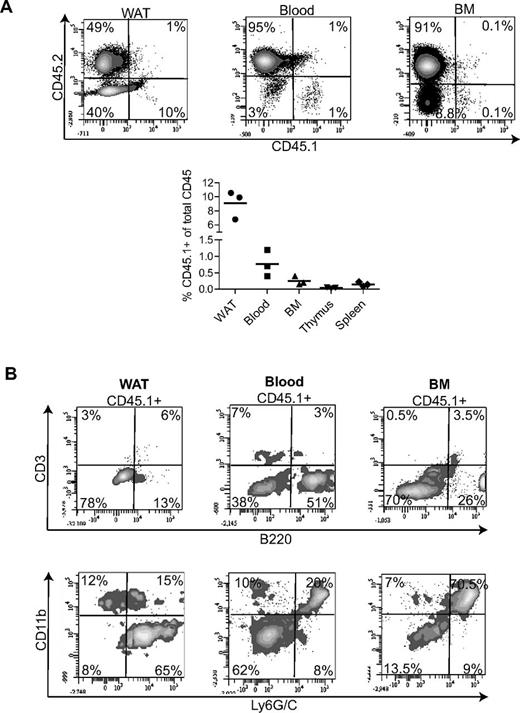
Finally, we performed intrafetal liver transplantation of WAT-KLS to determine the multilineage engraftment of these cells in an embryonic microenvironment. Sorted CD45.1+ WAT-KLS cells were injected in utero into the livers of CD45.2 embryos at embryonic day 13 as described previously.13 Two months after birth, CD45.1+ cells were found in the WAT (10%) and in the blood (1%) and BM (0.1%; Figure 7A top and bottom panels). In contrast, no or very few CD45.1+ cells were found in the thymus and spleen (Figure 7A bottom panel).
In utero WAT-KLS cells transplantation. Liver transplantation of 2 × 10⁴ WAT-KLS cells was performed in utero in embryos at embryonic day 13. Total chimerism was quantified in the WAT, blood, BM, thymus, and spleen 2 months after birth (A). Percentage of total cells expressing either the donor (CD45.1) or the host (CD45.2) cell marker. (B) Analysis of mature immune cells in the CD45.1+ population by flow cytometry. The percentages of CD45.1+ cells expressing lineage markers are indicated. Dot plots are representative of 3 independent animals.
In utero WAT-KLS cells transplantation. Liver transplantation of 2 × 10⁴ WAT-KLS cells was performed in utero in embryos at embryonic day 13. Total chimerism was quantified in the WAT, blood, BM, thymus, and spleen 2 months after birth (A). Percentage of total cells expressing either the donor (CD45.1) or the host (CD45.2) cell marker. (B) Analysis of mature immune cells in the CD45.1+ population by flow cytometry. The percentages of CD45.1+ cells expressing lineage markers are indicated. Dot plots are representative of 3 independent animals.
In WAT, CD45.1+ cells were found to be mainly B lymphocytes (B220+) and myeloid cells (CD11b+ and/or Ly6G/C+), as observed after transplantation in adult irradiated recipient mice (Figure 3 and Figure 7B). Interestingly, in blood and BM, CD45.1+ cells were also found to be mainly B lymphocytes and myeloid cells, although some blood T lymphocytes were identified (Figure 7B). These results suggest that in the context of embryonic development, WAT-KLS cells might participate efficiently in the constitution of the mature immune cell pool in WAT, but also in the PB and BM.
Discussion
Previous studies have indicated that WAT may exhibit hematopoietic activity, but the cells supporting such activity have never been fully characterized.5,6 In the present study, we demonstrate that an HSPC population can be prospectively isolated from murine WAT and that this population exhibits both common and specific characteristics compared with BM-KLS. Indeed, WAT-KLS cells present a phenotype similar to medullar HSCs in that they are able to repopulate all of the major lineages in vivo in long-term reconstitution assays in accordance with the transcription factors involved in hematopoietic commitment they express. Intriguingly, in vivo, WAT-KLS cells give rise to multilineage engraftment in the WAT of primary and secondary adult recipients, where they are more efficient than BM-KLS cells in reconstituting NK and myeloid lineages, but not in PB or hematopoietic organs such as the BM, spleen, thymus, or even LNs localized in WAT. The contribution of WAT-KLS cells to steady-state adult hematopoiesis is confirmed by in utero transplantation demonstrating donor cell engraftment in WAT, but also to a lesser extent in the PB and BM.
Immunophenotypical comparison with BM-KLS cells shows that WAT-KLS cells are a mixed population of stem/progenitor cells with an intermediate phenotype between LT-HSCs, ST-HSCs, and MPPs. The identification of a KLS subset CD34−/CD48− suggests the presence in WAT of cells at the top of the HSC hierarchy12 ; however, the absence of CD150 expression on this subset suggests that these cells may have limited self-renewal activity,14,15 which is in accordance with the decreased engraftment level generated by WAT-KLS cells in secondary transplantations. Conversely, the identification of CD34 on some WAT-KLS cells could be the signature of self-renewing HSCs12,16 but may also depend on the developmental stage of the mouse.17 Therefore, this phenotypic analysis does not allow conclusions on the nature of WAT-KLS cells.
The WAT-KLS phenotype is linked to specific functional properties such as high differentiation potential toward innate immune cells and high engraftment in WAT. In adult WAT, WAT-KLS cells exhibit significantly higher differentiation efficiency toward myeloid lineages (15-fold difference) and NK cells (60-fold difference) than do BM-KLS cells. After in utero transplantation in WAT and BM, the majority of donor-derived cells expressed myeloid markers. A recent study in humans suggesting that NK cells can be derived from the myeloid lineage18 could explain the surprising differentiation potential of WAT-KLS cells toward innate immune cells in WAT seen herein. Similar myeloid-biased HSC populations have been reported previously in the BM.19,20
According to these phenotypic and functional features, we propose that WAT harbors a peculiar population of HSPCs that is different from BM-KLS cells and exhibits very specific behavior in vivo. In addition, in adults, WAT-KLS cells do not contribute to the reconstitution of the BM and other hematopoietic organs, as demonstrated by the absence of significant chimerism in these organs and the decrease in total cell number in the BM of WAT-KLS cell–reconstituted mice. In contrast, BM-KLS cells can reconstitute the hematopoietic compartment, but not the absolute number of KLS, in WAT, again suggesting that BM-KLS and WAT-KLS cells are not interchangeable. This ability of BM-KLS cells to generate WAT immune cells has been demonstrated by injecting BM cells into lethally irradiated mice, and has led several investigators to conclude that the hematopoietic cells present in WAT are derived from the BM.4,21 These conclusions must now be reconsidered taking into account, as described herein, the presence of the peculiar HSPC population in WAT. Indeed, using similar approaches to those just described for the BM, we clearly show that WAT-KLS cells can very efficiently reconstitute NK and myeloid populations within WAT, even though they are injected in competition with BM-KLS. Therefore, innate immune cells present in WAT may be renewed in situ via WAT HSPC differentiation. This hypothesis is strengthened by the engraftment observed in adults after in utero WAT-KLS transplantation, which demonstrates that these cells contribute to adult hematopoiesis and do not constitute an embryonic remnant of hematopoiesis. When transplanted in a microenvironment that readily supports the engraftment of donor HSCs, WAT-KLS cells and/or their progenitors are capable of residing in this microenvironment, proliferating and reconstituting not only WAT but also PB and BM, although with a relative low frequency. The frequency of chimerism in other reported studies of murine in utero transplantation varies significantly and depends on the functional characteristics of both the donor and the recipient.13,22-24 However, our present results suggest that, in the fetal liver environment, some signals could maintain and/or confer homing or differentiation potentials to WAT-KLS cells.
The presence of HSPCs in WAT is not so surprising considering the microenvironment provided by WAT. Indeed, in addition to mature adipocytes, WAT contains numerous stromal cells that can support myeloid and lymphoid differentiation in vitro and HSC engraftment in vivo.25-28 In addition, WAT constitutively expresses and secretes cytokines such as CXC-chemokine ligand 12 (CXCL12; SDF1) and adhesion molecules such as endothelial-cell selectin29-32 that are important for HSC mobilization, homing, and engraftment.33 One of the next challenges will be to determine whether WAT-KLS and BM-KLS cells differ in their intrinsic functional properties or whether these populations exhibit distinct heritable functional characteristics as a consequence of the specific microenvironments they seed.
In conclusion, the results of the present study demonstrate the prospective identification in WAT of a peculiar HSPC population that may contribute to the production of innate immune cells present in WAT. Because this tissue is abundant and present in multiple anatomical sites (especially close to epithelial surfaces), our results suggest that WAT hematopoietic activity not only controls WAT inflammatory processes, but also supports innate immune responses in other organs. Future experiments will be aimed at validating these propositions.
The online version of this article contains a data supplement.
The publication costs of this article were defrayed in part by page charge payment. Therefore, and solely to indicate this fact, this article is hereby marked “advertisement” in accordance with 18 USC section 1734.
Acknowledgments
The authors thank the technicians of Unité Mixte de Service 006 (Toulouse, France) and C. Evra for animal care; the flow cytometry core facility of Unité Mixte de Recherche 1043 (Toulouse, France) for cell sorting; C. Lastrucci, P. Guillou, and A. Balguerie for technical help; and F. Delarue and M. Healey for careful editing of the manuscript.
This work was supported in part by the Agence Nationale de la Recherche (ANR-08- BLAN-0324-04) and grants from the Ligue Nationale contre le Cancer.
Authorship
Contribution: S.P., F.D.T., D.L., A.M., E.A., and V.B. performed the research, collected, analyzed, and interpreted the data, and performed the statistical analysis; P.L. and L.C. analyzed and interpreted the data and edited the manuscript; and B.C. designed and performed the research, analyzed and interpreted the data, and wrote the manuscript.
Conflict-of-interest disclosure: The authors declare no competing financial interests.
The current affiliation for S.P. is Laboratoire des cellules Souches Hématopoïétiques et Leucémiques, Inserm U967, Institut de Radiobiologie Cellulaire et Moléculaire, Commissariat à l'Énergie Atomique, Direction des Sciences du Vivant, Fontenay-aux-Roses, France.
Correspondence: Beatrice Cousin, STROMALab, UMR 5273 CNRS/UPS/EFS-Inserm U1031, CHU Rangueil, 1 Avenue J. Poulhès, 31400 Toulouse, France; e-mail: beatrice.cousin@inserm.fr.

