Abstract
Abstract 3049
Graft-versus-host-disease (GvHD) remains one of the major complications post allogeneic hematopoietic stem cell transplantation (HSCT) which is still the only curative treatment for hematologic malignancies and non-malignant hematopoietic disorders. Early detection of developing GvHD prior to clinical manifestation is in the focus of research in order to optimize therapeutic approaches and possibly lower transplant related morbidity and mortality. We previously published proteomic patterns in urine generated by capillary electrophoresis coupled on-line to mass spectrometry (CE-MS) allowing early detection of acute GvHD onset (Weissinger et al., 2007; Weissinger et al., 2009). In an effort to compare our CE-MS results to other proteomic approaches and to contribute to harmonization of results generated by different laboratories, we analyze biomarkers detected in urine as well as those described by others using proteomic approaches such as ELISA and Bio-Luminex in plasma collected from the same patients analyzed by CE-MS. We aim to (1) compare the predictive value of the proteomic pattern with other methods and (2) evaluate these methods for early diagnosis of GvHD.
We established an urine/plasma sample bank from patients transplanted since 2006 at MHH; of this four patient groups were chosen to set up the methods for monitoring emerging GvHD on the basis of plasma-biomarkers: patients at onset of aGvHD (aGvHD, n=20), patients at similar time-points early post HSCT without aGvHD (con_aGvHD, n=14), patients at diagnosis of cGvHD (cGvHD, n=13) and patients without GvHD (>day +100; con_cGvHD, n=33). For Bio-Luminex analysis, the angiogenesis marker panel was used (Luft et al., 2011), including: G-CSF, PECAM-1, HGF, VEGF, Leptin, PDGF-BB, Angiopoetin, Follistatin and IL-8. ELISAs were performed for the following previously identified markers: IL-2Rα, sTNFR1, ST2/IL-1R4, Reg3α, Semaphorin 5a, Elafin (Levine et al., 2012), CD99 and β2-microglobulin (CE-MS-analysis, Weissinger et al., submitted).
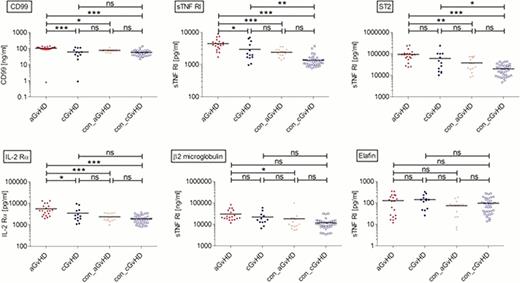
Within the training set analysis by Bio-Luminex no significant differences between aGvHD, cGvHD and respective controls was found for G-CSF, VEGF and PDGF, implying vascular processes due to immunosuppressive antibodies or toxicities early post-HSCT. Changes observed in the aGvHD group were more prominent when compared to the con_cGvHD group. However, this might reflect the completion of immunosuppression in most patients in the con_cGvHD-group. Interestingly, Leptin was significantly higher in patients w/o aGvHD shortly after HSCT compared to patients with aGvHD, but was also low in the cGvHD and con_cGvHD groups. For angiopoetin significantly different levels were found comparing aGvHD vs. con_aGvHD, as well as for cGvHD vs. con_cGvHD. Analysis of the training set showed a trend for angiopoetin distinguishing between patients with aGvHD and tolerant patients. Within the investigated markers of the ELISA analysis, CD99, TNFR1, IL-2Rα, and ST2/IL-1R4 yielded significant differences between the aGvHD and the control groups. First results for patients in the training set are shown in Figure 1. As the detected plasma concentration for these markers did not differ significantly in con_aGvHD and con_cGvHD, the control groups were merged. Preliminary analyses suggest that these markers might be suitable to distinguish patients with aGvHD from tolerant patients, as confirmed by receiver operated characteristics (ROC)-curves.
According to our preliminary results, the most promising markers to detect aGvHD in plasma samples are Leptin, Angiopoetin, TNFR1, β2-microglobulin, and IL-2Rα. In order to improve the predictive power of the ELISA and Bio-Luminex testing, a multiparametric model (support vector machines) will be applied to the training set data. Based on the training set, prospective screening of a validation set of patients will take place soon. Furthermore, by sequencing further relevant peptides from the urine proteomic pattern, we aim to identify additional biomarkers for GvHD.
No relevant conflicts of interest to declare.
Author notes
Asterisk with author names denotes non-ASH members.


This feature is available to Subscribers Only
Sign In or Create an Account Close Modal