Abstract
Abstract 283
The vast majority of pediatric AML patients (>90%) achieve complete remission, however 30–40% relapse and face a dismal prognosis. Current therapy is insufficient as drug resistant cells survive chemotherapy; novel strategies are needed to overcome chemoresistance and improve outcome. The molecular basis underlying drug resistance in AML cells remains largely unknown. Based on the hypothesis that drug resistance in AML patients is largely due to intrinsic properties of leukemic blasts, we here correlated ex-vivo drug resistance data of primary patient samples to genome wide microarray gene expression profiles of AML blasts from diagnosis samples. Peripheral blood or bone marrow samples of 73 pediatric AML patients were enriched for leukemic blasts (median 89% blasts). Ex-vivo drug resistance towards cytarabine (ara-C, N=73), daunorubicin (DNR, N=69), etoposide (VP16, N=39) and cladribine (CDA, N=59) was assayed using the 4 days colorimetric MTT assay; median LC50 values are shown in Table 1. Genome wide expression profiling on the enriched samples was performed using the Affymetrix HGU 133 plus 2 platform (Balgobind et al, Hematologica, 2011).
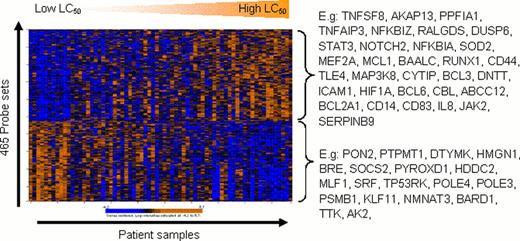
Spearman's rank correlation analyses were used to correlate gene expression levels to the LC50 values, nominal p-values < 0.001 were considered significant. The number of significant probe sets for each drug is shown in Table 1. The strongest correlation of ex-vivo drug resistance and gene expression was found for VP16 (r2 ranged from −0.78 to 0.69 with p values ranging from 1×10⁻⁴ to 2×10⁻⁷ for the above mentioned 656 probes). The figure illustrates the correlation of ex-vivo DNR resistance with gene expression levels. We performed Gene Ontology (GO) enrichment analysis and Ingenuity Pathway Analysis (IPA) using expression values of the probe sets that were associated with ex-vivo resistance for each drug to gain insight in the possible cellular pathways involved. Chromatin remodeling, epigenetic regulation of gene expression and methyltransferase activity were among the top GO categories for ara-C resistance. For example, a high expression of MLL2, MLL4, ASXL1, and CARM1 was associated with high ara-C LC50 values. For DNR, GO and IPA indicated a role for response to growth factor stimuli and mitochondrial response to oxidative stress; examples of individual genes are shown in the Figure below. For VP16, a low expression of genes that are implicated in cell cycle, DNA replication and DNA damage response was associated with increased resistance. This included DNA polymerases, genes in BRCA1 signaling as well as the target of VP16, topoisomerase 2α. Upstream regulators that contribute to the gene expression profiles that were associated with ex-vivo drug resistance according to IPA are shown in Table 2. Interestingly, for DNR, VP16 and CDA the expression profiles in part explained by regulation via CD40L, a gene that has been associated with drug resistance in lymphatic leukemias. Targeted therapeutics are being developed to interfere in the CD40L mediated anti-apoptotic signaling and thus may offer alternative treatment options in drug resistant AML.
Hence, we present novel data in which diagnosis samples of a relatively large group of pediatric AML patients were used to identify gene expression profiles that are associated with cellular drug resistance. These data may pave the way to the identification of genes that contribute to drug resistance, e.g. CD40L. Moreover, our findings may enhance the development of personalized treatment strategies by sensitizing patients to conventional chemotherapeutic drugs.
Summary of ex-vivo drug resistance of primary AML blasts and its correlation with genome wide gene expression data
| Drug . | LC50 . | significant probe sets . |
|---|---|---|
| Ara-C | .360 (.182-.616) | 113 |
| DNR | .172 (.093-.250) | 465 |
| VP16 | 2.65 (1.84-6.70) | 656 |
| CDA | .020 (.004-.027) | 269 |
| Drug . | LC50 . | significant probe sets . |
|---|---|---|
| Ara-C | .360 (.182-.616) | 113 |
| DNR | .172 (.093-.250) | 465 |
| VP16 | 2.65 (1.84-6.70) | 656 |
| CDA | .020 (.004-.027) | 269 |
LC50 = lethal concentration needed to kill 50% of the cells depicted as median ug/mL(p25-p75).
Summary of pathway analysis of gene expression that correlated with ex-vivo drug sensitivity
| Drug . | top 3 upstream regulators . | p range upstream regulators . |
|---|---|---|
| Ara-C | IL5 | 2.40×10−02 |
| DNR | CD40L, IRF8, OSCAR | 7.4×10⁻⁴ to 4.4×10⁻⁵ |
| VP16 | CD40L, BRCA1, ACAT1 | 3.2×10⁻² to 9.6×10⁻³ |
| CDA | CD40L, ASB2,IL10RB | 1.15×10⁻² to 8.3×10⁻⁴ |
| Drug . | top 3 upstream regulators . | p range upstream regulators . |
|---|---|---|
| Ara-C | IL5 | 2.40×10−02 |
| DNR | CD40L, IRF8, OSCAR | 7.4×10⁻⁴ to 4.4×10⁻⁵ |
| VP16 | CD40L, BRCA1, ACAT1 | 3.2×10⁻² to 9.6×10⁻³ |
| CDA | CD40L, ASB2,IL10RB | 1.15×10⁻² to 8.3×10⁻⁴ |
Upstream regulators are ranked according to p-value.
No relevant conflicts of interest to declare.
Author notes
Asterisk with author names denotes non-ASH members.


This feature is available to Subscribers Only
Sign In or Create an Account Close Modal