

Abstract
The constitutively active mutant of the Wiskott-Aldrich Syndrome protein (CA-WASp) is the cause of X-linked neutropenia and is linked with genomic instability and myelodysplasia. CA-WASp generates abnormally high levels of cytoplasmic F-actin through dysregulated activation of the Arp2/3 complex leading to defects in cell division. As WASp has no reported role in cell division, we hypothesized that alteration of cell mechanics because of increased F-actin may indirectly disrupt dynamic events during mitosis. Inhibition of the Arp2/3 complex revealed that excess cytoplasmic F-actin caused increased cellular viscosity, slowed all phases of mitosis, and perturbed mitotic mechanics. Comparison of chromosome velocity to the cytoplasmic viscosity revealed that cells compensated for increased viscosity by up-regulating force applied to chromosomes and increased the density of microtubules at kinetochores. Mitotic abnormalities were because of overload of the aurora signaling pathway as subcritical inhibition of Aurora in CA-WASp cells caused increased cytokinesis failure, while overexpression reduced defects. These findings demonstrate that changes in cell mechanics can cause significant mitotic abnormalities leading to genomic instability, and highlight the importance of mechanical sensors such as Aurora B in maintaining the fidelity of hematopoietic cell division.
Introduction
The Wiskott-Aldrich Syndrome protein (WASp) is expressed in hematopoietic cells and regulates the ARP2/3 complex to spatially and temporally control actin polymerization during cytoskeletal rearrangements.1 Some specific mutations in the Wiskott-Aldrich syndrome gene disrupt the physiologic autoinhibition of WASp and result in a constitutively active protein. These are known to cause human X-linked neutropenia (XLN) rather than the more typical WAS.1-5 XLN patients suffer from recurrent bacterial infections because of severe neutropenia and monocytopenia.3,4 In addition to the immune system defects, XLN patients may develop cytogenetic changes indicative of chromosomal instability, myelodysplasia, or acute myeloid leukemia.2,4,6 The link between the constitutively active mutant of the WASp (CA-WASp) expression and chromosomal instability is supported by the recent demonstration of chromosomal changes in a murine model of the disease.7
In cells, CA-WASp leads to a dramatic increase in F-actin that permeates the entire cytoplasm and surrounds chromosomes during mitosis resulting in an increase in the time necessary to complete mitosis and subsequent generation of micronucleated and binucleated cells.2 As a dynamic mechanical process, cell division is sensitive to the mechanical properties of the cell, with alterations beyond normal tolerances leading to errors in spindle positioning and assembly, chromosome segregation, and cytokinesis.8-10 In particular, the actin cytoskeleton plays a fundamental role in setting cell elasticity and viscosity.11,12 As WASp has no reported role in cell division,13 we hypothesised that an indirect mechanical effect because of changes in the actin cytoskeleton downstream of CA-WASp might compromise critical dynamic events during cell division, such as the spindle assembly checkpoint, the poleward movement of chromosomes, or the closure of the cleavage furrow before cytokinesis.
Cell division is tightly regulated to ensure the correct duplication and distribution of genetic material. One important regulator is the chromosomal passenger protein Aurora B, a promising target for treatment of hematopoietic malignancies,14 which regulates chromosome alignment at metaphase and delays abscission in cells with structural defects or chromatin bridges.15-17 In particular, Aurora B activity is crucial in sensing mechanical changes to the centromere during chromosome alignment18-21 although the precise role of intrakinetochore and interkinetochore tension, Aurora B activity, and dynamic attachment of microtubules to kinetochores in controlling the spindle assembly checkpoint remains to be determined.22-27 The mitosis defects induced by CA-WASp occur during both stages of mitosis that fall under the regulation of Aurora B (attachment of microtubules to kinetochores and cytokinesis) making it an obvious candidate for tolerance overload.
In this study, we show that the increase in cytoplasmic F-actin in cells expressing CA-WASp leads to a slowing of all phases of mitosis because of a dramatic increase in cytoplasmic viscosity, that in turn causes kinetic defects in mitosis that are subject to modulation by the Aurora B pathway. This reveals a novel pathway toward genomic instability and highlights the importance of mechanical sensors to regulate cell division.
Methods
Cell culture, lentiviral production and transduction, generation of stable cell lines
HT1080 human fibrosarcoma cells were cultured in DMEM supplemented with 10% FCS, 100 IU/mL penicillin, and 100 μg/mL streptomycin. U937 human monocytic lymphoma cells were cultured in RPMI 1640 supplemented with 10% FCS, 100 IU/mL penicillin, and 100 μg/mL streptomycin. Lentiviral vectors expressing eGFP fused to human WASp, eGFP fused to human WASp with the I294T mutation or mCherry fused to Histone2B were prepared in the pHR'SIN-cPPT-CE and pHR'SIN-cPPT-SE lentiviral backbones as described previously.2 Lentivirus was added to cells at a MOI of 10 to achieve approximately 90% transduction. Expression levels of eGFP-CA-WASp were normalized by flow cytometry exciting at 488 nm to ensure equivalent expression in control and Aurora B–overexpressing cells. Fluorescence-activated cell sorting using a MoFlo XDP (Beckman Coulter) was used to purify H2B-mCherry–expressing cells from a mixed population of lentiviral-transduced cells. HT1080 cells expressing mCherry-LifeAct were generated by transduction with a retrovirus expressing mCherry-LifeAct and puromycin selection.
Graphs and statistics
Box and whiskers plots show median, 10th, 25th, 75th, and 90th percentiles; statistical significance was calculated using one-way Anova with Bonferroni postcorrection. Differences between datasets on cumulative histograms were assessed with log-rank (Mantel Cox) test. Bar graphs show mean ± SD.
Supplemental methods
Details of flow cytometry, cell morphology analysis by cytospins, Western blotting, wide-field fluorescence time-lapse microscopy, spinning disk confocal live microscopy, confocal microscopy, and atomic force microscopy are included in supplemental Methods (available on the Blood Web site; see the Supplemental Materials link at the top of the online article).
Results
Progress through mitosis from prophase to telophase is delayed in cells expressing CA-WASp,2 although it is not known which precise stage of mitosis is affected. To examine this delay in more detail, 4 stages of mitosis were timed: nuclear envelope breakdown (prophase); the metaphase/anaphase transition; furrow initiation; and furrow closure (telophase; Figure 1A). During the progression from nuclear envelope breakdown to anaphase, the mitotic spindle assembles to capture chromosomes and align them at the metaphase plate to satisfy the spindle assembly checkpoint. This process consistently took close to 30 minutes in control HT1080 cells and cells expressing wild-type WASp (WT-WASp). CA-WASp expression resulted in a significant delay to anaphase onset (Figure 1B), indicating a delay in fulfilling the spindle assembly checkpoint. The separation of chromosomes at anaphase is closely followed by formation and closure of the cleavage furrow, with tight regulation in place to ensure no errors are made.28 Furrow initiation in HT1080 cells was strictly coordinated with anaphase, the furrow typically formed 2 to 3 minutes after anaphase (Figure 1C). This coordination was lost in cells expressing CA-WASp, where furrowing started between 2 and 6 minutes after anaphase. CA-WASp caused a similar delay in the closure of the furrow (Figure 1D). The tight temporal and spatial regulation of cell division was evident in the minimal variation of the duration of each stage of mitosis in control cells (Figure 1). In contrast, there was much greater variability in the progress through each stage of mitosis in CA-WASp cells compared with control cells (supplemental Figure 1). In control cells, 17 of 100 cells exhibited delayed mitosis (> 45 minutes from nuclear envelope breakdown [NEB] to furrow closure), with all 17 delayed mitoses resulting from delayed anaphase (> 40 minutes after NEB). Congression was only delayed in 2 of the 17 delayed divisions (> 15 minutes after NEB), while furrow initiation was delayed once (> 3 minutes after anaphase) and furrow closure twice (> 4 minutes after furrow initiation). In CA-WASp cells, delayed mitoses were also associated with delayed anaphase, but in addition a larger portion of cells also presented delays in congression, furrow initiation, and furrow closure (45 of 100 had delayed mitosis, 34 of these 45 also showed delayed anaphase entry, 29 of 45 presented delayed congression, 16 of 45 a delay in furrow initiation, and 29 of 45 a delay in furrow closure). The delay in every single stage of mitosis observed suggested that CA-WASp led to alterations to phenomena that played a very general role in cell division, rather than acting to perturb a specific stage of this complex process.

All stages of mitosis are impeded by CA-WASp expression. (A) Time-lapse images of HT1080 cells expressing fluorescent Histone 2B showing nuclear envelope breakdown (NEB), anaphase onset (Ana), and the start (Fur) and completion (End) of furrowing. Bar = 10 μm. (B) Timing of NEB to anaphase, (C) anaphase to furrow initiation, and (D) furrow duration; n > 200 cells over at least 4 independent experiments. (E) Chromatid speed during anaphase (mean ± SEM, n = 14 control and n = 15 CA-WASp). (F) Peak chromatid speeds. (G) Furrow closure speed (mean ± SEM, n = 16 for control and CA-WASp). (H) Peak furrow closure speeds. Imaging used a Zeiss Axiovert 135 microscope fitted with an environmental chamber at 37°C with 5% CO2. Cells were cultured in phenol red–free DMEM with 10% FCS. Fluorochromes were mCherry-H2B and eGFP-WASp. A Hamamatsu ORCA-ER CCD camera was used, and acquisition was controlled with Volocity software. Image analysis used ImageJ.
Mitotic kinetics are slowed in CA-WASp cells
Mitosis is a succession of highly dynamics events: NEB, spindle assembly, metaphase alignment, anaphase, and cleavage. The most dynamic of these are arguably the separation of chromosomes, and closure of the cleavage furrow. The dynamics of these processes were measured to establish whether CA-WASp expression perturbed them. In control cells, chromosome speed peaked 2 minutes after anaphase onset (Figure 1E) and reached an average maximum speed of 38.5 nm/s (range, 28.7-52.1 nm/s; Figure 1F). Peak chromosome speed was an average of 25% slower in cells expressing CA-WASp (average maximum speed of 30.0 nm/s; range, 19.0-40.6 nm/s; Figure 1F). Only the early fastest stages of chromosome separation were slowed by CA-WASp, and the total distance moved by the chromosomes (the length of the spindle) was not altered. The spindle length at the onset of furrow closure was 12.1 ± 1.3 μm for control and 11.2 ± 1.5 μm for CA-WASp cells. Furrow closure speed was also slower in cells expressing CA-WASp (average maximum speed of 38.7 nm/s, range 28.9-55.4 and 32.0 nm/s range, 26.5-38.5 for control and CA-WASp, respectively; Figure 1G-H). These measurements show that 2 distinct processes, the microtubule-driven movement of chromosomes and the actomyosin-driven closure of the furrow, show slower kinetics in cells expressing CA-WASp. This generalized slowing of 2 dynamic processes with completely different assembly and regulatory mechanisms suggests that rather than being a result of the activation the mitotic checkpoint, the delay may be because of slower movement of cellular components and retarded morphogenesis.
Arp2/3 inhibition depletes cytoplasmic F-actin and rescues proliferative and nuclear defects
One consequence of expression of CA-WASp is that it is active throughout the cell, resulting in activation of the Arp2/3 complex in the cytoplasm and an accumulation of F-actin throughout the cytoplasm2 rather than being restricted to the cell periphery where WASp is normally activated.29,30 We asked whether ectopic accumulation of F-actin was sufficient to explain slowing of all phases of mitosis. At the subcellular level, inhibiting the Arp2/3 complex with the small molecule CK66631 lowered the amount of excess F-actin in CA-WASp cells, without overtly affecting cortical actin (Figure 2A-C). CA-WASp expression caused F-actin to accumulate around mitotic chromosomes.2 This occurred within minutes of NEB (supplemental Figure 2) and the abnormal presence of F-actin may impede chromosome capture, alignment and separation, and obstruct furrow closure and abscission. In addition to lowering cytoplasmic F-actin, CK666 also prevented F-actin accumulation around mitotic chromosomes (Figure 2C-E).

CA-WASp requires Arp2/3 activity to increase F-actin production. (A) Percentage increase in total cellular F-actin because of CA-WASp, measured by flow cytometry in HT1080 cells (blue) and U937 cells (red) cultured with DMSO, 20μM or 40μM CK666; n = 3, mean ± SD. (B-C) Confocal images of (B) interphase HT1080 and (C) prometaphase U937 cells showing DNA (DAPI, blue), GFP-CA-WASp (green), and F-actin (red). Dashed white circles show individual ∼ 10 μm2 areas used to measure F-actin density. Bar = 10 μm. (D-E) Nuclear F-actin density in prometaphase (D) HT1080 and (E) U937 cells with and without CA-WASp expression cultured in the conditions shown; n > 10 for each condition. Confocal microscopy was performed with a Zeiss LSM 710 inverted confocal microscope with a 40× C-Apochromat NA 1.2 WD 280-mm objective. Image analysis used ImageJ software. Fluorochromes were DAPI, eGFP-WASp, and Alexa Fluor 647–phalloidin.
At the population level, CA-WASp expression leads to loss of proliferation, increased apoptosis, cytokinesis failure, and micronucleated cells.2 If these abnormalities were downstream of an increase in F-actin, then Arp2/3 inhibition should prevent them. CK666 treatment resulted in an almost complete reversal of all defects (Figure 3, supplemental Figure 3). The recovery of normal cellular physiology was more comprehensive in U937 cells than in HT1080 cells (compare Figure 3A,D,F vs B,E,G) as expected from the more complete inhibition of F-actin accumulation by CK666 in the U937 cell line (Figure 2A,D,E). Micronucleated cells often result from chromosomes that have not been correctly attached to the mitotic spindle (merotelic or syntelic attachments) and lag behind during anaphase.32 The increase of micronucleated cells because of CA-WASp was accompanied by a similar rise in the frequency of lagging chromosomes (Figure 3H-I, supplemental Figure 3), suggesting that these chromosomes where either incorrectly attached to the spindle, or became enmeshed in the overabundant cytoplasmic F-actin.

Arp2/3 complex inhibition rescues the proliferative and nuclear defects caused by CA-WASp. (A-B) Percentage of (A) U937 and (B) HT1080 cells expressing GFP-CA-WASp 3, 6, 8, 10, 13, and 15 days after transduction cultured with DMSO, 20μM or 40μM CK666; n = 3, mean ± SD. (C) Apoptosis measured by flow cytometry of annexin V–stained U937 cells after culture for 3-8 days in the conditions shown, with (■) and without (▩) CA-WASp expression, n = 8. Percentage of binucleated (D) U937 and (E) HT1080 cells after culture for 3-10 days in the conditions shown, n = 8. Control (▩); CA-WASp (■). (F-G) Percentage of micronucleated (F) U937 and (G) HT1080 cells after culture for 3-10 days in the conditions shown, n = 6. ■ indicates cells with micronuclei alone; and ▩, binucleated cells with micronuclei. (H) Lagging chromosomes at anaphase in HT1080 cells. Bar = 10 μm. (I) Percentage of HT1080 cells with lagging anaphase chromosomes; n = 3 with at least 300 cells analyzed per condition. Confocal microscopy was performed as in Figure 2.
The rescue of the proliferative and nuclear defects through prevention of excess F-actin production suggested that mitotic kinetics might also be restored. Mitotic progression in the presence of CK666 was measured in U937 cells as these were the most responsive to CK666 rescue of the CA-WASp phenotype. Four stages of mitosis were timed as in Figure 1. In U937 cells, the CA-WASp–induced delay from prophase to anaphase was completely reversed by CK666 (Figure 4A). The next stage of mitosis measured, from anaphase to furrowing, was partially rescued by CK666 (Figure 4B). CK666 treatment slowed the final stage of mitosis measured, the duration of furrow closure (supplemental Figure 4), and so prevented assessment of a potential rescue of furrowing. Together, these results show that removal of ectopic F-actin in cells expressing CA-WASp reverses all the proliferative and nuclear defects, and also partially restores normal mitotic timing.

Changes in cytoplasmic viscosity correlate with altered mitotic kinetics. (A) Time for control and CA-WASp U937 cells to progress from NEB to anaphase when cultured with DMSO or 20μM CK666; n > 35 cells per condition over 4 independent experiments. (B) Time for U937 cells from panel A to progress from anaphase to the start of furrowing. (C) Apparent cytoplasmic viscosity and cellular elasticity in HT1080 cells. (D) Time for HT1080 cells to progress from anaphase to the start of furrowing when cultured with DMSO, 20μM or 40μM CK666; n > 33 cells per condition over 4 independent experiments. (E) Peak anaphase chromatid velocity of HT1080 cells shown in panel D. (F) Normalized anaphase chromatid velocity as a function of the inverse normalized apparent cytoplasmic viscosity in HT1080 cells. (G) Period of oscillation of prometaphase kinetochore pairs. *Significant difference (P < .01) from control; #significant difference (P < .01) from CA-WASp.
Increases in cytoplasmic viscosity because of overabundant cytoplasmic F-actin correlate with altered mitotic kinetics
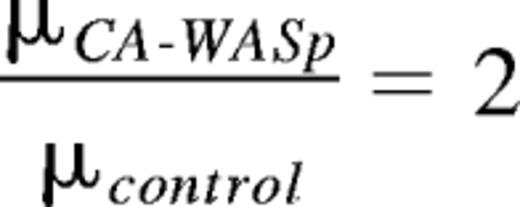
F-actin plays a fundamental role in cell rheology,11 hence the presence of excessive cytoplasmic F-actin suggested that the observed general slowing of all phases of mitosis may be because of an F-actin–dependent increase in cytoplasmic viscosity. Atomic force microscopy AFM measurements on HT1080 cells revealed a 2-fold increase in both cellular elasticity and apparent cellular viscosity because of CA-WASp expression. Both these changes were dose-dependent, although only partially reversed by the reduction in cytoplasmic F-actin by CK666 (Figure 4C). If increased cytoplasmic viscosity was the cause of the general slowing of all stages of mitosis, then the measured changes in dynamics should correlate with measured changes in viscosity. Indeed, at time scales that are long compared with actin turn over (t1/2∼15 seconds) the cytoplasm can be considered as a viscous fluid33 and therefore the movement of organelles in the cytoplasm is resisted by viscous forces that scale as F ∼ μV (where F is the force, μ the viscosity and V the velocity). To ask whether the dependence of viscosity on cytoplasmic Arp2/3 activity was also mirrored by a similar effect on organelle movement velocity, we measured anaphase chromosome movement in wild-type, CA-WASp cells, and CA-WASp cells treated with CK666. On CK666 treatment, the delay from anaphase to the start of furrowing was reduced dose dependently by CK666 in HT1080 cells (Figure 4D) and peak chromosome velocities returned toward normal levels with increasing doses of CK666 (Figure 4E). Plotting the normalized chromosome movement velocity as a function of the inverse of the normalized viscosity revealed that they were highly correlated (r2 = 0.95; Figure 4F), suggesting that changes in viscosity associated with excessive cytoplasmic F-actin gave rise to the observed changes in chromosome velocity. However, the nonunity slope (Figure 4F) suggested that an up-regulation of motive force applied onto the chromosomes also took place. Indeed, if applied force stayed constant, the measured doubling of viscosity should halve velocity. Experimentally, velocity only decreased by 20%-30%, suggesting that the force applied to chromosomes by spindle microtubules in CA-WASp cells increased 1.65-fold over controls. As expected from the nonspecific nature of the perturbation induced by CA-WASp overexpression, kinetochore oscillations were also altered by CA-WASp and restored by CK666 (Figure 4G, supplemental Figure 4F). Calculating the speed of kinetochore oscillations from the amplitude (3.13 ± 0.6 μm) and period revealed that consistent to what was observed for anaphase movement, the decrease in speed of oscillating kinetochores (34.3 ± 8.2 nm/s in controls and 27.1 ± 4.3 nm/s in CA-WASP cells) was less than would be expected from the increase in viscosity. This again suggested that force applied to kinetochores was increased in CA-WASp cells, by approximately 1.55-fold on metaphase kinetochores, similar to the 1.65-fold increase on chromosomes in anaphase.
Aurora B activity contributes to CA-WASp–induced mitotic abnormalities
The increase in cytoplasmic viscosity and concomitant increase in force applied to chromosomes to drive their movement suggests that mechanically sensitive events during mitosis will be perturbed by CA-WASp expression. The detection of merotelic kinetochore attachments (where a single kinetochore is attached to microtubules from both spindle poles) to promote amphitelic attachment (where each sister kinetochore is attached to microtubules from opposite spindle poles) is an exquisitely mechanically sensitive process. Amphitelic attachment is controlled, at least in part, by a phosphorylation gradient spreading from Aurora B at the inner centromere to substrates located at the periphery of the kinetochores whose phosphorylation destabilizes microtubule attachment.18-21,25,34 If the force applied by microtubules is increased in CA-WASp cells, then as tension scales with force, the tension across the centromere would also be increased, potentially moving the phosphorylation targets further from Aurora B, thus changing the sensitivity in detecting amphitelic attachment. Hence, we decided to test the role of Aurora B in CA-WASp–induced mitotic defects.
Overexpression of Aurora B can prevent polyploidy in cells that have chemically and genetically induced mitosis defects,35 therefore we assessed the effect of Aurora B overexpression on CA-WASp induction of micronucleated cells and cytokinesis failure. Aurora B was fused to BFP (blue fluorescent protein) and stably overexpressed in HT1080 and U937 cells (Figure 5A, supplemental Figure 5D). Live cell imaging in HT1080 cells confirmed that Aurora B-BFP was localized to chromosomes at metaphase and then to the cleavage furrow at telophase, identical to the expected localization.36 Overexpression of Aurora B protected U937 and HT1080 cells from the generation of micronuclei and cytokinesis failure induced by CA-WASp (Figure 5B). This protection by Aurora B overexpression suggests that CA-WASp expression leads to division defects that exceed the error correction capacity of endogenous Aurora B. Therefore, CA-WASp may render cells more sensitive to inhibition of Aurora B. AZD1152, a specific inhibitor of Aurora B activity,37 increased division defects dose-dependently (supplemental Figure 5A-C). We titrated AZD1152 in U937 and HT1080 cell cultures to establish the maximum concentration of Aurora B inhibitor that could be tolerated without inducing division defects. Concentrations above 20nM resulted in high levels of mitotic slippage, as evidenced by the presence of cells with giant nuclei while 10nM AZD1152 generated binucleated cells indicative of cytokinesis failure (supplemental Figure 5A-C). AZD1152 at 5nM had little effect on control cell cultures (supplemental Figure 5B-F, Figure 5B) and was used as a subcritical dose in all subsequent experiments. Treatment of CA-WASp cells with the subcritical dose of 5nM AZD1152 approximately doubled the number of micronucleated and binucleated cells compared with CA-WASp cells without Aurora B inhibition (Figure 5B, supplemental Figure 5E-F). The increased generation of micronuclei (from anaphase defects) and binucleated cells (from cytokinesis defects) in CA-WASp cells treated with this subcritical dose of AZD1152 was significantly greater than the predicted additive effect from AZD1152 and CA-WASp (Figure 5B), indicating an increased sensitivity to Aurora B inhibition in CA-WASp cells. To confirm that the rise in sensitivity to Aurora B inhibition was because of the increase in F-actin, U937 cells were treated with CK666. This treatment completely prevented the increased sensitivity to Aurora B inhibition that would otherwise be induced by CA-WASp (supplemental Figure 5F). Indeed, long-term culture of U937 cells expressing CA-WASp showed that even lower doses of AZD1152 (2.5nM) massively increased cytokinesis failure, but had no effect when CK666 was used to prevent excess F-actin production (supplemental Figure 5F inset). Hence, CA-WASp expression increases the sensitivity of the cell to Aurora B inhibition, while overexpression of Aurora B can negate the cell division defects that CA-WASp induces. These data together suggest that in CA-WASp cells, Aurora B operates close to its maximum capacity.

CA-WASp mitotic abnormalities are sensitive to the Aurora B pathway and involve increased kinetochore microtubule intensity. (A) Western blot showing Aurora B-BFP overexpression in HT1080 and U937 cells. (B) Percentage binucleated and micronucleated U937 and HT1080 cells after 4-day expression of GFP-CA-WASp in cells overexpressing Aurora B or inhibition of Aurora B with 5nM AZD1152 for 48 hours. Images show examples of binucleated and micronucleated HT1080 cells. (C) Confocal images of HT1080 cells blocked in metaphase by proteasome inhibition followed by 10 minutes in ice-cold media stained for α-tubulin (red) and Hec1 (green, a kinetochore protein) to show kinetochore microtubule fibers. Bar = 5 μm (top panels) and 1 μm (bottom panels). (D) Quantification of kMT intensity from cells prepared as in panel C. Values are relative to the mean control value from each experimental repeat (n ≥ 3). kMT intensity was measured from the fluorescence intensity of the entire spindle (top panels, white dashed areas) and also as an average value of 0.25-μm2 sections of kMT fibers at 10 individual kinetochores per cell (bottom panels, white dashed areas). Each point on the chart represents the kMT intensity of an individual cell, with the values from the cells shown in panel C highlighted as red points. Confocal microscopy performed with a Zeiss LSM 710 inverted confocal microscope with a 63× P-Apochromat NA 1.4 oil-immersion objective, with fluorochromes eGFP-WASp, Alexa Fluor 568, and Alexa Fluor 647.
Kinetochore microtubule density is increased in cells expressing CA-WASp
Our measurements of kinetochore oscillation movement and chromosome separation movement revealed that the measured decrease in velocity (∼ 30%) was smaller than expected from the 2-fold increase in cytoplasmic viscosity, that should lead to a 50% decrease in velocity (Figures 4C,F-G). We hypothesized that this might be because of an increase in the force applied on kinetochores. As force exerted on a kinetochore scales with the number of attached microtubules,38 any up-regulation in force should result from an increase in the number of kinetochore-attached microtubules (kMTs). Each kinetochore can accommodate attachment of up to approximately 52 microtubules39 and the number of kMTs attached at each kinetochore increases during mitosis from 20 ± 6.7 in late prometaphase to 28 ± 6.3 at early anaphase.39 Together, these data suggest that during mitosis, the number of microtubules attached at each kinetochore is not saturated and that up-regulation in the number of kMTs is a realistic mechanism for up-regulating the force exerted on kinetochores.
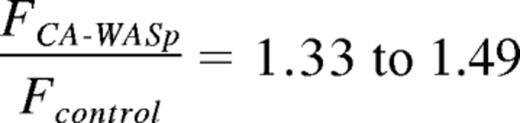
To test this hypothesis, we compared the intensity of kMT fibers in control cells to CA-WASp cells. Measurement of kMT fiber intensity was achieved by immunofluorescent staining of cells arrested in metaphase by proteasome inhibition followed by 10 minutes cold treatment to remove all microtubules other than the cold-resistant kMTs.27,40 To allow comparison between experiments, all values were normalized to the mean control value from each experiment. We first measured the total fluorescence intensity of all the kMTs composing the spindle (Figure 5C-D). The total intensity of cold stable kMTs was increased from 1.0 ± 0.22 in controls to 1.49 ± 0.47 in CA-WASp cells (mean ± SD, P < .001, Figure 5D). To exclude the possibility that this increase in the total intensity of kMTs in the spindle may simply reflect an increase in the number of kinetochores per cell, the intensity of kMT fibers at individual kinetochores was measured to give the mean kMT fiber intensity for each cell. Control cell kMT fibers had a normalized intensity of 1.0 ± 0.19 while in CA-WASp cells this was significantly increased to 1.33 ± 0.22 (Figure 5C-D). This demonstrates that in cells expressing CA-WASp, the intensity of kMT fibers at individual kinetochores is greater than in control cells and is closer to saturating the microtubule binding capacity of each kinetochore.
The 33% to 49% increase in kMT intensity suggests that in CA-WASp cells the force applied to kinetochores is similarly increased. Normalizing all values to control conditions we are able to test the predicted changes in velocity, viscosity, and force against those measured experimentally.
The velocity V of kinetochores pulled with a force F scales as
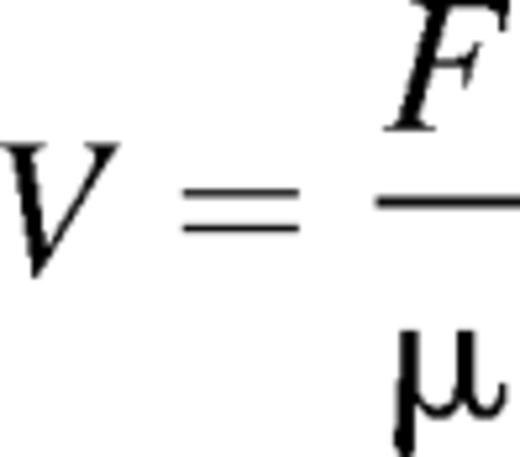
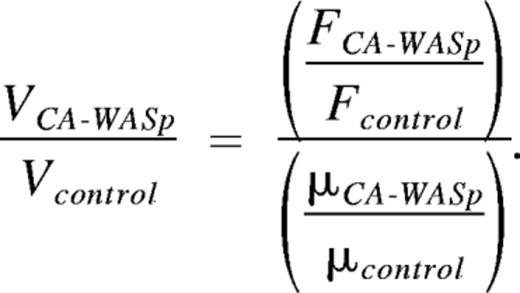
with the viscosity μ. Therefore, by normalizing to controls, we find
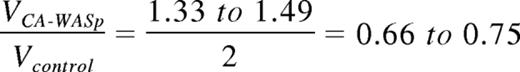
Experimentally, the measured increase in kMT intensity was
and the change in apparent viscosity measured by AFM was
Therefore, these numerical values predict
Discussion
We have previously shown that CA-WASp expression causes proliferative defects with chromosomal instability and that this can be mimicked by pharmacologically increasing F-actin content.2 We now show that CA-WASp expression affects all stages of cell division suggesting a generalized nonspecific effect rather than disruption of a particular event or pathway in mitosis. The CA-WASp phenotype can be largely reversed by inhibiting the WASp effector Arp2/3 using a targeted small molecule. This suggests that excessive and delocalized F-actin polymerization is the primary cause of the cellular abnormalities associated with CA-WASp, rather than an alternative biologic activity of CA-WASp.
As a mechanical process, cell division is dependent on the physical properties of the cell and any alteration beyond normal tolerances results in defects. For example, the rounding of the cell during mitosis increases cortical rigidity to provide a stable framework to support the mitotic spindle. Loss of this mechanical rigidity by down-regulation of contractility by depletion of the ERM protein moesin leads to spindle defects, chromosome missegregation, and anaphase delay.8 Cytokinesis requires precise regulation of cell periphery mechanics, with perturbation of these mechanics resulting in furrow displacement and aneuploidy.9 Increasing F-actin content through reduced activity of the actin regulator cofilin results in delayed progress through all stages of mitosis,41 supporting our view that CA-WASp has a nonspecific blanket effect on mitosis through an increase in cytoplasmic F-actin that alters cell mechanics. In addition to a general slowing of mitosis, there is an increase in the frequency of lagging chromosomes and cytokinesis failure. Missegregation of chromosomes at anaphase can lead to formation of micronuclei32,42 while this missegregation combined with cytoskeletal changes will contribute to cytokinesis failure.15 The resulting micronucleated and binucleated cells are prone to cell-cycle arrest,43,44 apoptosis,45,46 and chromosomal instability.32,42,47-49 Therefore, the key features of XLN (slow proliferation, increased apoptosis and chromosomal instability) can all be explained by a nonspecific mechanical disruption of cell division because of excess cytoplasmic F-actin polymerization.
These cytoskeletal changes resulted in significant alteration to the apparent cytoplasmic viscosity, which slowed the movement of chromosomes and retarded morphogenetic changes such as cytokinesis. Increased viscosity showed a linear correlation with decreased chromosome separation speed and kinetochore oscillation speed. Interestingly, neither movement velocities slowed as much as expected from the change in apparent cellular viscosities, suggesting a compensatory increase in the motive force on chromosomes to reach a given velocity. This increase in force was achieved by elevating the number of kMTs attached to kinetochores.
The increased sensitivity of cells to Aurora B inhibition when CA-WASp was expressed suggests that a rise in cytoplasmic viscosity leads to mechanical changes that perturb the Aurora B pathway. At prometaphase Aurora B is located in the inner centromere, and generates a gradient of phosphorylation that extends toward spatially distinct targets on the periphery of the sister kinetochores.34 The phosphorylation by Aurora B of these distinct targets on kinetochores provides a mechanism for sensing kinetochore tension to regulate microtubule attachment and encourage amphitelic attachment to the spindle.18,19,23 At low tension (nonamphitelic attachment), the targets remain close to Aurora B, and their phosphorylation encourages microtubule detachment from the kinetochore.21 With increasing amphitelic attachment of microtubules the tension between sister kinetochores increases, moving the phosphorylation targets further away from Aurora B, stabilizing microtubule attachment. Whether the spindle assembly checkpoint responds directly to tension across the centromere (indicating amphitelic attachment) or is solely governed by the dynamic attachment of microtubules to kinetochores regardless of amphitelic or syntelic attachment remains an area of active research.24-27,50 In cells expressing CA-WASp, the intensity of kMTs per kinetochore is increased, suggesting an increase in the number of kMTs at each kinetochore. How this occurs is not known. One possibility is that initially, the increased elasticity and viscosity of the cytoplasm because of excess F-actin create extra forces that resist kinetochore stretching and movement. Hence, more kMT attachment to kinetochores would be required to exert sufficient force to stretch the sister kinetochores far enough from the centrally located Aurora B to allow stable kMT attachment. This mechanical component would help explain the anaphase delay, as more time would be required to allow attachment of the greater number of kMTs. If the spindle assembly checkpoint was satisfied solely on the basis of the number of MTs attached, we should not observe any delay. Therefore, our data suggest further regulation of the SAC downstream of MT attachment, possibly by Aurora B kinase, as recent reports suggest.26,27
Overexpression of Aurora B in CA-WASp cells reduced the number of mitotic defects, while treatment of CA-WASp cells with subcritical doses of aurora inhibitor led to a dramatic increase in defects. The increase in the intensity of kMT fibers attached to each kinetochore in CA-WASp cells may explain the extra sensitivity to Aurora B inhibition. If the number of incorrectly attached kMTs augments proportionally, the aurora pathway may reach its critical capacity and inhibiting even a small fraction of total aurora kinase may result in an accumulation of errors far greater than in control cells. Conversely, increasing the total amount of cellular Aurora B by overexpression may ease overload.
Aurora B also plays an active role in encouraging successful cytokinesis by delaying abscission if a chromosome bridge is present through the midbody between daughter cells.15 Cells expressing CA-WASp frequently fail cytokinesis, and are more sensitive to Aurora B inhibition than controls. This again suggests that Aurora B is operating at near maximal capacity to delay abscission in CA-WASP cells, such that a slight inhibition in this setting has a much greater effect than in control cells. Thus, by overexpressing Aurora B, we increase its capacity to delay abscission and rescue CA-WASp cells from cytokinesis failure. In cells expressing CA-WASp, we did not observe an increase in chromosome bridges, but did see a dramatic increase in anaphase lagging chromosomes. This raises the possibility that slowing because of viscosity may be interpreted as a mechanical blockage, or that excessive F-actin, trapped organelles, or lagging chromosomes within the furrow may activate Aurora B.
Taken together, these results demonstrate the importance of maintaining the mechanical state of the cell within defined tolerances and give another illustration of the interplay between mechanics and signaling. Further investigation of how the mechanical changes induced by CA-WASp impact on mitosis and cytokinesis will yield novel insights into how the Aurora B signaling pathway senses incorrect attachment and mechanical blockage, as well as reveal an experimental system to investigate other pathways required to ensure successful cell division.
The online version of this article contains a data supplement.
The publication costs of this article were defrayed in part by page charge payment. Therefore, and solely to indicate this fact, this article is hereby marked “advertisement” in accordance with 18 USC section 1734.
Acknowledgments
The authors thank the confocal microscopy core facility and the flow cytometry core facility at the UCL Institute of Child Health (ICH) and Great Ormond Street Hospital for Children (GOSH), as well as Helen Matthews (Laboratory for Molecular Cell Biology, University College London, London, United Kingdom) for help with spinning disk confocal microscopy. CK666 was a gift from Thomas D. Pollard (Yale University, New Haven, CT). H2B-mCherry was a gift from Jason Swedlow (University of Dundee, Dundee, United Kingdom). mCherry-LifeAct was a gift from Roland Wedlich-Soldner (Max-Planck Institute for Biochemistry, Martinsried, Germany). CenpA-GFP was a gift from Aaron Straight (Stanford University, Stanford, CA).
G.T.C., D.A.M., and A.J.T. are funded by the Wellcome Trust. G.T.C. is in receipt of a Royal Society University Research Fellowship. E.M. is funded by a Dorothy Hodgkin fellowship from the Royal Society. A.J.T. is funded by The Great Ormond Street Children's Charity.
Authorship
Contribution: D.A.M. designed and executed experiments, analyzed data, and wrote the manuscript; E.M., L.V., and J.R. performed experiments and analyzed data; G.T.C. designed experiments and wrote the manuscript; and A.J.T. wrote the manuscript.
Conflict-of-interest disclosure: The authors declare no competing financial interests.
Correspondence: Dale A. Moulding, Molecular Immunology Unit and Centre for Immunodeficiency, UCL Institute of Child Health, 30 Guilford St, London, WC1 1EH, United Kingdom; e-mail: D.Moulding@ucl.ac.uk; or Adrian J. Thrasher, Molecular Immunology Unit and Centre for Immunodeficiency, UCL Institute of Child Health, 30 Guilford St, London, WC1 1EH, United Kingdom; e-mail: A.Thrasher@ucl.ac.uk.
