Abstract
Programmed cell death or apoptosis is a prominent feature of low-risk myelodysplastic syndromes (MDS), although the underlying mechanism remains controversial. High-risk MDS have less apoptosis associated with increased expression of the prosurvival BCL2-related proteins. To address the mechanism and pathogenic role of apoptosis and BCL2 expression in MDS, we used a mouse model resembling human MDS, in which the fusion protein NUP98-HOXD13 (NHD13) of the chromosomal translocation t(2;11)(q31;p15) is expressed in hematopoietic cells. Hematopoietic stem and progenitor cells from 3-month-old mice had increased rates of apoptosis associated with increased cell cycling and DNA damage. Gene expression profiling of these MDS progenitors revealed a specific reduction in Bcl2. Restoration of Bcl2 expression by a BCL2 transgene blocked apoptosis of the MDS progenitors, which corrected the macrocytic anemia. Blocking apoptosis also restored cell-cycle quiescence and reduced DNA damage in the MDS progenitors. We expected that preventing apoptosis would accelerate malignant transformation to acute myeloid leukemia (AML). However, contrary to expectations, preventing apoptosis of premalignant cells abrogated transformation to AML. In contrast to the current dogma that overcoming apoptosis is an important step toward cancer, this work demonstrates that gaining a survival advantage of premalignant cells may delay or prevent leukemic progression.
Introduction
Myelodysplastic syndromes (MDS) are a heterogeneous group of malignant clonal disorders of hematopoietic stem cells (HSCs), characterized by reduced peripheral blood cell counts (cytopenias) with dysplasia in one or more cell lineages and increased risk of progression to acute myeloid leukemia (AML).1 Apoptosis is a prominent feature of the World Health Organization (WHO) low-intermediate risk subgroups of MDS, although whether apoptosis is directly responsible for the cytopenias remains unproven. Mammals possess 2 major apoptotic pathways, the death receptor pathway and the BCL2-regulated (also called stress, mitochondrial, or intrinsic) pathway.2 Increased apoptosis in MDS has been attributed to activation of the death receptor pathway,3 although recent studies of a mouse model of the WHO del(5q) subtype have implicated the BCL2-regulated pathway through activation of TP53.4
As in other cancers,5,6 oncogene-induced apoptosis in MDS may function as a protective mechanism by reducing the pool of premalignant cells that can acquire additional genetic or epigenetic changes required for progression to AML. As such, overcoming apoptosis may be an important mechanism of malignant transformation to AML.6 Consistent with this notion, more aggressive, high-risk subgroups of MDS have an increased expression of antiapoptotic BCL2-related proteins relative to proapoptotic BH3-only proteins.7
One of the major hurdles of studying MDS is the genetic and cellular heterogeneity of human MDS and the inability to grow primary samples in vitro or in immune-deficient mouse strains. To this end, we have generated a transgenic mouse model of MDS by hematopoietic-expression of the fusion gene Nup98-HoxD13 (NHD13) of the t(2;11)(q31;p15) chromosomal translocation.8 The NHD13 model recapitulates many of the features of human MDS, with an early preleukemic phase of cytopenias and increased apoptosis in the bone marrow (BM) followed by the development of AML harboring mutations in genes such as N-Ras.9 Here, we used this MDS model to investigate the role of apoptosis in cytopenias and leukemic transformation.
Methods
Mice
The NHD13 mice previously described.8 Tnf−/− mice were kindly provided by Dr B. Saunders (University of Sydney).10 The Fasgld/gld mice were obtained from The Walter and Eliza Hall Institute for Medical Research, Melbourne.11 The BCL2 transgenic mice were kindly provided by Dr P. Bouillet and Professor J. Adams (The Walter and Eliza Hall Institute for Medical Research).12 All mice were maintained on a C57BL/6J background. All animal experiments were approved by the Animal Ethics Committee, University of Melbourne.
FACS analysis
BM samples were flushed from femora and tibiae into phosphate-buffered saline containing 2% fetal bovine serum (FBS). Antibodies and other reagents for staining were obtained from BD Pharmingen: annexin-V (51-6874) and Ki67 (B56) as fluorescein isothiocyanate (FITC) conjugates; c-KIT (Ack45), SCA (E13-161.7), CD8α (53-6.7), and mouse BCL2 (3F11) as phycoerythrin (PE) conjugates; CD4 (RM4-5), c-KIT (2B8) as allo-phycocyanin (APC) conjugates; SCA-1 (D7) as a tandem PE and Cy7 conjugate; γ-H2AX (20E3) as an Alexa-647 conjugate; and biotinylated Mac-1 (M1/70), Gr-1 (RB6-8C5), Ter-119, B220 (RA3-6B2), and CD3 (145-2C11). Second-stage reagents were either streptavidin (SAv) APC, Sav peridinin chlorophyll protein complex (PerCP), or SAv APC-Cy7. Cellular DNA content was determined by staining with 4′,6-diamidino-2-phenylindole (DAPI). Cell viability was measured by exclusion of propidium iodide (PI; Sigma-Aldrich). Caspase-3 activity levels were determined using the Vybrant assay kit (Molecular Probes; 35118). For cell permeabilization we used the BD cytofix/cytoperm kit was according to the manufacturer's instructions. Fluorescence-activated cell sorter (FACS) analysis was performed using a FACSCalibur or LSR-II instrument (BD Bioscience). Cell sorting was performed using a FACSAria instrument (BD Bioscience).
Hematopoietic progenitor assays
BM cells were seeded at a density of 5 × 10⁴ cells per 35-mm dish in semisolid agar for granulocyte macrophage (GM) colony growth. Cultures were incubated at 37°C in 10% CO2 for 7 days, stained with acetylcholinesterase and counted. For blast-forming units-erythroid (BFU-E) analysis, BM cells were seeded at 1 × 10⁵ cells per 35-mm dish in methylcellulose (Methocel, Fluka Biochemical). Cultures were incubated in 5% CO2 for 7 days, stained with diamino-benzidine and counted. All progenitor assays were performed in triplicate. Tumor necrosis factor (TNF) was dissolved in 2% FBS and added to cultures at the indicated concentrations. Micrographs were obtained on a Nikon Optiphot-2 using a 100× objective lens and a Zeiss Axiocam MRc5.
Western blotting
FACS-sorted Lineage−, Sca-1−, c-Kit+ (LK) cells were derived from 3 mice of the appropriate genotype. Freshly isolated thymocytes were cultured in DMEM + 10% FBS in the presence or absence of Fas ligand (FasL) for 3 hours. All cells were lysed in buffer containing 10mM N-2-hydroxyethylpiperazine-N-2-ethanesulfonic acid, 250mM Nonidet P-40, 5mM ethylene-diaminetetraacetic acid, and complete protease inhibitors (Roche). Proteins in cell lysates were separated by SDS-PAGE and transferred onto nitrocellulose membranes. Immunoblotting was performed with antibodies against caspase-8 (Cell Signaling; no. 9508) or β-actin (loading control; Santa Cruz; no. 1616) per the manufacturer's instructions. Immunoblots were developed using an enhanced chemiluminescence kit with the secondary antibodies therein (GE Healthcare).
Blood cell counts
Blood samples were collected into ethylenediaminetetraacetic acid–coated tubes and full blood counts were determined on an Advia 120 automated hematology analyzer.
Gene expression analysis
Microarray analyses were performed using the Illumina iScan microarray platform. Briefly, total RNA was isolated from FACS-sorted LK cells from the pooled BM from 3 mice of each genotype using the Trizol method and reverse transcribed using a T7–promoter-oligo(dT) primer. An in vitro transcription reaction with biotin labeled nucleotides (Ambion labeling protocol) was then performed, and the labeled cRNA samples were hybridized to the Illumina Mouse WG-6 Version 2.0 beadchip (45 281 transcripts), washed, and scanned on the Illumina iScan. The resulting image files were analyzed using Illumina Beadstudio GX Module software to generate quantitative expression scores with mean standard deviation and statistical evaluation of detection reliability averaged across the 30 to 50 built-in technical replicates for each transcript. Differences in gene expression levels between NHD13 mice and wild-type (WT) mice were determined using 3 replicates from each group. The data analysis software package GeneSpring Version 11.5.1 was used to detect fold-change differences of > 2 with a statistical significance of P < .05 using the Student t test on log transformed data. All microarray data are available on the Gene Expression Omnibus (GEO) database under accession no. GSE39692.
Quantitative RT-PCR
Total RNA was prepared from FACS-sorted LK cells using the Trizol (Invitrogen) reagent according to the manufacturer's instructions. cDNA was transcribed from 1 μg of RNA using the Roche transcriptor kit according to the manufacturer's instructions. Expression of Cdkn1a mRNA was quantified using the primer pair: sense 5′-ggtgggcccggaacatct-3′, antisense 5′-gggccctaccgtcctactaat-3′. Expression of BCL2 mRNA was quantified using the primer pair: sense 5′-gtacctgaaccggcatctg-3′, antisense 5′-ggggccatatagttccacaa-3′. Expression of Hoxc6 mRNA was quantified using the primer pair: sense 5′-cgaatgaattcgcacagtgg-3′, antisense 5′-cggttctggaaccagattttg-3′. Expression of Hoxb7 mRNA was quantified using the primer pair: sense 5′-ccctttgagcagaacctctcc-3′, antisense 5′-Gtctggtagcgcgtgtaggtc-3′. Expression of Hoxa9 mRNA was quantified using the primer pair: sense 5′-aaacaatgccgagaatgagagcgg-3′, antisense 5′-ttccgagtggagcgagcatgtagc-3′. Expression of Pbx3 mRNA was quantified using the primer pair: sense 5′-ccaaattgacccagatcagac-3′, antisense 5′-actgcttcacacgtgctttg-3′. Expression of all mRNA was normalized to expression of β-actin, which was quantified using the primer pair: sense 5′-gtacctgaaccggcatctg-3′, antisense 5′-ggggccatatagttccacaa-3′. Polymerase chain reaction (PCR) reactions using the Promega GoTaq mastermix were performed on a LightCycler480 (Roche). PCR cycling conditions included an initial denaturation (95°C 60 seconds) followed by 95°C 10 seconds, 55°C 10 seconds, and 72°C 30 seconds. Data were analyzed using the Roche LightCycler 480 software.
Statistics
The Student t test was used to determine significance of data, with the exception of animal survival studies for which we used the Mantel-Cox log rank test. All error bars represent the standard error of the mean (SEM).
Results
Increased apoptosis and proliferation of premalignant progenitor cells
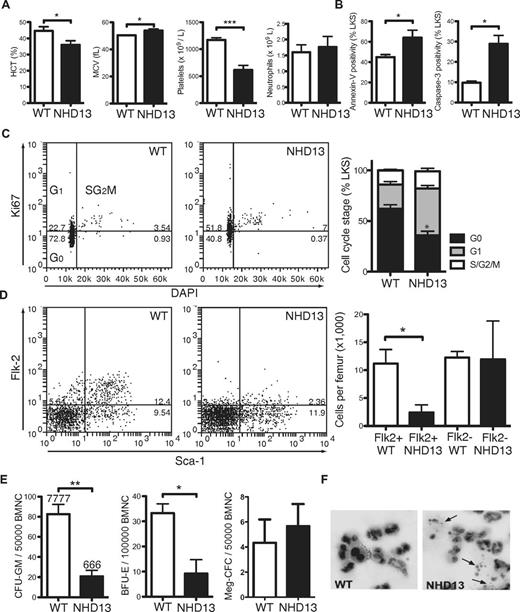
To characterize the apoptotic phenotype in early MDS, we analyzed NHD13 mice at 3 months of age, when the animals displayed macrocytic anemia (reduced hematocrit and elevated red cell mean cell volume; MCV) and thrombocytopenia despite normal neutrophil counts (Figure 1A). Lineage−, c-Kit+, Sca-1+ (LKS) cells, a BM fraction enriched for HSCs and multipotent progenitor cells (HSPCs), had increased apoptosis, as demonstrated by increased annexin-V expression and caspase-3 activation (Figure 1B). Increased apoptosis was also observed in the Lineage−, Sca-1−, c-Kit+ (LK) myeloerythroid progenitor cell fraction (supplemental Figure 1, available on the Blood Web site; see the Supplemental Materials link at the top of the online article). Staining of fixed LKS with the proliferation antigen Ki67 and the DNA fluorescent stain DAPI demonstrated reduced quiescence (G0) of NHD13 stem and progenitor cells (Figure 1C). Despite increased cell proliferation, total numbers of LKS cells were reduced 4-fold, because of loss of the more mature Flk2+ multipotent progenitor cell fraction (Figure 1D). Similar to human MDS,13 myeloid and erythroid progenitor cells displayed very poor in vitro growth with reduced numbers and size of colonies containing prominent numbers of dying cells (Figure 1E-F). Overall, these analyses of NHD13 hematopoietic progenitors revealed a picture typical of low-risk human MDS with increased cell proliferation and apoptosis.14
Increased apoptosis in BM from 3-month-old NHD13 mice. (A) Hematocrit (HCT), red cell mean cell volume (MCV), and platelet and neutrophil counts of 3-month-old NHD13 mice (n = 5) and WT (WT) littermate controls (n = 5). (B) Proportions of annexin-V–positive and cleaved (ie, active) caspase-3–positive LKS cells from WT and NHD13 mice assessed by FACS (n = 3 of each genotype). (C) Representative FACS plots from cell-cycle analysis of WT and NHD13 LKS cells, and collated data showing cell-cycle distribution (G0, G1, and combined S/G2/M) in WT (n = 6) and NHD13 (n = 4). * indicates G0P < .05 difference from WT. (D) Representative FACS plots and proportions of FLK2+ LKS (n = 3 per genotype). (E) Numbers of granulocyte and macrophage colonies (CFU-GM), BFU-E, and megakaryocytic colonies (Meg-CFC) in BM from WT and NHD13 mice (n = 3 per genotype). (F) Giemsa stain of granulocytes colonies grown in semisolid agar demonstrating apoptotic bodies (arrows) in NHD13 granulocyte colonies. Error bars throughout represent the SEM (*P < .05; **P < .01; ***P < .001).
Increased apoptosis in BM from 3-month-old NHD13 mice. (A) Hematocrit (HCT), red cell mean cell volume (MCV), and platelet and neutrophil counts of 3-month-old NHD13 mice (n = 5) and WT (WT) littermate controls (n = 5). (B) Proportions of annexin-V–positive and cleaved (ie, active) caspase-3–positive LKS cells from WT and NHD13 mice assessed by FACS (n = 3 of each genotype). (C) Representative FACS plots from cell-cycle analysis of WT and NHD13 LKS cells, and collated data showing cell-cycle distribution (G0, G1, and combined S/G2/M) in WT (n = 6) and NHD13 (n = 4). * indicates G0P < .05 difference from WT. (D) Representative FACS plots and proportions of FLK2+ LKS (n = 3 per genotype). (E) Numbers of granulocyte and macrophage colonies (CFU-GM), BFU-E, and megakaryocytic colonies (Meg-CFC) in BM from WT and NHD13 mice (n = 3 per genotype). (F) Giemsa stain of granulocytes colonies grown in semisolid agar demonstrating apoptotic bodies (arrows) in NHD13 granulocyte colonies. Error bars throughout represent the SEM (*P < .05; **P < .01; ***P < .001).
Apoptosis is not because of activation of the death receptor pathway
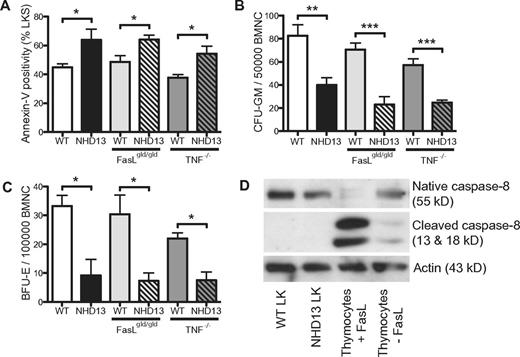
Excessive apoptosis in MDS has been attributed to activation of the death receptor pathway within an abnormal BM microenvironment.15 To assess the role of the death receptor pathway in the apoptosis of NHD13 hematopoiesis, we crossed NHD13 mice with mice deficient in TNF (Tnf–/–)10 or Fasl (Faslgld/gld).11 The extent of apoptosis in BM from NHD13/Tnf–/– and NHD13/Faslgld/gld mice was comparable with control NHD13 mice, with no decrease in the proportion of annexin-V+ LKS cells or rescue of the in vitro progenitor growth defects (Figure 2A-C). Peripheral blood counts were also similarly affected by the NHD13 transgene regardless of background (supplemental Figure 2). To exclude activation of the death receptor pathway by other ligands, we examined for the presence of cleaved (activated) caspase-8, an essential component of this pathway.16 Western blot analysis of LK cells from NHD13 and WT littermate control mice did not reveal detectable levels of the activated form of caspase-8 (Figure 2D). WT thymocytes with or without Fasl served as controls, with a marked increase in cleaved caspase-8 seen with Fasl. These results suggest that activation of the death receptor pathway was unlikely to be an important mechanism of apoptosis in NHD13 hematopoiesis.
The apoptosis in NHD13 progenitors is not mediated by the death receptor pathway. (A) Proportions of annexin-V–positive LKS cells assessed by FACS (n = 3 of each geneotype). (B) CFU-GM and (C) BFU-E numbers in WT and NHD13 BM on WT, FasLgld/gld or TNF−/− backgrounds (n = 3 of each genotype). (D) Western blot showing the presence of native and cleaved (active) caspase 8 in WT LK cells, NHD13 LK cells, WT thymocytes treated with or without FasL. Actin is shown as a loading control. All experiments performed using 3-month-old mice. Error bars represent the SEM (*P < .05; ***P < .001).
The apoptosis in NHD13 progenitors is not mediated by the death receptor pathway. (A) Proportions of annexin-V–positive LKS cells assessed by FACS (n = 3 of each geneotype). (B) CFU-GM and (C) BFU-E numbers in WT and NHD13 BM on WT, FasLgld/gld or TNF−/− backgrounds (n = 3 of each genotype). (D) Western blot showing the presence of native and cleaved (active) caspase 8 in WT LK cells, NHD13 LK cells, WT thymocytes treated with or without FasL. Actin is shown as a loading control. All experiments performed using 3-month-old mice. Error bars represent the SEM (*P < .05; ***P < .001).
BCL2 prevents apoptosis and restores blood counts
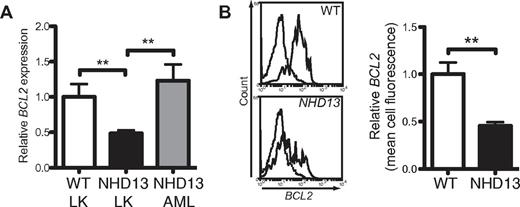
We compared the gene expression profile of LK cells isolated from 3-month-old NHD13 and WT mice to identify factors that might explain the increased apoptosis in NHD13 hematopoiesis (supplemental Table 1). The most dramatic changes were increased expression of a number of homeobox genes (Hoxc6, Hoxb7, Hoxa9, and Pbx3), many of which have been implicated in MDS and AML.17 Analysis of genes regulating apoptosis revealed no abnormal expression of components of the death receptor pathway, consistent with our earlier findings (Figure 2). The major apoptosis-related abnormality was a 3.6-fold reduction in Bcl2 (supplemental Table 1). Quantitative reverse transcription (qRT)–PCR confirmed reduced expression of Bcl2 in LK cells (Figure 3A). Reduced expression of BCL2 protein in NHD13 LK cells was confirmed by flow cytometry (Figure 3B). Expression analysis of BCL2-related genes using a published array dataset of CD34+ purified MDS BM cells18 revealed a significant reduction in BCL2 in the del(5q) subset (supplemental Figure 3), where apoptosis was linked to activation of the intrinsic pathway.4 Increased expression of the proapoptotic genes BID and PUMA and the antiapoptotic gene BCL-X were also observed in the del5q subset but these changes were less marked and were not reflected in the NHD13 progenitors.
Bcl2 expression is reduced in NHD13 LK cells. (A) Quantification of Bcl2 levels by qRT-PCR in LK cells from WT and NHD13 mice (n = 3 of each genotype, each sample is a pool of 3 mice) and marrow cells from NHD13 mice which developed AML (n = 5; **P < .01). (B) Representative histograms of Bcl2 protein in WT and NHD13 LK cells measured by FACS. The dashed lines represent the isotype controls. The mean cell fluorescence of Bcl2 protein in NHD13 LK cells relative to WT LK cells was calculated from 3-month-old mice (n = 3 of each genotype).
Bcl2 expression is reduced in NHD13 LK cells. (A) Quantification of Bcl2 levels by qRT-PCR in LK cells from WT and NHD13 mice (n = 3 of each genotype, each sample is a pool of 3 mice) and marrow cells from NHD13 mice which developed AML (n = 5; **P < .01). (B) Representative histograms of Bcl2 protein in WT and NHD13 LK cells measured by FACS. The dashed lines represent the isotype controls. The mean cell fluorescence of Bcl2 protein in NHD13 LK cells relative to WT LK cells was calculated from 3-month-old mice (n = 3 of each genotype).
The relative expression of the antiapoptotic BCL2-related proteins is increased in higher risk human MDS.19 Similarly, Bcl2 expression was higher in AML cells arising in NHD13 mice (Figure 3A). Therefore, the NHD13 mouse model of MDS parallels the temporal changes in BCL2-related proteins seen in human MDS.
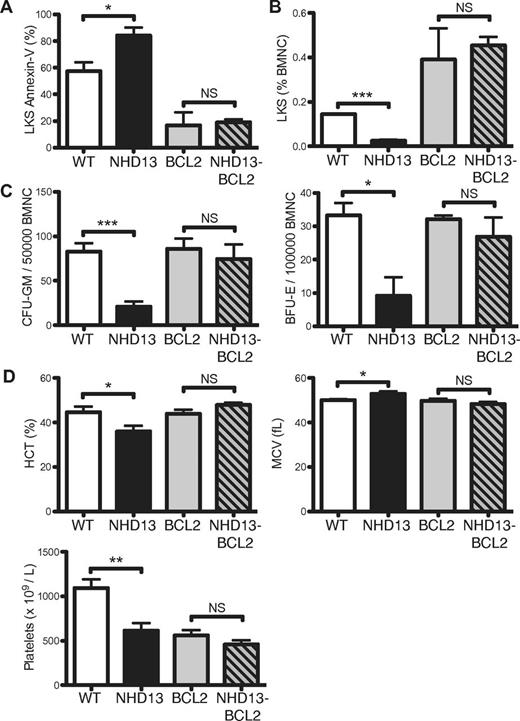
To evaluate the impact of reduced expression of BCL2 in early MDS, NHD13 mice were crossed with BCL2 transgenic mice, which express human BCL2 in all hematopoietic cells.12 Using qRT-PCR primers that amplify both mouse and human BCL2 mRNA, we found that levels of BCL2 in LK cells from NHD13/BCL2 mice were increased 10-fold compared with WT LK cells (supplemental Figure 4). Enforced BCL2 expression inhibited apoptosis of LKS cells (Figure 4A), which restored the numbers of LKS cells to levels comparable with BCL2 littermate controls (Figure 4B). Reduced apoptosis and increased numbers of LKS in H2K-BCL2 transgenic mice was previously reported.20 In addition to rescue of cell survival and cell numbers, BCL2 overexpression restored the in vitro growth of myeloid and erythroid NHD13 progenitors (Figure 4C).
Enforced BCL2 expression inhibits the excess apoptosis of NHD13 hematopoietic progenitors. (A) Proportions of annexin-V–positive LKS cells from WT, NHD13, BCL2, and NHD13/BCL2 mice (n = 3 of each genotype). (B) Proportions of LKS cells in BM from 3 mice of each genotype. (C) CFU-GM and BFU-E numbers in BM from 3 mice of each genotype. (D) Hematocrit (HCT), red cell mean cell volume (MCV), and platelet count of 5 mice of each genotype. All measurements were made on 3-month-old mice. Error bars represent the SEM (NS indicates P > .05; *P < .05; **P < .01; ***P < .001).
Enforced BCL2 expression inhibits the excess apoptosis of NHD13 hematopoietic progenitors. (A) Proportions of annexin-V–positive LKS cells from WT, NHD13, BCL2, and NHD13/BCL2 mice (n = 3 of each genotype). (B) Proportions of LKS cells in BM from 3 mice of each genotype. (C) CFU-GM and BFU-E numbers in BM from 3 mice of each genotype. (D) Hematocrit (HCT), red cell mean cell volume (MCV), and platelet count of 5 mice of each genotype. All measurements were made on 3-month-old mice. Error bars represent the SEM (NS indicates P > .05; *P < .05; **P < .01; ***P < .001).
Apoptosis is a postulated mechanism of cytopenias in MDS although there is little direct evidence to support this hypothesis.21 In the NHD13 mice, blocking apoptosis corrected the macrocytic anemia of 3-month-old mice (Figure 4D). Platelet numbers were not restored to WT levels, although they were comparable with the platelet numbers observed in the BCL2 mice (Figure 4D), which are known to be thrombocytopenic.12 Thus, apoptosis was an important mechanism of cytopenia in this model.
Blocking apoptosis by enforced BCL2 expression suggested a cell intrinsic trigger of cell death.2 However, BCL2 can inhibit extrinsic triggers of apoptosis in so-called type II cells (hepatocytes, β-cells of the pancreas and neutrophils) by antagonizing tBID, a proapoptotic BH3-only protein that is activated by caspase-8 in response to death receptor stimulation.22-25 However, we found that BCL2 overexpression was unable to inhibit TNF-induced apoptosis of myeloid progenitor cells (supplemental Figure 5) and given there was no demonstrable activated caspase 8 (Figure 2D), it seemed unlikely that BCL2 was inhibiting apoptosis through the death receptor pathway.
Overexpression of BCL2 prevents leukemic transformation
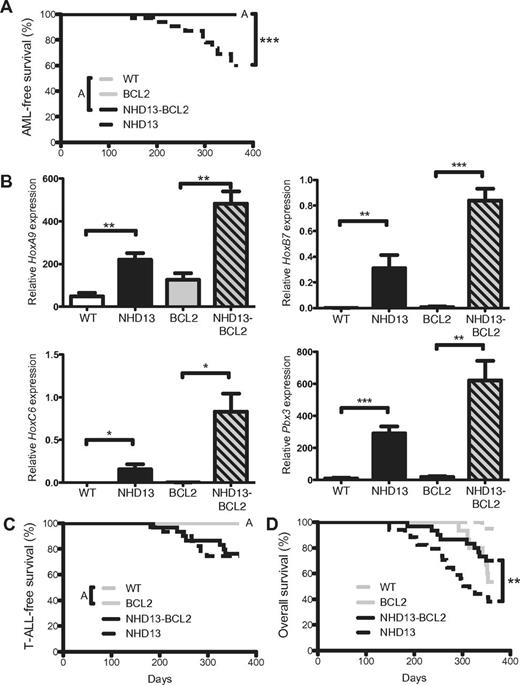
Leukemic transformation of MDS is associated with higher expression of BCL27 and experimentally, Bcl2 and mutant N-ras cooperate to generate a mouse model of MDS.26 In other disease models, enforced expression of BCL2 accelerates Myc-induced malignancies.27-29 To evaluate the effect of BCL2 expression in leukemic transformation of MDS, we followed cohorts of mice for 12 months. Consistent with our previous data,8 43% of NHD13 mice (9 of 21) succumbed to AML by 12 months of age (Figure 5A). In contrast and contrary to expectation, none of the 27 NHD13/BCL2 mice developed AML within this time frame despite abnormal expression of the homeobox genes to levels greater than NHD13 alone (Figure 5B). The absence of AML in NHD13/BCL2 mice was not attribution to early deaths from T-cell acute lymphoblastic leukemia (T-ALL), which developed in NHD13 mice at a similar frequency and onset (Figure 5C). Follicular-like B-cell lymphomas were the predominant cause of death in BCL2 mice as previously described.30 Consequently, the difference in overall survival between NHD13/BCL2 and NHD13 mice was explained by the prevention of AML (Figure 5D). Thus, apoptosis is required for transformation of premalignant cells in this disease model.
BCL2 prevents transformation of MDS to AML in NHD13 mice. (A) Kaplan-Meier AML-free survival of WT (n = 20), NHD13 (n = 34), BCL2 (n = 23), and NHD13/BCL2 (n = 29) mice. Mice that died from causes other than AML were censored at time of death. Note that WT, BCL2, and NHD13/BCL2 lines are overlaid (indicated by A). (B) Q-RT-PCR analysis of HoxA9, HoxB7, HoxC6, and Pbx3 expression in LK cells of each indicated genotype (n = 3 of each genotype). (C) T-ALL–free survival in the same cohorts of mice. Mice that died from causes other than T-ALL were censored at time of death. Note that the WT and BCL2 lines are overlaid (indicated by A). (D) Overall survival of the same cohorts of mice. P values indicate difference from the survival of NHD13 mice. (*P < .05; **P < .01; ***P < .001).
BCL2 prevents transformation of MDS to AML in NHD13 mice. (A) Kaplan-Meier AML-free survival of WT (n = 20), NHD13 (n = 34), BCL2 (n = 23), and NHD13/BCL2 (n = 29) mice. Mice that died from causes other than AML were censored at time of death. Note that WT, BCL2, and NHD13/BCL2 lines are overlaid (indicated by A). (B) Q-RT-PCR analysis of HoxA9, HoxB7, HoxC6, and Pbx3 expression in LK cells of each indicated genotype (n = 3 of each genotype). (C) T-ALL–free survival in the same cohorts of mice. Mice that died from causes other than T-ALL were censored at time of death. Note that the WT and BCL2 lines are overlaid (indicated by A). (D) Overall survival of the same cohorts of mice. P values indicate difference from the survival of NHD13 mice. (*P < .05; **P < .01; ***P < .001).
Blocking apoptosis restores quiescence and reduces DNA damage
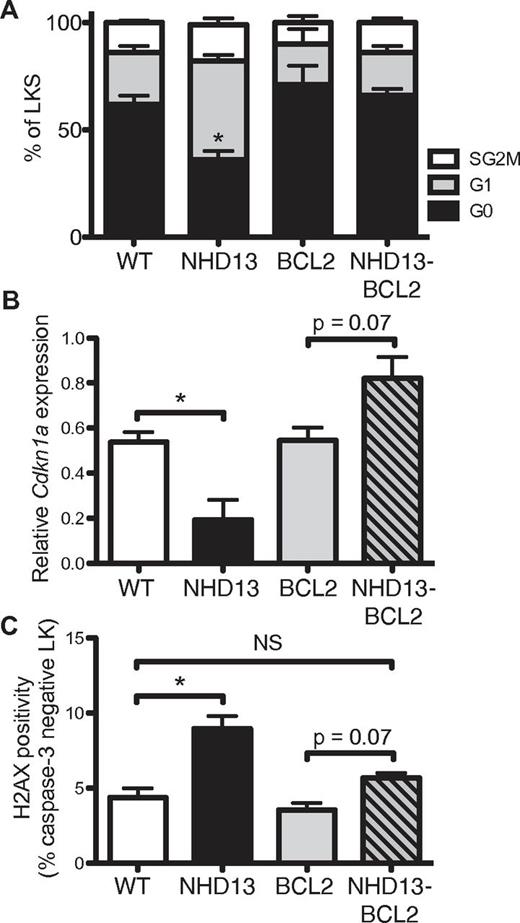
Apoptosis is required for the formation of γ-radiation–induced thymic lymphoma.31,32 In that model, it was postulated that preventing γ-radiation–induced apoptosis by BCL2 overexpression or deficiency of the proapoptotic BH3-only protein PUMA (essential for DNA damage-induced, p53-mediated apoptosis) abrogated compensatory proliferation and replication stress-associated DNA damage of BM-derived LKS cells, the cell of origin of thymic lymphoma. To determine whether a similar mechanism underpinned the prevention of AML from premalignant NHD13 progenitors, we examined the cell cycle of the LKS population in NHD13/BCL2 mice (Figure 6A). Expression of the BCL2 transgene alone had no significant effect on cell quiescence, but BCL2 overexpression in NHD13 LKS cells corrected the cell-cycle defect seen in NHD13 progenitors.
BCL2 restores cell-cycle quiescence and limits DNA damage in NHD13 progenitors. (A) Cell-cycle distribution (G0, G1, and combined S/G2/M) of LKS cells from WT (n = 6), NHD13 (n = 4), BCL2 (n = 5), and NHD13/BCL2 (n = 5) mice (* indicates G0P < .05 difference from WT). (B) Cdkn1a mRNA expression in LK cells from 3 mice of each genotype. (C) FACS quantification of γH2AX levels in nonapoptotic (caspase-3–negative) LK cells from 3 mice of each genotype (NS indicates P > .05; *P < .05).
BCL2 restores cell-cycle quiescence and limits DNA damage in NHD13 progenitors. (A) Cell-cycle distribution (G0, G1, and combined S/G2/M) of LKS cells from WT (n = 6), NHD13 (n = 4), BCL2 (n = 5), and NHD13/BCL2 (n = 5) mice (* indicates G0P < .05 difference from WT). (B) Cdkn1a mRNA expression in LK cells from 3 mice of each genotype. (C) FACS quantification of γH2AX levels in nonapoptotic (caspase-3–negative) LK cells from 3 mice of each genotype (NS indicates P > .05; *P < .05).
To explore the cell-cycle changes, we examined expression of the major cell-cycle regulators: Cdkn1a (p21) and Cdkn1b (p27). The reduced quiescence of premalignant NHD13 progenitors correlated with reduced expression of p21 (Figure 6B) with no detectable change in p27 (supplemental Figure 6). Thus, the restoration of cell quiescence may be explained by increased p21 expression in NHD13/BCL2 premalignant cells.
Replicative stress induced by oncogenes leads to the formation of DNA double-strand breaks (DSBs).5 H2AX is a variant H2A histone protein, which becomes phosphorylated (γH2AX) when associated with DSBs, and can thereby be used as a marker of DSB occurrence. Consistent with oncogene-induced DNA damage, NHD13 progenitor cells had increased γH2AX as measured by a flow-based assay that enabled exclusion of apoptotic cells by costaining for activated caspase-3 (Figure 6C, supplemental Figure 7). Coexpression of the BCL2 transgene reduced γH2AX levels to WT levels, although they remained higher than BCL2 transgenic cells. Overall, these results demonstrate that BCL2 expression in premalignant progenitors restores cell-cycle quiescence and reduces the formation of DSBs.
Discussion
Using a transgenic model of MDS that recapitulates many of the clinical features of human disease, we show that BCL2 can block apoptosis, which improves peripheral blood counts and unexpectedly prevents disease progression. This supports and extends recent in vitro experiments that show retroviral expression of BCL2 rescued increased apoptosis of erythroid cells from low-risk subtypes of human MDS.33 BCL2 can prevent TNF or FAS ligand-induced apoptosis of hepatocytes, β-cells of the pancreas and neutrophils through cleavage of BID by caspase 8.22,24,25 However, apoptosis of myeloid and erythroid progenitors still occurred in NHD13 mice lacking Fasl and Tnf. Furthermore, there was no detectable activated caspase 8 in NHD13 progenitors, and BCL2 did not block TNF-induced cell death. Although we cannot exclude some contribution from the extrinsic pathway, these findings suggest that BCL2 prevented apoptosis by inhibiting the BCL2-regulated pathway of apoptosis. The most probable trigger is oncogenic proliferative stress and DNA damage, as demonstrated by the reduced cell quiescence and increased γ-H2AX in NHD13 progenitors.
Prevention of apoptosis by overexpression of BCL2 restored the red blood cell count of NHD13 mice. BCL2 transgenic mice have thrombocytopenia of unknown mechanism. Expression of the NHD13 transgene did not exacerbate this thrombocytopenia, indicating a relative rescue of thrombocytopenia. This provides in vivo evidence that apoptosis is an important contributor to the cytopenias of MDS and raises the therapeutic potential of blocking apoptosis to improve blood counts in early MDS. A major caveat of this approach would be the concern of promoting leukemic transformation, which is associated with elevated BCL2 levels.7 However, we found that blocking apoptosis by BCL2 paradoxically prevented leukemic transformation despite increased numbers of premalignant progenitor cells with an “oncogenic” gene expression profile, such as expression of Hox genes. This result contrasts with other mouse models of cancer, where overexpression of BCL2 promoted cancer progression. One speculative explanation for the disparate effects may be the different cell-of-origin of the cancers. BCL2 accelerates leukemias in Eμ-Myc and MRP8-PMLRARα transgenic mice, both models of progenitor-derived malignancies.29,34 In contrast, the NHD13 acute myeloid leukemias are probably derived from HSCs,35 which respond differently to DNA damage.36
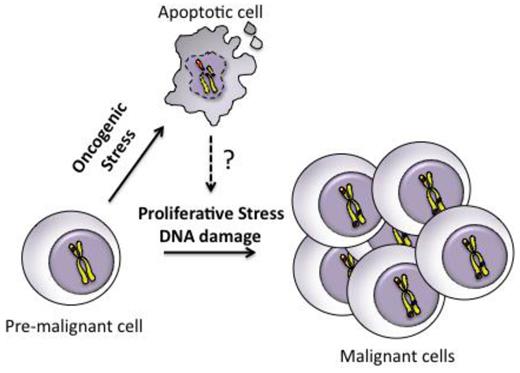
Recently, we have shown that blocking apoptosis by BCL2 (or absence of Puma) prevents the development of γ-radiation–induced thymic lymphoma.31 In that model, preventing apoptosis reduced the compensatory proliferation of hematopoietic stem/progenitor cells bearing radiation-induced oncogenic lesions. Here, we show that preventing apoptosis of NHD13 progenitors had a similar effect on cell cycle, with restoration of cellular quiescence. This suggests the abnormal cell cycle of NHD13 progenitors was mediated by apoptosis rather than a direct effect of the NHD13 oncogene (Figure 7). Increased apoptosis may also explain the increased proliferation observed in human MDS.14 It is not clear how apoptosis drives proliferation in the setting of oncogenic stress but one possibility is the release of mitogens such as Wnt3a and prostaglandin E2 by apoptotic cells, which is important for tissue regeneration.37 Alternatively, BCL2 may directly slow cell-cycle re-entry from G038 , although no such effect was seen in BCL2 mice (Figure 6A). Collectively, we propose that inhibition of apoptosis by BCL2 reduces replicative stress and DNA damage in premalignant cells, which reduces genomic instability, an important mechanism of acquiring additional genetic mutations for cancer progression (Figure 7).
Model of how apoptosis can promote malignant transformation of premalignant cells. Premalignant cells harboring a single oncogenic lesion undergo apoptosis triggered by oncogenic stress. Apoptosis promotes proliferative stress and DNA damage through unknown mechanisms, which leads to genomic instability and accumulation of additional genetic events necessary for progression to an aggressive malignancy.
Model of how apoptosis can promote malignant transformation of premalignant cells. Premalignant cells harboring a single oncogenic lesion undergo apoptosis triggered by oncogenic stress. Apoptosis promotes proliferative stress and DNA damage through unknown mechanisms, which leads to genomic instability and accumulation of additional genetic events necessary for progression to an aggressive malignancy.
Several caveats of this work should be recognized. First, the NHD13 translocation is a rare cause of human MDS and therefore, the results may not reflect other genetic causes of human MDS. Second, expression of the transgene generates much higher levels of BCL2 than observed in advanced human MDS. Third, expression of the BCL2 transgene occurs at the same time as the initiating event and therefore increased expression of BCL2 in higher risk MDS may have a different outcome. Nevertheless, in this model of multistep oncogenesis, we show that gaining a survival advantage of premalignant cells may delay or prevent leukemic progression. These results raise a practical concern that inducing apoptosis by chemotherapy may be counter-productive, particularly in premalignant diseases, such as low-risk MDS. Although we have not directly addressed this possibility, a recent report has shown that radiation-induced killing can promote tumor regrowth by a caspase dependent mechanism.39 Finally, our findings raise the possibility that inhibitors of apoptosis may be useful for improving cytopenias and delaying leukemic progression in low-risk MDS.
The online version of this article contains a data supplement.
The publication costs of this article were defrayed in part by page charge payment. Therefore, and solely to indicate this fact, this article is hereby marked “advertisement” in accordance with 18 USC section 1734.
Acknowledgments
The authors thank Dr J. Adams, Dr P. Bouillet, and Dr B. Saunders for providing mouse strains; Dr C. Scott for providing reagents; Dr M. Guthridge, Dr S. Dworkin, and Dr A. Wei for insightful conversations; S. Beeraka, S. Vasudevan, and J. Corbin for technical assistance; S. Zahra, L. Ta, and L. Mizhiritsky for animal husbandry; and C. Li for flow cytometry.
This work was supported by the National Health and Medical Research Council of Australia (Project Grant 628367, Program Grant 461221, NHMRC Australia Fellowship), the Cancer Council of Victoria, the Leukemia & Lymphoma Society (SCOR grant no. 7413), the National Institutes of Health (CA43540), and operational infrastructure grants through the Australian Government IRISS and the Victorian State Government OIS. This research was supported by the Intramural Research Program of the National Institutes of Health, National Cancer Institute.
National Institutes of Health
Authorship
Contribution: C.I.S. and D.J.C. conceived the project; C.I.S., S.M.J., and D.J.C. designed the experiments and wrote the paper; C.I.S., J.S., and D.J.C. performed the experiments; J.J. performed the bioinformatics analysis; and all authors discussed the interpretation of data and had intellectual input into the final paper.
Conflict-of-interest disclosure: C.I.S. and P.D.A. receive royalties from the National Institutes of Health Technology Transfer office for the invention of NUP98-HOXD13 mice. The remaining authors declare no competing financial interests.
Correspondence: Christopher Slape, Monash University, Central Clinical School, The Alfred Centre, 99 Commercial Road, Melbourne 3004, Australia; e-mail: christopher.slape@monash.edu.

This feature is available to Subscribers Only
Sign In or Create an Account Close Modal