Abstract
The MUC1-C oncoprotein is aberrantly expressed in most multiple myeloma cells. However, the functional significance of MUC1-C expression in multiple myeloma is not known. The present studies demonstrate that treatment of multiple myeloma cells with a MUC1-C inhibitor is associated with increases in reactive oxygen species (ROS), oxidation of mitochondrial cardiolipin, and loss of the mitochondrial transmembrane potential. The MUC1-C inhibitor-induced increases in ROS were also associated with down-regulation of the p53-inducible regulator of glycolysis and apoptosis (TIGAR). In concert with the decrease in TIGAR expression, which regulates the pentose phosphate pathway, treatment with the MUC1-C inhibitor reduced production of NADPH, and in turn glutathione (GSH) levels. TIGAR protects against oxidative stress-induced apoptosis. The suppression of TIGAR and NADPH levels thus contributed to ROS-mediated late apoptosis/necrosis of multiple myeloma cells. These findings indicate that multiple myeloma cells are dependent on MUC1-C and TIGAR for maintenance of redox balance and that targeting MUC1-C activates a cascade involving TIGAR suppression that contributes to multiple myeloma cell death.
Introduction
Multiple myeloma is an incurable hematologic disorder that is characterized by the clonal proliferation of malignant plasma cells. Targeted agents, such as the proteosome inhibitor, bortezomib, and the immunomodulatory agent lenalidamide, have extended overall survival for patients with multiple myeloma.1 However, invariably, patients eventually relapse and succumb to this disease, emphasizing the need for additional therapeutic targets.
Mucin 1 (MUC1) is a heterodimeric protein that is aberrantly expressed in most multiple myeloma cell lines and primary patient samples.2-8 The extracellular MUC1 N-terminal subunit (MUC1-N) contains glycosylated tandem repeats that are a characteristic of mucin family members.9 MUC1-N forms a complex with the transmembrane MUC1 C-terminal subunit (MUC1-C) at the cell surface.9 MUC1-C consists of a 58 amino acid extracellular domain that associates with galectin-3,10 and a 72 amino acid cytoplasmic domain that interacts with diverse effectors that have been linked to transformation.9 In this regard, MUC1-C expression is sufficient to induce anchorage-independent growth and tumorigenicity.11,12 In addition to localization in the cell membrane, MUC1-C is detectable in the cytoplasm of multiple myeloma cells and is targeted to the nucleus.13 Of functional relevance, MUC1-C expression in multiple myeloma cells is associated with activation of the Wnt/β-catenin and NF-κB RelA pathways.8 Moreover, silencing MUC1-C in multiple myeloma cells results in slowing of proliferation and enhanced sensitivity to apoptosis, and loss of self-renewal in the response to melphalan and dexamethasone.8 These findings thus provided support for the involvement of MUC1-C in multiple myeloma cell growth and survival.
The MUC1-C cytoplasmic domain contains a CQC motif that is necessary for its oligomerization and thereby its nuclear localization.14 Based on these findings, cell-penetrating peptide drugs were developed to inhibit MUC1-C oligomerization and its oncogenic function.15 The peptide inhibitors contain the MUC1-C CQCRRKN amino acid sequence linked at the N-terminus to 9 arginine residues for cell permeability.15,16 Treatment of multiple myeloma cells with MUC1-C inhibitors blocked the interaction between MUC1-C and NF-κB RelA, and constitutive activation of the NF-κB pathway.16 In addition, MUC1-C inhibitor treatment of multiple myeloma cell lines and primary multiple myeloma cells, but not normal B cells, was associated with loss of survival.16 Inhibition of MUC1-C also induced regressions of established multiple myeloma tumor xenografts in mouse models.16 How MUC1-C inhibition affects multiple myeloma cell growth and survival is not known. However, studies in carcinoma cells have demonstrated that MUC1-C protects against increases in reactive oxygen species (ROS) and oxidative stress-induced cell death.17-20 In that sense, previous work has shown that multiple myeloma cells are sensitive to the generation of ROS in response to treatment with bortezomib and certain other agents.21-23
The present studies demonstrate that treatment of multiple myeloma cells with the MUC1-C inhibitor, GO-203, is associated with increases in ROS and significant down-regulation of the TP53-induced glycolysis and apoptosis regulator (TIGAR). Like MUC1-C, TIGAR decreases intracellular ROS levels and protects cells against ROS-induced cell death.24 The present results further show that MUC1-C inhibition in multiple myeloma cells is associated with depletion of NADPH and GSH, which in turn promotes the induction of late apoptosis/necrosis in the response to oxidative stress.
Methods
Cell culture
Human U266, RPMI8226, and KMS28PE multiple myeloma cells (ATCC) were cultured in RPMI 1640 medium (Cellgro) supplemented with 10% heat-inactivated FBS, 100 units/mL penicillin, 100 μg/mL streptomycin, and 2mM l-glutamine. Cells were treated with the cell-penetrating GO-203 ([R]9-CQCRRKN; D-amino acids) and CP-2 ([R]9-AQARRKN; D-amino acids) peptides16 (AnaSpec), N-acetyl-cysteine (NAC; Calbiochem), or glutathione (GSH; Sigma-Aldrich). Cells were also transfected with control and TIGAR siRNA pools (Dharmacon) in the presence of oligofectamine (Invitrogen).
Measurement of ROS levels and cardiolipin oxidation
For assessment of superoxide (O2−) levels, cells were incubated with 2μM hydroethidine (HE; Polyscience) for 30 minutes at 37°C. Superoxide-mediated conversion of HE to ethidium was measured in a flow cytometer at an excitation wavelength of 470 nm and an emission wavelength of 590 nm. Cells were incubated with 5μM carboxy-H2DCFDA (Molecular Probes) for 30 minutes at 37°C to assess hydrogen peroxide (H2O2)–mediated oxidation to the fluorescent compound DCF as measured by excitation at 480 nm and emission at 590 nm. Cardiolipin oxidation was determined by incubating cells with 50nM nonyl acridine orange (NAO; Invitrogen) for 30 minutes at 37°C and analysis at an emission wavelength of 640 nm as described.25
Immunoblot analysis
Cell lysates were prepared as described.16 Soluble proteins were analyzed by immunoblotting with anti-TIGAR (Abcam), anti–β-F1-ATPase (Molecular Probes), and anti–β-actin (Sigma-Aldrich).
RT-PCR
Total cellular RNA was extracted in Trizol as described.20 TIGAR-specific primers (5′-CTCCAGTGATCTCATGAG-3′ and 5′-AGACACTGGCTGCTAATC-3′).26 RNA-specific primers for human β-actin were used for the control.20 The RNA was reverse transcribed and amplified using SuperScript One-Step RT-PCR with Platinum Taq (Invitrogen). Amplified fragments were analyzed by electrophoresis in 2% agarose gels.
Determination of NADPH and GSH levels
Intracellular NADPH concentrations were measured using the Enzychrom NADP/NADPH Assay Kit (BioAssay Systems). Intracellular GSH concentrations were measured using the Bioxytech GSH-400 kit (OXIS International).
Analysis of mitochondrial transmembrane potential
Cells were incubated with 50 ng/mL rhodamine 123 (Molecular Probes) in PBS for 30 minutes at 37°C and then monitored by flow cytometry.
Measurement of ATP levels
Intracellular ATP concentrations were determined using an ATP determination kit (Molecular Probes).
Analysis of cell death
Cells were incubated with propidium iodide (PI)/annexin V–FITC (BD BioSciences) for 15 minutes at room temperature and then analyzed by flow cytometry.
Results
Inhibition of MUC1-C increases superoxides and hydrogen peroxide in multiple myeloma cells
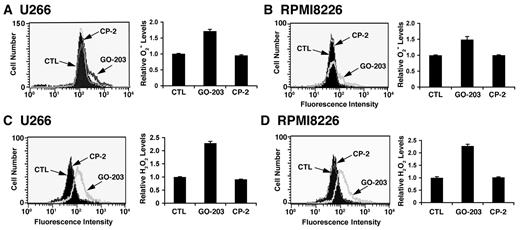
Overexpression of the MUC1-C oncoprotein attenuates increases in ROS in the cellular response to stress.17-20 In concert with this function, treatment of U266 multiple myeloma cells with the MUC1-C inhibitor, GO-203, was associated with increases in superoxide levels (Figure 1A left and right). By contrast, the inactive analog, CP-2, had no apparent effect (Figure 1A left and right). Similar results were obtained in GO-203–treated RPMI8226 multiple myeloma cells (Figure 1B left and right). This effect of MUC1-C inhibition was extended with an analysis of hydrogen peroxide levels. As found for superoxides, treatment of U266 cells with GO-203 was associated with increases in hydrogen peroxide (Figure 1C left and right). RPMI8266 cells also responded to GO-203 treatment with up-regulation of hydrogen peroxide levels (Figure 1D left and right). These findings indicate that inhibition of MUC1-C disrupts redox balance in multiple myeloma cells with increases in superoxides and hydrogen peroxide.
GO-203 increases superoxide (O2−) and hydrogen peroxide (H2O2) levels in multiple myeloma cells. (A-D) U266 (A,C), and RPMI8226 (B,D) cells were left untreated, and treated with 5μM GO-203 or 5μM CP-2 each day for 2 days. (A-B) The cells were incubated with hydroethidine for 30 minutes. Fluorescence of oxidized hydroethidine was determined by flow cytometry (left). The results are expressed as the relative superoxide level (mean ± SD of 3 determinations) compared with that obtained for untreated cells (right). (C-D) The U266 (C) and RPMI8226 (D) cells were incubated with c-H2DCFDA for 30 minutes. Fluorescence of oxidized DCF was measured by flow cytometry (left). The results are expressed as the relative hydrogen peroxide level (mean ± SD of 3 determinations) compared with that obtained for control cells (right).
GO-203 increases superoxide (O2−) and hydrogen peroxide (H2O2) levels in multiple myeloma cells. (A-D) U266 (A,C), and RPMI8226 (B,D) cells were left untreated, and treated with 5μM GO-203 or 5μM CP-2 each day for 2 days. (A-B) The cells were incubated with hydroethidine for 30 minutes. Fluorescence of oxidized hydroethidine was determined by flow cytometry (left). The results are expressed as the relative superoxide level (mean ± SD of 3 determinations) compared with that obtained for untreated cells (right). (C-D) The U266 (C) and RPMI8226 (D) cells were incubated with c-H2DCFDA for 30 minutes. Fluorescence of oxidized DCF was measured by flow cytometry (left). The results are expressed as the relative hydrogen peroxide level (mean ± SD of 3 determinations) compared with that obtained for control cells (right).
Inhibition of MUC1-C decreases TIGAR expression
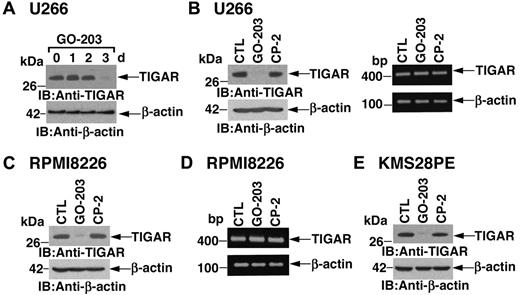
ROS levels are regulated in part by TIGAR, a p53-inducible protein that regulates glycolysis and protects against oxidative stress.24 Notably, in U266 cells, inhibition of MUC1-C with GO-203 was associated with marked down-regulation of TIGAR expression at 72 hours (Figure 2A). As a control, CP-2 had little if any effect on TIGAR abundance (Figure 2B left). Transcription of the TIGAR gene is regulated by p53.24 However, in the setting of GO-203 treatment, there was no detectable effect on TIGAR mRNA levels as determined by RT-PCR (Figure 2B right). RPMI8226 cells similarly responded to GO-203 treatment with decreases in TIGAR expression by 72 hours (Figure 2C). Moreover, TIGAR abundance was unaffected by the control CP-2 (Figure 2C). GO-203 also had little effect on TIGAR mRNA levels in RPMI8226 cells (Figure 2D), indicating that inhibition of MUC1-C down-regulates TIGAR by a posttranscriptional mechanism. U266 and RPMI8226 cells harbor mutant p53 genes.27 To determine whether the effects of MUC1-C inhibition on TIGAR are dependent on p53 status, we studied KMS28PE cells, which express wild-type p53.28,29 The results demonstrate that inhibition of MUC1-C in KMS28PE cells is associated with down-regulation of TIGAR, indicating that this response is not dependent on p53 status (Figure 2E).
TIGAR protein levels are down-regulated by GO-203 treatment. (A-D) U266 (A,B) and RPMI8226 (C,D) cells were left untreated, and treated with 5μM GO-203 or 5μM CP-2 each day for 3 days. Cells were harvested at the indicated times (A) or on day 3 (B-D). Lysates were immunoblotted with anti-TIGAR and anti–β-actin (A, B left, and C). TIGAR and β-actin mRNAs were amplified by RT-PCR and analyzed by agarose gel electrophoresis (B right and D). (E) KMS28PE cells were left untreated, and treated with 5μM GO-203 or 5μM CP-2 each day for 3 days. Lysates were immunoblotted with the indicated antibodies.
TIGAR protein levels are down-regulated by GO-203 treatment. (A-D) U266 (A,B) and RPMI8226 (C,D) cells were left untreated, and treated with 5μM GO-203 or 5μM CP-2 each day for 3 days. Cells were harvested at the indicated times (A) or on day 3 (B-D). Lysates were immunoblotted with anti-TIGAR and anti–β-actin (A, B left, and C). TIGAR and β-actin mRNAs were amplified by RT-PCR and analyzed by agarose gel electrophoresis (B right and D). (E) KMS28PE cells were left untreated, and treated with 5μM GO-203 or 5μM CP-2 each day for 3 days. Lysates were immunoblotted with the indicated antibodies.
ROS decrease TIGAR protein levels
To determine whether inhibition of MUC1-C decreases TIGAR expression by a ROS-mediated mechanism, U266 cells were treated with GO-203 and the antioxidant NAC. Under these conditions, NAC blocked the GO-203–induced down-regulation of TIGAR (Figure 3A). Similar results were obtained in RPMI8226 cells treated with GO-203 and NAC (Figure 3B), indicating that ROS contribute to decreases in TIGAR expression. Indeed, treatment of U266 cells with hydrogen peroxide was associated with decreases in TIGAR protein (Figure 3C). The down-regulation of TIGAR protein by ROS was confirmed in RPMI8226 cells (Figure 3D). These findings indicate that inhibition of MUC1-C increases ROS and thereby decreases TIGAR expression.
TIGAR expression is decreased by ROS. (A-B) U266 (A) and RPMI8226 (B) cells were left untreated, and treated with 5μM GO-203 or 5μM CP-2 each day for 3 days. The GO-203–treated cells were also incubated in the presence of 5mM NAC for the last 2 days. Lysates were immunoblotted with the indicated antibodies. (C-D) U266 (C) and RPMI8226 (D) cells were treated with 250μM H2O2 for the indicated times. Lysates were immunoblotted with the indicated antibodies.
TIGAR expression is decreased by ROS. (A-B) U266 (A) and RPMI8226 (B) cells were left untreated, and treated with 5μM GO-203 or 5μM CP-2 each day for 3 days. The GO-203–treated cells were also incubated in the presence of 5mM NAC for the last 2 days. Lysates were immunoblotted with the indicated antibodies. (C-D) U266 (C) and RPMI8226 (D) cells were treated with 250μM H2O2 for the indicated times. Lysates were immunoblotted with the indicated antibodies.
Inhibition of MUC1-C decreases NADPH and GSH
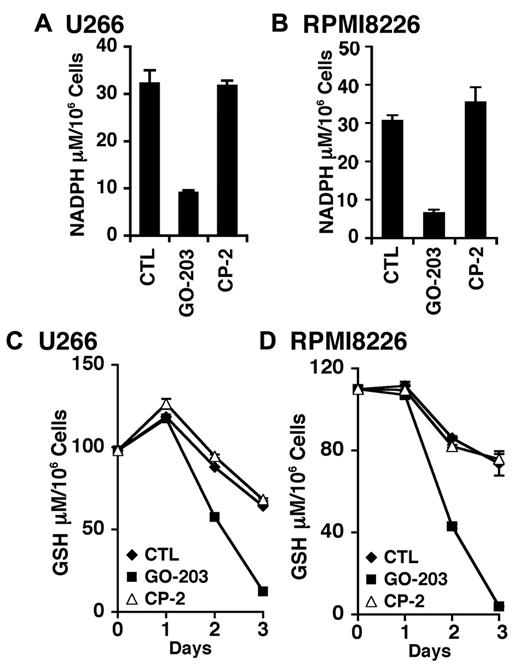
TIGAR redirects glycolytic intermediates to the pentose phosphate pathway, increasing NADPH production.24 Accordingly, inhibition of MUC1-C and down-regulation of TIGAR in U266 cells was associated with a marked decrease in NADPH levels (Figure 4A). RPMI8226 cells also responded to GO-203, but not CP-2 with a decline in NADPH abundance (Figure 4B). NADPH is necessary for the production of GSH and the scavenging of ROS. In this regard, GO-203 treatment resulted in a reduction in GSH levels in both U266 (Figure 4C) and RPMI8226 (Figure 4D) cells. These findings are thus consistent with a model in which inhibition of MUC1-C decreases TIGAR and thereby NADPH and GSH.
GO-203 treatment decreases NADPH and GSH levels. (A-D) U266 (A,C) and RPMI8226 (B,D) cells were left untreated, and treated with 5μM GO-203 or 5μM CP-2 each day for 3 days. The U266 (A) and RPMI8226 (B) cells were analyzed for NADPH levels on day 3. The results are expressed as the NADPH level (mean ± SD of 3 determinations). The U266 (C) and RPMI8226 (D) cells were also analyzed for GSH levels (mean ± SD of 3 determinations) at the indicated times.
GO-203 treatment decreases NADPH and GSH levels. (A-D) U266 (A,C) and RPMI8226 (B,D) cells were left untreated, and treated with 5μM GO-203 or 5μM CP-2 each day for 3 days. The U266 (A) and RPMI8226 (B) cells were analyzed for NADPH levels on day 3. The results are expressed as the NADPH level (mean ± SD of 3 determinations). The U266 (C) and RPMI8226 (D) cells were also analyzed for GSH levels (mean ± SD of 3 determinations) at the indicated times.
Effects of MUC1-C inhibition on mitochondria
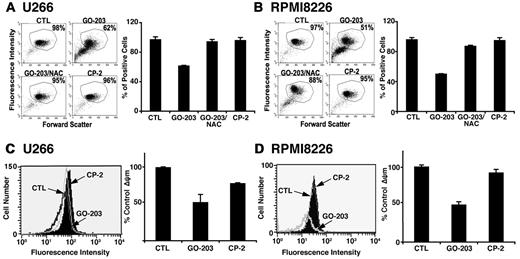
Mitochondria are a major source of ROS, which are generated as a result of release of electrons from the electron transport chain.30 To detect mitochondrial localized ROS, U266 cells were treated with GO-203 and stained with the dye NAO that binds specifically to mitochondrial cardiolipin.25 Inhibition of MUC1-C was associated with a decrease in NAO staining, consistent with an increase in cardiolipin oxidation (Figure 5A left and right). NAC reversed the decrease in NAO staining and CP-2 had no effect (Figure 5A left and right). RPMI8226 cells also responded to GO-203 with an increase in cardiolipin oxidation that was abrogated by NAC (Figure 5B left and right). Oxidative stress decreases the mitochondrial transmembrane potential (ΔΨm). In this regard and as detected by rhodamine staining in U266 cells, inhibition of MUC1-C and the increase in cardiolipin oxidation were associated with a decrease in the mitochondrial transmembrane potential (Figure 5C left and right). Similar results were obtained in GO-203–treated RPMI8226 cells (Figure 5D left and right), indicating that MUC1-C inhibition affects mitochondrial production of ROS and thereby a decrease in the mitochondrial transmembrane potential.
GO-203 induces cardiolipin oxidation and loss of the mitochondrial transmembrane potential. (A-B) U266 (A) and RPMI8226 (B) cells were left untreated, and treated with 5μM GO-203 or 5μM CP-2 each day for 3 days. The GO-203–treated cells were also incubated in the presence of 5mM NAC for the last 2 days. The cells were then incubated with 50nM NAO for 30 minutes and analyzed by flow cytometry (left). The percentage of positive cells is included in the panels. The results are expressed as the percentage of positive cells (mean ± SD of 3 determinations; right). (C-D) U266 (C) and RPMI8226 (D) cells were left untreated, and treated with 5μM GO-203 or 5μM CP-2 each day for 3 days. The cells were incubated with rhodamine 123 and analyzed by flow cytometry (left). The results are expressed as the percentage ΔΨm (mean ± SD of 3 determinations) compared with that obtained for the control (right).
GO-203 induces cardiolipin oxidation and loss of the mitochondrial transmembrane potential. (A-B) U266 (A) and RPMI8226 (B) cells were left untreated, and treated with 5μM GO-203 or 5μM CP-2 each day for 3 days. The GO-203–treated cells were also incubated in the presence of 5mM NAC for the last 2 days. The cells were then incubated with 50nM NAO for 30 minutes and analyzed by flow cytometry (left). The percentage of positive cells is included in the panels. The results are expressed as the percentage of positive cells (mean ± SD of 3 determinations; right). (C-D) U266 (C) and RPMI8226 (D) cells were left untreated, and treated with 5μM GO-203 or 5μM CP-2 each day for 3 days. The cells were incubated with rhodamine 123 and analyzed by flow cytometry (left). The results are expressed as the percentage ΔΨm (mean ± SD of 3 determinations) compared with that obtained for the control (right).
Effects of MUC1-C inhibition on β-F1-ATPase and ATP levels
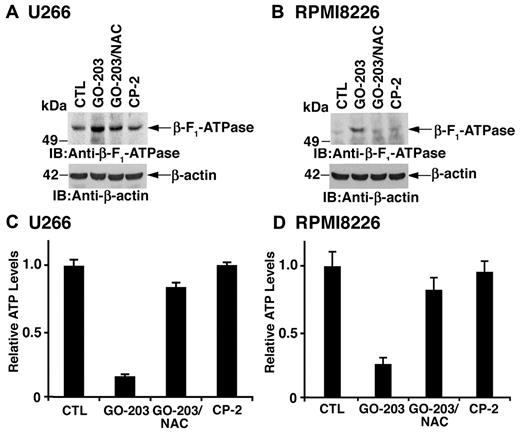
The mitochondrial transmembrane potential is dependent on the proton gradient that drives the synthesis of ATP at Complex V containing the β-F1-ATPase. Treatment of U266 cells with GO-203 was associated with up-regulation of β-F1-ATPase levels that was reversed in part by NAC (Figure 6A). RPMI8226 cells also responded to GO-203 with an increase in β-F1-ATPase by a ROS-dependent mechanism (Figure 6B). Moreover, the up-regulation of β-F1-ATPase resulted in a reduction in ATP levels in U266 (Figure 6C) and RPMI8226 (Figure 6D) cells that was reversed by NAC. These findings indicate that GO-203–induced increases in mitochondrial ROS contribute to the up-regulation of β-F1-ATPase and decreases in ATP.
GO-203 treatment increases β-F1-ATPase expression and reduces ATP levels. (A-D) U266 (A,C) and RPMI8226 (B,D) cells were left untreated, and treated with 5μM GO-203 or 5μM CP-2 each day for 3 days. The GO-203–treated cells were also incubated in the presence of 5mM NAC for the last 2 days. Lysates from U266 (A) and RPMI8226 (B) cells were immunoblotted with the indicated antibodies. Lysates from U266 (C) and RPMI8226 (D) cells were analyzed for intracellular ATP levels. The results are expressed as relative ATP levels (mean ± SD of 3 determinations) compared with that obtained for the control.
GO-203 treatment increases β-F1-ATPase expression and reduces ATP levels. (A-D) U266 (A,C) and RPMI8226 (B,D) cells were left untreated, and treated with 5μM GO-203 or 5μM CP-2 each day for 3 days. The GO-203–treated cells were also incubated in the presence of 5mM NAC for the last 2 days. Lysates from U266 (A) and RPMI8226 (B) cells were immunoblotted with the indicated antibodies. Lysates from U266 (C) and RPMI8226 (D) cells were analyzed for intracellular ATP levels. The results are expressed as relative ATP levels (mean ± SD of 3 determinations) compared with that obtained for the control.
MUC1-C inhibition decreases GSH levels and induces death by a ROS-mediated mechanism
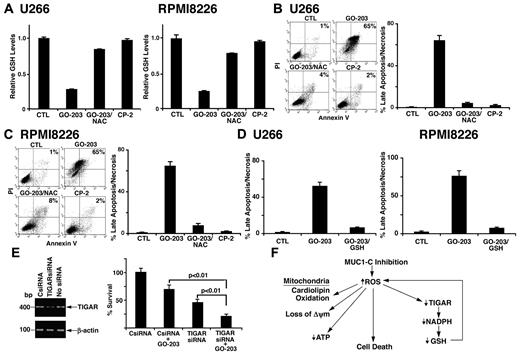
NAC promotes the production of GSH and the scavenging of ROS. Consistent with this effect, GO-203–induced decreases in GSH were reversed in large part by NAC in U266 (Figure 7A left) and RPMI8226 (Figure 7A right) cells. Treatment of U266 cells with GO-203 was associated with induction of late apoptosis/necrosis and this response was substantially blocked by NAC (Figure 7B). Similar results were obtained with RPMI8226 cells (Figure 7C). Moreover and in concert with these results, GO-203–induced late apoptosis/necrosis was inhibited by the addition of GSH to U266 (Figure 7D left) and RPMI8226 (Figure 7D right) cells, indicating that inhibition of MUC1-C results in multiple myeloma cell death by a ROS-mediated mechanism. Based on these results, we assessed the effects of GO-203 on RPMI8226 cells with silencing of TIGAR (Figure 7E left). Decreases in TIGAR abundance inhibited RPMI8226 cell growth (Figure 7E right). Moreover, GO-203 treatment of RPMI8226 cells with TIGAR down-regulation was associated with increased loss of survival compared with that found with GO-203 alone (Figure 7E right). These results indicate that GO-203–induced cell death is promoted by decreases in TIGAR expression.
NAC blocks GO-203–induced decreases in GSH and cell death. (A-C) U266 and RPMI8226 cells were left untreated, and treated with 5μM GO-203 or 5μM CP-2 each day for 3 days. The GO-203–treated cells were also incubated in the presence of 5mM NAC for the last 2 days. (A) The U266 (left) and RPMI8226 (right) cells were analyzed for GSH levels. The results are expressed as relative GSH levels (mean ± SD of 3 determinations) compared with that obtained with the control. (B-C) The U266 (B left) and RPMI8226 (C left) cells were incubated with PI and annexin V, and analyzed by flow cytometry. The results are expressed as the percentage of cells with late apoptosis/necrosis (mean ± SD of 3 determinations; B and C right). (D) U266 (left) and RPMI8226 cells (right) were left untreated, and treated with 5μM GO-203 each day for 3 days. The GO-203–treated cells were also incubated in the presence of 5mM GSH for 3 days. The cells were then incubated with PI and annexin V, and analyzed by flow cytometry. The results are expressed as the percentage of cells with late apoptosis/necrosis (mean ± SD of 3 determinations). (E) RPMI8226 cells were left untransfected, and transfected with control (CsiRNA) or TIGAR siRNA pools for 72 hours. TIGAR and β-actin mRNA levels were determined by RT-PCR (left). Analysis of the intensity of the signals by densitometric scanning demonstrated values of 0.98 for CsiRNA-treated cells and 0.29 for TIGER siRNA-treated cells relative to that obtained for nontransfected cells (assigned a value of 1.0). The transfected cells were left untreated, and treated with 5μM GO-203 for 24 hours. Viable cell number (mean ± SD of 3 determinations) was determined by trypan blue exclusion (right). (F) Schematic representation of the proposed effects of inhibiting MUC1-C on the disruption of redox balance in multiple myeloma cells.
NAC blocks GO-203–induced decreases in GSH and cell death. (A-C) U266 and RPMI8226 cells were left untreated, and treated with 5μM GO-203 or 5μM CP-2 each day for 3 days. The GO-203–treated cells were also incubated in the presence of 5mM NAC for the last 2 days. (A) The U266 (left) and RPMI8226 (right) cells were analyzed for GSH levels. The results are expressed as relative GSH levels (mean ± SD of 3 determinations) compared with that obtained with the control. (B-C) The U266 (B left) and RPMI8226 (C left) cells were incubated with PI and annexin V, and analyzed by flow cytometry. The results are expressed as the percentage of cells with late apoptosis/necrosis (mean ± SD of 3 determinations; B and C right). (D) U266 (left) and RPMI8226 cells (right) were left untreated, and treated with 5μM GO-203 each day for 3 days. The GO-203–treated cells were also incubated in the presence of 5mM GSH for 3 days. The cells were then incubated with PI and annexin V, and analyzed by flow cytometry. The results are expressed as the percentage of cells with late apoptosis/necrosis (mean ± SD of 3 determinations). (E) RPMI8226 cells were left untransfected, and transfected with control (CsiRNA) or TIGAR siRNA pools for 72 hours. TIGAR and β-actin mRNA levels were determined by RT-PCR (left). Analysis of the intensity of the signals by densitometric scanning demonstrated values of 0.98 for CsiRNA-treated cells and 0.29 for TIGER siRNA-treated cells relative to that obtained for nontransfected cells (assigned a value of 1.0). The transfected cells were left untreated, and treated with 5μM GO-203 for 24 hours. Viable cell number (mean ± SD of 3 determinations) was determined by trypan blue exclusion (right). (F) Schematic representation of the proposed effects of inhibiting MUC1-C on the disruption of redox balance in multiple myeloma cells.
Discussion
MUC1-C regulates TIGAR expression in multiple myeloma cells
MUC1 is aberrantly expressed in multiple myeloma cells.2-8 The MUC1-C subunit blocks increases in intracellular ROS and thereby protects against oxidative stress.17-20 The present studies demonstrate that treatment of multiple myeloma cells with a MUC1-C inhibitor is associated with increases in superoxide and hydrogen peroxide. The results further show that MUC1-C inhibition results in down-regulation of TIGAR expression. TIGAR lowers fructose-2,6-bisphosphate levels in cells with inhibition of glycolysis and stimulation of the pentose phosphate pathway.24 TIGAR also decreases intracellular ROS levels, at least in part, through the conversion of NADP+ to NADPH in the pentose phosphate pathway. Inhibition of MUC1-C decreases TIGAR protein in the absence of a detectable effect on TIGAR mRNA levels. Thus, MUC1-C inhibition could induce a miRNA that blocks TIGAR translation. Alternatively, MUC1-C could contribute to stability of the TIGAR protein, such that inhibition of MUC1-C promotes TIGAR turnover. Inhibition of the MET receptor tyrosine kinase also down-regulates TIGAR expression;31 however, there is presently nothing known about the mechanisms responsible for the regulation of TIGAR at the transcriptional or posttranscriptional levels. Given the finding that inhibition of MUC1-C increases ROS levels, the present studies examined whether oxidative stress contributes to the down-regulation of TIGAR expression. Indeed, treatment of multiple myeloma cells with the MUC1-C inhibitor in the presence of the antioxidant NAC abrogated the suppression of TIGAR, indicating that this response is mediated by oxidative stress. In addition, treatment of the multiple myeloma cells with hydrogen peroxide resulted in inhibition of TIGAR expression. These results collectively suggest that TIGAR levels are regulated by the redox status of the cell, such that increases in ROS decrease TIGAR expression and thereby production of NADPH, further disrupting the reducing potential and promoting oxidative stress (Figure 7F). TIGAR protects cells from mild or transient ROS-induced apoptosis;24 however, in the presence of more pronounced oxidative stress, the down-regulation of TIGAR could in turn contribute to cell death. MUC1-C and TIGAR thus appear to function in concert to regulate redox balance. Treatment of multiple myeloma cells with the MUC1-C inhibitor is also associated with attenuation of the NF-κB pathway, which has been shown to have antioxidant and antiapoptotic functions.16 Therefore, down-regulation of both NF-κB and TIGAR signaling in response to MUC1-C inhibition could promote ROS-induced death of multiple myeloma cells. Indeed, the present results demonstrate that decreases in TIGAR abundance promote GO-203–induced death, but are not sufficient to account for this response.
Inhibition of MUC1-C disrupts mitochondrial function
The electron transport chain embedded in the mitochondrial inner membrane generates superoxides and hydrogen peroxide with the escape of electrons.30 To determine whether MUC1-C inhibition promotes the generation of mitochondrial ROS, studies were performed with the mitochondrial-specific dye NAO. The results showed that inhibition of MUC1-C is associated with cardiolipin oxidation, supporting the production of ROS that are localized to mitochondria. The electron transport chain functions in promoting the mitochondrial transmembrane potential, which is derived from the energy of the proton gradient across the inner membrane. The present results further demonstrate that MUC1-C inhibition is associated with loss of the mitochondrial transmembrane potential, indicating that electron flow along the respiratory chain is disrupted with the generation of ROS and a decrease in the proton gradient. Influx of protons into the mitochondrial matrix for the production of ATP is predominantly mediated by the F1F0-ATPase pump. Notably, the F1F0-ATPase is a bidirectional proton pump, such that in the presence of a low mitochondrial transmembrane potential, protons are effluxed with the consumption, rather than the generation, of ATP. In this respect, the present studies show that inhibition of MUC1-C increases β-F1-ATPase expression and induces a marked decrease in ATP levels. These findings support a model in which MUC1-C functions in promoting the mitochondrial transmembrane potential and the generation of ATP. Thus, inhibition of MUC1-C results in increases in mitochondrial ROS, loss of the transmembrane potential, and consumption of ATP (Figure 7F). In potential support of this model, MUC1-C localizes to the mitochondrial outer membrane,32-34 which is the site of the voltage-dependent anion channel responsible for the transport of protons and other ions into the mitochondria. The role of MUC1-C in the mitochondrial outer membrane remains unknown; however, the present results raise the possibility that MUC1-C may contribute to mitochondrial function at the level of proton transport.
MUC1-C inhibition decreases GSH levels and induces cell death
The present studies thus indicate that inhibition of MUC1-C in multiple myeloma cells results in the generation of mitochondrial ROS and thereby ROS-mediated down-regulation of TIGAR expression (Figure 7F). TIGAR promotes the generation of NADPH through glucose-6-phosphate dehydrogenase, the rate-limiting enzyme in the pentose phosphate pathway.24 In concert with these findings, MUC1-C inhibition was associated with decreases in NADPH levels, thus compromising the reducing environment needed for the enhanced generation of ROS by mitochondria. For example, oxidized glutathione is reduced to GSH by NADPH, and in turn glutathione peroxidase reduces hydrogen peroxide to water by reoxidizing GSH. In this way, MUC1-C inhibition resulted in decreased levels of both NADPH and GSH, and an increase in ROS. Under these circumstances, addition of NAC was sufficient to restore GSH production. The ROS-mediated down-regulation of TIGAR thus promotes a positive feedback loop in which the decrease in NADPH and GSH production further amplifies redox imbalance and oxidative stress (Figure 7F). The pentose phosphate pathway protects against oxidative stress-induced apoptosis.35,36 In the present work, inhibition of MUC1-C resulted in the induction of late apoptosis/necrosis as determined by PI and annexin V staining. Apoptosis requires ATP and thus the decreases in ATP observed with MUC1-C inhibition would be expected to shift ROS-mediated apoptosis to a necrotic death response. The demonstration that MUC1-C inhibitor-induced multiple myeloma cell death is reversed by NAC and GSH confirmed that this response is mediated by the disruption of redox balance. Of note, based on these and other findings,15,16,37,38 the first-in-man MUC1-C inhibitor has entered phase 1 evaluation in patients with solid tumors to establish a maximum tolerated dose that could then be used for the treatment of patients with refractory multiple myeloma. With regard to clinical trials in this setting, multiple myeloma cells are sensitive to ROS-mediated cell death by the proteosome inhibitor bortezomib.21,22 Therefore, further studies will be needed to determine whether the MUC1-C inhibitor and bortezomib are effective when combined for the treatment of multiple myeloma. In summary, the present results indicate that MUC1-C inhibition initiates a cascade of (1) mitochondrial ROS production; (2) down-regulation of TIGAR; (3) decreases in NADPH and GSH; and (4) ROS-mediated late apoptosis/necrosis.
The publication costs of this article were defrayed in part by page charge payment. Therefore, and solely to indicate this fact, this article is hereby marked “advertisement” in accordance with 18 USC section 1734.
Acknowledgments
This study was supported by the Leukemia & Lymphoma Society, the Multiple Myeloma Research Foundation, and the National Cancer Institute grant CA42802.
National Institutes of Health
Authorship
Contribution: L.Y. and M.K. performed research and analyzed data; and D.K. designed the research and wrote the paper.
Conflict-of-interest disclosure: D.K. is an equity holder of and a consultant to Genus Oncology. The remaining authors declare no competing financial interests.
Correspondence: Donald Kufe, Dana-Farber Cancer Institute, Harvard Medical School, 450 Brookline Ave, Boston, MA, 02115; e-mail: bdonald_kufe@dfci.harvard.edu


This feature is available to Subscribers Only
Sign In or Create an Account Close Modal