Abstract
Abstract 4922
Cryopreserved peripheral blood mononuclear cells (PBMCs) are routinely used in biomarker development studies. Mutiple pre-analytic parameters related to blood draw, processing, and cryopreservation can impact the quality of PBMC samples used in functional assays. Single cell network profiling (SCNP) is a multi-parameteric flow cytometry based approach that measures intracellular signaling activity in response to extracellular modulators. Preservation of cell viability and functionality is therefore critical to the performance of the SCNP assay. In other immunological assays, such as the ELISpot assay, the length of time from blood draw to PBMC cryopreservation has been shown to be a critical parameter affecting assay performance. In this study, the effect of time from sample collection to cryopreservation on functional pathway activation was assessed by comparing SCNP assay readouts in paired PBMC samples processed within 8 or 32 hrs from blood draw.
40 mLs of peripheral blood was obtained for 20 donors (10 male/10 female, 60–83 yrs) at the Stanford Blood Center. Half of the sample volume from each donor was processed within 8 hrs of blood draw [Day 1 (D1)], and the remainder left at 25C overnight [Day 2 (D2)]. For D2 samples, PBMC isolation and cryopreservation was initiated 24 hrs from the processing start time of the corresponding D1 sample. For the SCNP assay, samples were thawed, modulated for 15 mins with 12 immunomodulatory stimuli (interferons, interleukins, TLR ligands, etc.), fixed, and permeabilized. Permeabilized cells were stained with fluorochrome-conjugated antibodies recognizing cell surface markers or intracellular signaling molecules (pStat1, pStat3, pStat5, pS6, pNFκB, pAkt, and pErk). 38 signaling nodes (readouts of modulated signaling) were measured in 7 distinct immune cell subsets (monocytes, B cells, NK cells, naïve/memory helper T cells, and naïve/memory cytotoxic T cells).
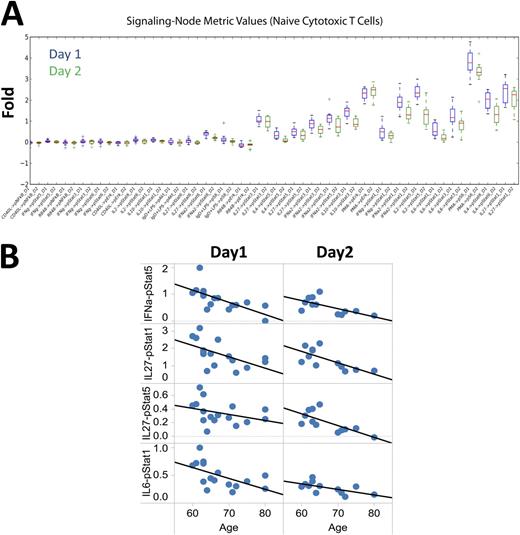
A) Signaling ranges for nodes within naïve cytotoxic T cells for D1 (blue boxplots) and D2 samples (green boxplots). B) Cytokine signaling responses within the naïve cytototixic T subset with significant age-associations in both datasets.
A) Signaling ranges for nodes within naïve cytotoxic T cells for D1 (blue boxplots) and D2 samples (green boxplots). B) Cytokine signaling responses within the naïve cytototixic T subset with significant age-associations in both datasets.
These results demonstrate that blood samples processed the day following blood draw provide meaningful information on functional pathway activation using the SCNP assay and support the identification of statistically significant associations with clinical variables such as age. This is a critical observation since, in the clinical setting, overnight shipping of patient samples to the lab performing the test may be required.
Longo:Nodality: Employment, Equity Ownership. Louie:Nodality: Employment, Equity Ownership. Evensen:Nodality: Employment, Equity Ownership. Hawtin:Nodality: Employment, Equity Ownership. Cesano:Nodality: Employment, Equity Ownership.
Author notes
Asterisk with author names denotes non-ASH members.


This feature is available to Subscribers Only
Sign In or Create an Account Close Modal