Abstract
Perforin-mediated cytotoxicity is important for controlling viral infections, but also for limiting immune reactions. Failure of this cytotoxic pathway leads to hemophagocytic lymphohistiocytosis (HLH), a life-threatening disorder of uncontrolled T-cell and macrophage activation. We studied susceptibility to HLH in 2 mouse strains (souris and beigeJ) and a cohort of patients with partial defects in perforin secretion resulting from different mutations in the LYST gene. Although both strains lacked NK-cell cytotoxicity, only souris mice developed all clinical and histopathologic signs of HLH after infection with lymphocytic choriomeningitis virus. The 2 strains showed subtle differences in CTL cytotoxicity in vitro that had a large impact on virus control in vivo. Whereas beigeJ CTLs eliminated lymphocytic choriomeningitis virus infection, souris CTLs failed to control the virus, which was associated with the development of HLH. In LYST-mutant patients with Chediak-Higashi syndrome, CTL cytotoxicity was reduced in patients with early-onset HLH, whereas it was retained in patients who later or never developed HLH. Thus, the risk of HLH development is set by a threshold that is determined by subtle differences in CTL cytotoxicity. Differences in the cytotoxic capacity of CTLs may be predictive for the risk of Chediak-Higashi syndrome patients to develop HLH.
Introduction
The elimination of numerous viral infections is dependent on the generation of an effective antiviral cytotoxic T-cell (CTL) response. CTL precursor frequencies, CTL activation, migration to the infected organ, and CTL effector functions all influence the efficacy of the response and are critical for virus control.1-5 Because viral infections represent highly dynamic situations, the relative kinetics of virus replication versus the generation and effector phase of CTL responses is decisive for the outcome of infection. Small differences in precursor frequencies or effector functions of virus-specific CTLs can have a significant impact on virus control.3,4,6 This is particularly well illustrated in the mouse model of infection with lymphocytic choriomeningitis virus (LCMV), where, depending on these relative kinetics, either the virus is eliminated and CTL memory is established or virus-specific CTL responses are exhausted and viral persistence ensues.7
Perforin is the key effector molecule mediating lymphocyte cytotoxicity, which is required for the elimination of virus-infected cells and also plays an important role in T-cell homeostasis.8,9 In the absence of perforin, infections can induce excessive T-cell and macrophage activation, leading to a highly inflammatory syndrome called hemophagocytic lymphohistiocytosis (HLH). Familial forms of this disease are caused by mutations in the gene encoding either perforin or proteins involved in the biogenesis, intracellular transport, and release of perforin-containing secretory lysosomes, termed lytic granules.10,11 Although these defects affect both NK-cell and CTL cytotoxicity, observations in LCMV-infected perforin-deficient mice indicate that CTLs and IFN-γ are the key mediators of HLH.12-14 However, the link from impaired CTL cytotoxicity to this lethal hyperinflammatory disease still remains incompletely understood.
In this study, we analyzed the susceptibility to HLH in 2 mouse models and in a cohort of patients with different mutations in the LYST gene leading to Chediak-Higashi syndrome (CHS).15 CHS patients show a variable cytotoxicity defect and carry a high, but variable, risk of developing HLH, also termed the “accelerated phase.” In this model, we illustrate how differences in CTL cytotoxicity determine susceptibility to HLH. Our findings characterize HLH as a threshold disease and demonstrate that subtle differences in CTL cytotoxicity that may be difficult to detect in vitro can have decisive effects in vivo by determining the balance between control of infection and inflammation versus loss of virus control and lethal immunopathology.
Methods
Patients
All patients were referred for immunologic and molecular confirmation of CHS. Written informed consent for genotyping, immunologic studies, and data collection was obtained from the patients or their legal guardians. The study was conducted according to the guidelines of the Declaration of Helsinki and has been approved by the local institutional review board at the University of Freiburg.
Mice and virus
C57BL/6 mice were purchased from Charles River Laboratories. Perforin-deficient (PKO) mice on C57BL/6 background were originally generated by D. Kägi14 and were kindly provided by H. Pircher (IMMH, Freiburg, Germany). C57BL/6J-Lystbg-J/J (beigeJ; stock no. 000629) mice were purchased from The Jackson Laboratory, and C57BL/6-Lystbg-Btlr/Mmcd (souris; stock no. 010470-UCD) mice were originally generated by B. Beutler and colleagues16 (Scripps Research Institute, La Jolla, CA) and were obtained from the Mutant Mouse Regional Resource Center (University of California, Davis, CA). The mutant mice were backcrossed to P14 mice carrying a transgenic receptor specific for gp33-41 of LCMV. Mice were kept in an individual ventilated cage unit (BioZone) and infected at the age of 6 to 12 weeks. The LCMV strain WE was provided by H. Pircher (IMMH, Freiburg, Germany) and stored at −80°C until use. Mice were injected intravenously with 200 pfu. Virus was quantified in organs from infected mice using a focus-forming assay as described.17
HLH biomarkers in mice
Serum levels of lactate dehydrogenase, glutamate dehydrogenase, triglycerides, and ferritin were determined using the Roche Modular Analytics Evo. IFN-γ serum levels were determined by ELISA using purified rat anti–IFN-γ antibody (1 μg/mL, clone R4–6A2, BD) as a capture antibody and biotin-labeled anti–IFN-γ antibody (0.5 μg/mL, clone XMG1.1, BD Biosciences) followed by streptavidin-peroxidase and o-phenylenediamine dihydrochloride for detection. Serum levels of sCD25 were quantified using the Mouse IL-2Ralpha DuoSet kit (R&D Systems) according to the instructions of the manufacturer. Absorbance was measured using at 492 nm. Blood cell counts were determined using a Sysmex KX-21 hematology analyzer.
Histology
Organs were kept in 4% formaldehyde until they were embedded in paraffin. Sections were made using a standard microtome. Sections were incubated with biotinylated rat anti-F4/80 antibody (clone CI:A3-1, AbD Serotec) and biotinylated polyclonal anti–rat immunoglobulins (Dako Cytomation). F4/80+ cells were visualized using the Dako REAL TM detection system, alkaline phosphatase/RED, and hematoxylin counterstaining. Tissue processing and staining were performed at the Institute of Pathology, University Hospital Freiburg, and analysis of the sections was done in a blinded fashion. Images of liver sections and hair shafts were obtained using the Zeiss AxioImager M1 microscope equipped with either a 10×/0.45 or a 40×/0.95 Korr lens. Images were acquired by using the High Definition Kamera MC-HD 1 AVT Horn and the AxioVision Rel 4.8.2 software (Zeiss). Macrophages with engulfed blood cells were quantified in 10 high power visual fields (40×) per mouse.
Degranulation and cytotoxicity assays
Mice.
NK-cell degranulation was determined by incubating 5 × 10⁵ spleen cells with 5 × 10⁵ YAC-1 cells (ATCC, TIB-160) for 2 hours in the presence of anti-CD107a antibody (clone 1D4B; eBioscience) without monensin. NK-cell cytotoxicity was quantified in a standard 5-hour 51chromium-release assay using spleen cells from mice injected with 100 to 200 μg of polyinosinic acid/polycytidylic acid (Sigma-Aldrich) 24 hours previously and YAC-1 target cells.18,19 CTL cytotoxicity was determined using homogenated spleen cells as effectors and either EL4 (ATCC, TIB-39) cells loaded with the immunodominant CTL epitope gp33-41 (PolyPeptide) or LCMV-infected MC57G cells (ATCC, CRL-2295) as targets.20 Quantification of CTLs and NK cells by antibody staining was performed to calculate the specific effector-to-target cell ratio in both assays. For flow cytometry, the following antibodies were used: CD3e (clone 145-2C11; eBioscience), CD8a (clone 53-6.7; BD Biosciences), CD107a (clone 1D4B; eBioscience), NK1.1 (clone PK136; BD Biosciences), and IFN-γ (clone XMG1.2; BD Biosciences).
Humans.
NK-cell and CTL degranulation as well as cytotoxicity assays were performed as described previously.21,22 Briefly, Ficoll-purified peripheral blood mononuclear cells were used as effector cells and K562 (ATCC, CCL-243) as target and stimulator cells for NK-cell studies. For CTL degranulation assays, day 2 to 4 phytohemagglutinin–IL-2 blasts were stimulated with anti-CD3/anti-CD28 Dynabeads (Invitrogen); and for CTL cytotoxicity assays, day 7 to 9 phytohemagglutinin–IL-2 blasts were used as effectors on anti-CD3–labeled L1210 target cells (ATCC, CCL-219). CTL-to-target ratios were calculated by multiplying the respective effector-to-target-ratio with the percentage of CTLs in the effector cell suspension as determined by FACS analysis. For flow cytometry, fluorochrome-conjugated anti-CD3 (clone SK7), anti-CD8 (clone RPA-T8), anti-CD16 (clone 3G8), anti-CD56 (clone NCAM16.2), and anti-CD107a (clone H4A3) were used (all BD Biosciences).
Adoptive transfer experiments
To assess the ability of CTLs to mediate virus control in vivo, C57BL/6 recipient mice were infected with 104 pfu LCMV. Ten hours later, they were transfused with 2 × 10⁶ MACS purified CD8+ splenocytes of mice that had been infected with LCMV 8 days earlier. Eighteen hours later, virus titers were determined in the spleen.3 CD8 T-cell purification was performed using the MACS CD8a+ T Cell Isolation Kit (Miltenyi). Purity was > 90% in all experiments. In a second experimental setup, donor CTLs were generated from wild-type, souris, and beigeJ mice expressing the gp33-specific P14 TCR by incubation of spleen cells with gp33 (10−6M) for 3 days. The activated CTLs were transfused into C57BL/6 recipients, which were infected 1 day later with 200 pfu LCMV. Three days later, virus titers were determined in the spleen.
Sequence analysis
Genomic DNA was used for exon PCR amplification and sequencing (primer sequences available on request).
Statistical analysis
Data were analyzed by using GaphPad InStat Version 3.06 software. The comparisons between data were evaluated with a 1-way ANOVA with posttest. Differences were considered significant at a P value < .05.
Results
Souris and beigeJ mice represent models for human CHS
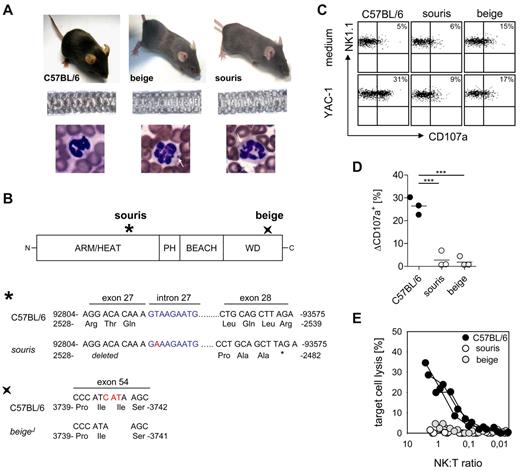
Souris and beigeJ mice carry mutations in the Lyst gene (Figure 1A-B), which is associated with CHS in humans. Souris mice carry a donor splice site mutation in intron 27 with a T to A transversion, which is predicted to cause skipping of exon 27, thereby destroying the reading frame. This finally creates a premature stop codon that would truncate the protein after amino acid 2482 (Figure 1B). BeigeJ mice carry an in-frame deletion of 3 nucleotides leading to deletion of isoleucine at position 3741 in the WD40 domain23 (Figure 1B). Both mouse strains show decreased hair pigmentation leading to a gray coat color (Figure 1A) and the typical inclusion bodies in granulocytes that are also observed in CHS patients (Figure 1A). Moreover, polyriboinosinic acid/polyribocytidylic acid-induced NK cells from both strains showed impaired degranulation (Figure 1C-D) and cytotoxicity (Figure 1E) after incubation with NK-sensitive YAC-1 cells. Thus, both mouse strains display the typical clinical and immunologic features of CHS.
BeigeJ and souris mice reproduce the clinical and immunologic phenotype of CHS. (A) Top panel: Diluted coat color of beigeJ and souris mice. Middle panel: Uneven distribution of pigment in the hair shafts. Bottom panel: Typical inclusion bodies in granulocytes (white arrows). (B) Scheme of the LYST protein with indicated mutation sites in souris and beigeJ mice. The mutation of souris mice is shown on genomic DNA level (position 92815; NCBI Reference Sequence NC_000079), whereas the beigeJ mutation is shown on cDNA level (NCBI Reference Sequence NM_010748.2). (C-E) NK-cell degranulation and cytotoxicity. Mice were injected intraperitoneally with polyinosinic acid/polycytidylic acid, and spleen cells were analyzed 24 hours later. (C) Representative FACS plots of NK-cell degranulation showing CD107a surface expression on NK1.1+CD3− cells after restimulation with YAC-1 cells or medium control. (D) Degranulation is shown as percentage increase of CD107a expression on NK1.1+CD3− cells (ΔCD107a) after restimulation with YAC-1 cells compared with medium control. (E) Lytic activity of NK cells on YAC-1 target cells as determined in a 51Cr-release assay. (D-E) Data show results from one of 2 independent experiments with 3 mice per group. ***P < .001.
BeigeJ and souris mice reproduce the clinical and immunologic phenotype of CHS. (A) Top panel: Diluted coat color of beigeJ and souris mice. Middle panel: Uneven distribution of pigment in the hair shafts. Bottom panel: Typical inclusion bodies in granulocytes (white arrows). (B) Scheme of the LYST protein with indicated mutation sites in souris and beigeJ mice. The mutation of souris mice is shown on genomic DNA level (position 92815; NCBI Reference Sequence NC_000079), whereas the beigeJ mutation is shown on cDNA level (NCBI Reference Sequence NM_010748.2). (C-E) NK-cell degranulation and cytotoxicity. Mice were injected intraperitoneally with polyinosinic acid/polycytidylic acid, and spleen cells were analyzed 24 hours later. (C) Representative FACS plots of NK-cell degranulation showing CD107a surface expression on NK1.1+CD3− cells after restimulation with YAC-1 cells or medium control. (D) Degranulation is shown as percentage increase of CD107a expression on NK1.1+CD3− cells (ΔCD107a) after restimulation with YAC-1 cells compared with medium control. (E) Lytic activity of NK cells on YAC-1 target cells as determined in a 51Cr-release assay. (D-E) Data show results from one of 2 independent experiments with 3 mice per group. ***P < .001.
LCMV infection induces HLH in souris but not in beigeJ mice
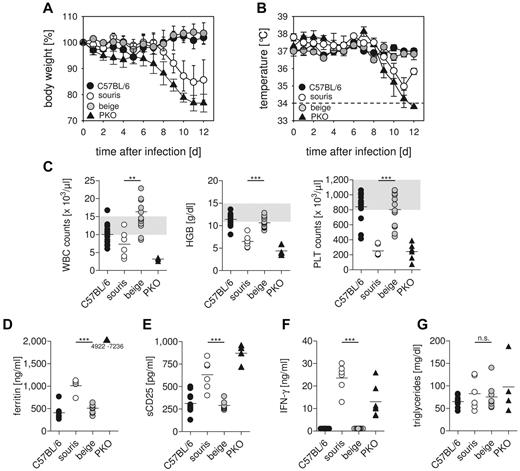
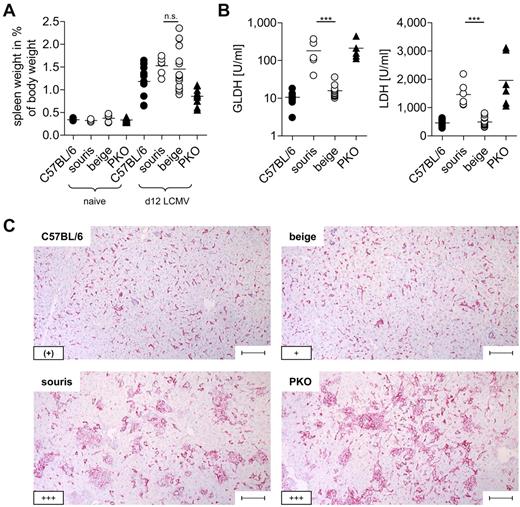
To analyze whether the 2 Lyst mutations confer a risk for HLH, souris and beigeJ were infected with LCMV. Infection of PKO mice with this virus reproduces most clinical features of human HLH,12 with the exception that the fever observed in human patients is reflected by a drop in ear temperature in mice.24,25 Souris and PKO, but not beigeJ, mice showed significant weight loss after LCMV infection (Figure 2A). Of note, weight loss in souris mice started 1 to 2 days later and was less severe than in PKO mice. In contrast to beigeJ mice, LCMV-infected souris mice also developed a drop in ear temperature (Figure 2B) and a pancytopenia (Figure 2C) on day 12 after infection. Moreover, biomarkers of HLH, including ferritin (Figure 2D), sCD25 (Figure 2E), and serum levels of IFN-γ (Figure 2F), were significantly elevated 12 days after LCMV infection of souris and PKO, but not of beigeJ mice. Serum levels of triglycerides were elevated in neither souris nor PKO mice at this time point (Figure 2G). Mice of all experimental groups developed splenomegaly on day 12 after infection (Figure 3A). In contrast, a massive infiltration of macrophages (Figure 3C) with pronounced hemophagocytosis in the liver and elevated liver enzymes (Figure 3B-C) were exclusively observed in souris and PKO mice. Overall, LCMV infection induced the full clinical picture of HLH in souris, but not in beigeJ, mice.
Souris, but not beigeJ, mice develop HLH after LCMV infection.BeigeJ, souris, PKO, and wild-type C57BL/6 mice were infected with 200 pfu LCMV intravenously. Body weight (A) and temperature (B) were monitored daily. Graphs represent mean ± SD of 2 independent experiments with 3 to 5 mice per group. The dashed line indicates the detection limit. (C) On day 12 after infection, blood counts were determined. Gray areas represent the range of blood count values obtained in naive C57BL/6 mice. (D-G) Serum levels of ferritin (D), sCD25 (E), IFN-γ (F), and triglycerides (G) were determined on day 12 after LCMV infection. n.s. indicates not significant (P > .05). **P < .01. ***P < .001.
Souris, but not beigeJ, mice develop HLH after LCMV infection.BeigeJ, souris, PKO, and wild-type C57BL/6 mice were infected with 200 pfu LCMV intravenously. Body weight (A) and temperature (B) were monitored daily. Graphs represent mean ± SD of 2 independent experiments with 3 to 5 mice per group. The dashed line indicates the detection limit. (C) On day 12 after infection, blood counts were determined. Gray areas represent the range of blood count values obtained in naive C57BL/6 mice. (D-G) Serum levels of ferritin (D), sCD25 (E), IFN-γ (F), and triglycerides (G) were determined on day 12 after LCMV infection. n.s. indicates not significant (P > .05). **P < .01. ***P < .001.
Souris mice display histopathologic features of HLH after LCMV infection.BeigeJ, souris, PKO, and wild-type C57BL/6 mice were infected with 200 pfu LCMV intravenously. (A) Spleen weight in percentage of body weight and (B) serum levels of liver enzymes on day 12 after LCMV infection. Pooled data from at least 2 independent experiments with 3 to 5 mice per group. n.s. indicates not significant (P > .05). ***P < .001. (C) Representative pictures of liver sections stained with anti-F4/80 (original magnification × 10). Lower left inset: A semiquantitative analysis of hemophagocytosis by macrophages as assessed in 10 high power visual fields (40×) per mouse. (+) indicates rare; +, few; and +++, very frequent. Scale bars represent 100 μm.
Souris mice display histopathologic features of HLH after LCMV infection.BeigeJ, souris, PKO, and wild-type C57BL/6 mice were infected with 200 pfu LCMV intravenously. (A) Spleen weight in percentage of body weight and (B) serum levels of liver enzymes on day 12 after LCMV infection. Pooled data from at least 2 independent experiments with 3 to 5 mice per group. n.s. indicates not significant (P > .05). ***P < .001. (C) Representative pictures of liver sections stained with anti-F4/80 (original magnification × 10). Lower left inset: A semiquantitative analysis of hemophagocytosis by macrophages as assessed in 10 high power visual fields (40×) per mouse. (+) indicates rare; +, few; and +++, very frequent. Scale bars represent 100 μm.
Souris, but not beigeJ, mice fail to control acute LCMV infection
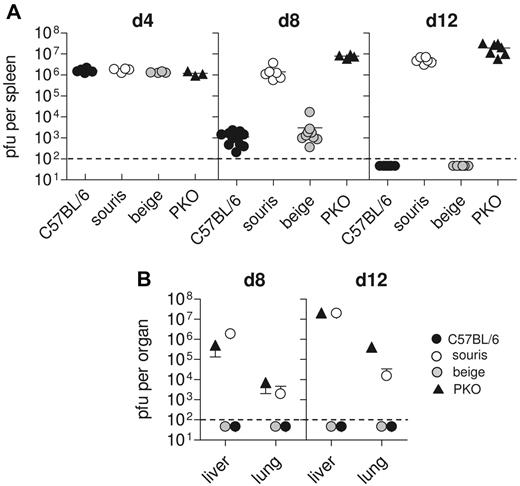
One of the key factors in the pathogenesis of HLH in perforin-deficient mice is their inability to control LCMV infection.12 We therefore determined LCMV titers in various organs at different time points after LCMV infection. C57BL/6 mice showed maximal virus titers in the spleen on day 4 after infection, which were significantly reduced on day 8 and completely eliminated 12 days after infection (Figure 4A). Virus did not spread to liver and lung (Figure 4B). In contrast, in PKO mice virus was not eliminated and spread to peripheral organs (Figure 4A-B). Interestingly, beigeJ mice followed the pattern of wild-type mice, whereas souris mice completely failed to control the virus infection (Figure 4A-B), similar to PKO mice.
Souris mice are not able to control LCMV infection. Mice were infected with 200 pfu LCMV, and virus titers were determined 4, 8, and 12 days after infection. (A) Splenic virus titers on day 4, day 8, and day 12 after infection. Pooled data for 3 to 5 individual mice per group from 2 independent experiments. (B) Hepatic and pulmonary virus titers on day 8 and day 12 after infection. Graphs represent mean ± SD of 3 to 5 mice per group obtained in 2 independent experiments. The dashed line indicates the detection limit.
Souris mice are not able to control LCMV infection. Mice were infected with 200 pfu LCMV, and virus titers were determined 4, 8, and 12 days after infection. (A) Splenic virus titers on day 4, day 8, and day 12 after infection. Pooled data for 3 to 5 individual mice per group from 2 independent experiments. (B) Hepatic and pulmonary virus titers on day 8 and day 12 after infection. Graphs represent mean ± SD of 3 to 5 mice per group obtained in 2 independent experiments. The dashed line indicates the detection limit.
Impairment of CTL degranulation and cytotoxicity is more pronounced in souris than in beigeJ mice
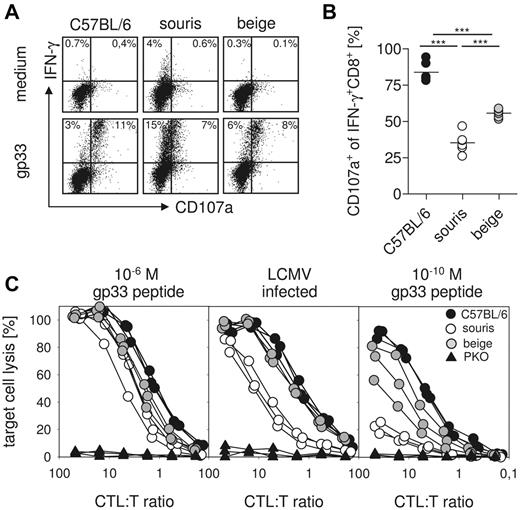
The critical effector mechanism in control of LCMV infection is CTL-mediated perforin-dependent cytotoxicity.14 We therefore investigated LCMV-specific CTL degranulation and cytotoxicity 8 days after LCMV infection of souris and beigeJ mice. To study CTL degranulation, spleen cells were restimulated with gp33 peptide in vitro, and intracellular IFN-γ production as well as CD107a surface expression were determined by flow cytometry. The percentage of IFN-γ–producing cells among total CTLs was higher in souris than in beigeJ or wild-type mice (Figure 5A). However, although ∼ 80% of these cells coexpressed the degranulation marker CD107a in wild-type mice, CD107a was expressed only on 60% of LCMV-specific CTLs in beigeJ and on ∼ 35% of LCMV-specific CTLs in souris mice (Figure 5B). Moreover, the intensity of CD107a staining on the positive cells was lower in souris than in beigeJ mice.
Defect in CTL degranulation and cytotoxicity is more pronounced in souris mice compared with beigeJ mice. On day 8 after LCMV infection, spleen cells were restimulated with gp33 and the CD107a surface expression of IFN-γ+CD8+ T cells was determined. (A) Representative FACS plots of restimulated CTLs and medium control. (B) Percentage of CD107a+IFN-γ+ CTLs after restimulation with gp33. (C) Cytotoxicity was measured in a 51Cr-release assay on gp33 peptide-loaded target cells (left panel, 10−6M; right panel, 10−10M) and on LCMV-infected target cells (middle panel). Results from one of 2 independent experiments with 3 to 5 mice per group are shown. ***P < .001.
Defect in CTL degranulation and cytotoxicity is more pronounced in souris mice compared with beigeJ mice. On day 8 after LCMV infection, spleen cells were restimulated with gp33 and the CD107a surface expression of IFN-γ+CD8+ T cells was determined. (A) Representative FACS plots of restimulated CTLs and medium control. (B) Percentage of CD107a+IFN-γ+ CTLs after restimulation with gp33. (C) Cytotoxicity was measured in a 51Cr-release assay on gp33 peptide-loaded target cells (left panel, 10−6M; right panel, 10−10M) and on LCMV-infected target cells (middle panel). Results from one of 2 independent experiments with 3 to 5 mice per group are shown. ***P < .001.
To study whether the degranulation defect resulted in impaired CTL cytotoxicity, we incubated splenocytes from LCMV-infected mice with 51Cr-labeled target cells infected with LCMV or loaded with graded concentrations of the gp33 peptide. Although there was no obvious difference in the lysis of target cells loaded with 10−6M gp33 in all groups (Figure 5C left panel), virus-infected cells were lysed to a similar extent by wild-type and beigeJ CTLs, whereas similar lytic activity required 4-fold more effector CTLs from souris mice (Figure 5C middle panel). The cytotoxicity defect of souris CTLs became much more obvious when target cells loaded with more physiologic peptide concentrations (10−10M) were used (Figure 5C right panel). In that setting, beigeJ CTLs also showed decreased cytotoxicity (Figure 5C right panel). However, souris CTLs again displayed a significantly more pronounced cytotoxicity defect than beigeJ CTLs.
Small differences in CTL cytotoxicity can explain lack of virus control in souris mice in vivo
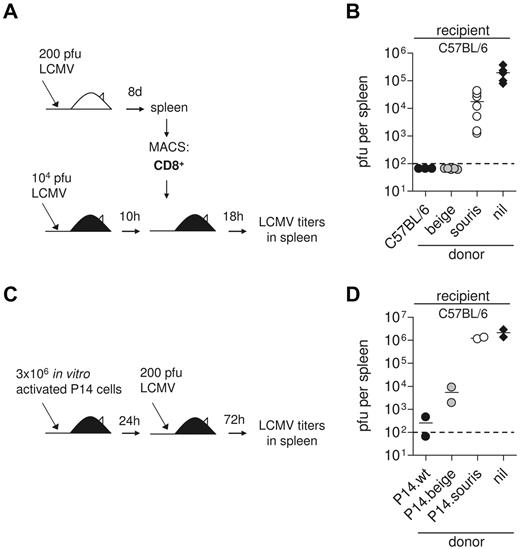
To address the question of whether these differences in CTL activity are relevant in vivo, we performed a short-term protection assay.6 We have previously shown that adoptive transfer of 2 × 10⁶ CD8 T cells from LCMV immune mice into recipients that have been infected with a high dose of LCMV 10 hours earlier leads to perforin-dependent virus elimination in the spleen within 18 hours, whereas titers reach 105 pfu in untreated controls (Figure 6A).3 In this experimental setting, adoptively transfused beigeJ CTL were able to eliminate the virus, whereas souris CTLs only slightly reduced virus titers (Figure 6B). Of note, the frequency of CTLs producing IFN-γ on gp33 stimulation among the CD8 T cells was higher in spleen cells transfused from souris than from beige mice (compare Figure 5A). This indicates that the observed differences in virus control were not the result of lower numbers of virus-specific CTLs among the transfused CTLs. Because differences in virus control in the donor mice could have an impact on the functional state of the transfused CTLs (“exhaustion”), we performed an additional experiment in which CTLs were activated in vitro. For this, we stimulated spleen cells from wild-type, beigeJ, and souris mice expressing the gp33-specific P14 TCR with gp33 peptide and transfused them into C57BL/6 mice that were then infected with 200 pfu LCMV (Figure 6C). Analysis of virus titers in the spleen 3 days later revealed a similar 2 log difference between souris and beigeJ CTLs in mediating virus control (Figure 6D). These data demonstrate that the subtle differences in CTL cytotoxicity in beigeJ versus souris mice determine virus control and induction of HLH after LCMV infection.
Impaired CTL cytotoxicity determines loss of virus control in souris mice. (A-B) CD8 T cells were isolated from spleens of wild-type, souris, and beigeJ mice that had been infected with 200 pfu LCMV 8 days before. A total of 2 × 10⁶ MACS-purified CD8+ T cells were transfused into wild-type C57BL/6 mice that had been infected with 104 pfu LCMV 10 hours before; and after additional 18 hours, LCMV titers were determined in the spleen. (B) Pooled data for 3 to 5 individual mice per group from 2 independent experiments. (C-D) Spleen cells from wild-type, souris, and beigeJ P14 mice were incubated with gp33 for 3 days and adoptively transfused into C57BL/6 recipients. Twenty-four hours later, mice were challenged with 200 pfu LCMV; and 3 days later, LCMV titers were determined in the spleen. Nil indicates the control group without transfused cells. The dashed line indicates the detection limit.
Impaired CTL cytotoxicity determines loss of virus control in souris mice. (A-B) CD8 T cells were isolated from spleens of wild-type, souris, and beigeJ mice that had been infected with 200 pfu LCMV 8 days before. A total of 2 × 10⁶ MACS-purified CD8+ T cells were transfused into wild-type C57BL/6 mice that had been infected with 104 pfu LCMV 10 hours before; and after additional 18 hours, LCMV titers were determined in the spleen. (B) Pooled data for 3 to 5 individual mice per group from 2 independent experiments. (C-D) Spleen cells from wild-type, souris, and beigeJ P14 mice were incubated with gp33 for 3 days and adoptively transfused into C57BL/6 recipients. Twenty-four hours later, mice were challenged with 200 pfu LCMV; and 3 days later, LCMV titers were determined in the spleen. Nil indicates the control group without transfused cells. The dashed line indicates the detection limit.
Defects in CTL and not in NK-cell cytotoxicity correlate with early onset of HLH in human CHS patients
To determine whether these findings are also relevant in humans, we studied lymphocyte cytotoxicity in a cohort of CHS patients. Twelve patients were recruited with a common phenotype of diluted hair pigmentation, granulocyte inclusion bodies, and biallelic mutations in the LYST gene (Table 1). The clinical course of these patients was highly variable. Four patients had developed HLH before the second year of life (early-onset), and one patient was transplanted with no evidence of HLH before the age of 2 (indetermined). Four patients developed HLH at 3.5, 4, 4, and 8 years (later-onset), whereas 3 patients currently 5, 19, and 29 years of age had never developed HLH (no HLH, Table 1). Splice site and truncating mutations were found both in the early-onset and no HLH groups, and the only missense mutation was found in an early-onset patient. Interestingly, P4 and P9 were siblings carrying the same homozygous truncating mutation but differed significantly in their clinical presentation.26 Overall, there was no genotype-phenotype correlation, and the clinical course could not be predicted by the nature of the mutations.
Cohort of patients with Chediak-Higashi syndrome
| Patient no. . | LYST mutations . | Age at onset of HLH . | NK cell cytotoxicity . | NK cell degranulation . | Potential trigger . |
|---|---|---|---|---|---|
| Early-onset | |||||
| 1 | IVS24 c.7060–1G > A acceptor splice site, homozygous | 4 mo | — | ND | None |
| 2 | EX6 c.2570C > G; p.Ser857Cys missense mutation, homozygous EX44 c.9930delT; p.Phe3310LeufsX36 small deletion, homozygous | 18 mo | ND | — | EBV |
| 3 | EX46 c.10551_10552del2; p.Tyr3517X nonsense mutation, homozygous | 5 mo | ND | — | None |
| 4 | EX18 c.5506C > T: p.Arg1836X nonsense mutation, homozygous | 4 mo | ND | ND | Influenza |
| 5 | IVS24 c.7060–1G > T acceptor splice site, heterozygous IVS51 c.11196–1G > A acceptor splice site, heterozygous | No (HSCT 6 mo) | — | ND | None |
| Later-onset | |||||
| 6 | EX6 c.2374_2375delGA; p.Asp792PhefsX6 small deletion, homozygous | 8 y | — | ND | Unknown |
| 7 | EX12 c.4508C > G; p.Ser1483X nonsense mutation, homozygous | 4 y | — | — | None |
| 8 | EX12 c.4508C > G; p.Ser1483X nonsense mutation, homozygous | 3 y | — | — | None |
| 9 | EX18 c.5506C > T; p.Arg1836X nonsense mutation, homozygous | 4 y | — | ND | Salmonella |
| No HLH | |||||
| 10 | IVS19 c.5784 + 5G > T splice donor site, homozygous | No | — | — | NA |
| 11 | EX5 c.575_576insT; p.Leu192PhefsX5 small insertion, homozygous | No | — | — | NA |
| 12 | EX6 c.3310C > T; p.Arg1104X nonsense mutation, homozygous | No | — | — | NA |
— indicates absent; ND, not determined; HSCT, hematopoietic stem cell transplantation; and NA, not applicable.
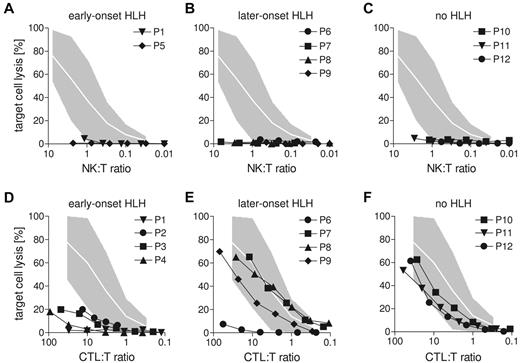
NK-cell degranulation and cytotoxicity were analyzed using CD107a and 51Cr-release assays on NK-sensitive K562 target cells. In 7 of 12 patients, NK-cell degranulation assays could be performed with appropriate controls and 9 of 12 patients had sufficient NK cells to allow analysis of NK-cell cytotoxicity (Figure 7A-C). Both NK-cell assays yielded severely impaired function in all tested patients (Table 1; Figure 7A-C). In contrast, CTL cytotoxicity assessed in a redirected lysis assay on anti-CD3–labeled L1210 cells showed a variable pattern (Figure 7D-F). Although it was absent in all early-onset patients (Figure 7D), CTL activity was in the low normal range in all patients who did not develop HLH (Figure 7F). Among the patients with later onset, 3 patients had normal and 1 had impaired CTL cytotoxicity (Figure 7E). Interestingly, P4 and P9 carried the same mutation (Table 1), but CTL cytotoxicity was only abnormal in P4 (early-onset), not in P9 (later-onset). This difference was observed in 2 independent assays and confirmed in CTL degranulation assays (supplemental Figure 1, available on the Blood Web site; see the Supplemental Materials link at the top of the online article). Overall, similar to the data obtained in mice, differences in CTL cytotoxicity determined by different mutations in the LYST gene were associated with a different risk for developing early-onset HLH.
Lack of CTL activity in human CHS patients correlates with early-onset HLH. (A-C) Cytotoxicity of freshly isolated NK cells from CHS patients was analyzed on 51Cr-labeled K562 target cells. (D-F) Cytotoxicity of CTL after generation of phytohemagglutinin/IL-2 blasts generated from CHS patients was analyzed in an anti-CD3 redirected-lysis assay on L1210 target cells. (A,D) Patients with early-onset HLH (before age 3). (B,E) Patients with late-onset HLH (age 3 or later). (C,F) Patients who never developed HLH. Gray areas represent the range between the 10th and 90th percentile of values obtained with NK cells (A-C) or CTLs (D-F) from healthy donors.
Lack of CTL activity in human CHS patients correlates with early-onset HLH. (A-C) Cytotoxicity of freshly isolated NK cells from CHS patients was analyzed on 51Cr-labeled K562 target cells. (D-F) Cytotoxicity of CTL after generation of phytohemagglutinin/IL-2 blasts generated from CHS patients was analyzed in an anti-CD3 redirected-lysis assay on L1210 target cells. (A,D) Patients with early-onset HLH (before age 3). (B,E) Patients with late-onset HLH (age 3 or later). (C,F) Patients who never developed HLH. Gray areas represent the range between the 10th and 90th percentile of values obtained with NK cells (A-C) or CTLs (D-F) from healthy donors.
Discussion
This study illustrates how subtle differences in CTL cytotoxicity in vitro can translate into clinically important differences in vivo. Lyst mutant beigeJ mice with absent NK-cell cytotoxicity, but only a mild defect in CTL cytotoxicity were able to control LCMV infection without significant signs of disease. In contrast, souris mice with a different mutation in the same gene and a more pronounced CTL cytotoxicity defect were unable to control the infection and developed the symptoms of HLH caused by severe immune dysregulation. In line with these findings, CTL cytotoxicity was significantly reduced in CHS patients with early-onset HLH, whereas CHS patients with later onset or no HLH had low normal CTL cytotoxicity. Of note, cytotoxicity by freshly isolated NK cells was absent in all patients.
These observations allow several conclusions relevant for the understanding of the pathogenesis of HLH in general and of CHS in particular. First, small differences in the lytic activity of CTLs can determine whether or not a viral infection triggers the severe CTL-driven immunopathology resulting in the clinical picture of HLH. In our experiments, the virus-specific lytic activity of souris CTLs in vitro was only slightly more impaired than that of beigeJ CTLs. However, adoptive transfer of souris CTL into LCMV-infected mice clearly revealed how such small differences in in vitro assays can translate into significant differences in vivo. These observations imply that standard cytotoxicity assays performed with high peptide concentrations do not necessarily reflect what is relevant in vivo. Souris CTLs had an impaired ability to control the viral infection in vivo, which is critically dependent on perforin secretion.3 It is probable that, in the dynamic situation of a viral infection, optimal efficiency of the lytic machinery is required to prevent early spread of the virus.27 Virus control appears to be the key variable in the mouse model of LCMV-induced HLH.12 Our data characterize HLH as a threshold disease. Whether or not the threshold to induction of disease was crossed in the murine LCMV model depended on the differences in CTL cytotoxicity and their impact on virus control.
Second, our data support the concept that impaired CTL cytotoxicity may be more important for the pathogenesis of HLH than impaired NK-cell cytotoxicity. As expected from previous reports28,29 (and http://mutagenetix.scripps.edu), both Lyst mutant mouse strains investigated in this study had almost absent NK-cell cytotoxicity, and this correlated well with severely impaired NK-cell degranulation. Similarly, all our CHS patients had the characteristic severely impaired NK-cell cytotoxicity and degranulation.30 Nevertheless, only one of the 2 mouse strains and only a part of the patient cohort developed HLH. In both humans and mice, this correlated with impaired CTL cytotoxicity. Only souris mice with a severe defect in CTL cytotoxicity, but not beigeJ mice with a mild defect, developed HLH on LCMV infection. Moreover, all patients with early-onset HLH had impaired CTL activity, whereas it was in the low normal range in those who did not develop HLH. Interestingly, the first 2 adult CHS patients in whom NK-cell cytotoxicity was studied had not undergone the accelerated phase.31 In those patients, NK-cell cytotoxicity was absent,30 whereas CTL cytotoxicity was normal in one and slightly reduced in the other.32 Overall, these findings also explain the contradictory results of previous studies on CTL cytotoxicity in beigeJ mice28,33 and CHS patients.32,34 It is probable that different LYST/Lyst mutations were the basis for the variable results obtained in these experiments.
A key role for CTLs rather than for NK cells in HLH development was previously demonstrated in a series of cell depletion experiments in LCMV-infected perforin-deficient mice.12 Our present study extends these findings in a new disease model of the “accelerated phase” in CHS and provides evidence that this concept may also be valid for human CHS patients. More importantly, the study demonstrates that subtle differences in CTL function can decide whether an infection triggers the full picture of HLH or is eliminated without any significant manifestations of disease. This new finding characterizes HLH as a threshold disease with implications for the role of hypomorphic mutations in other inherited HLH disorders and possibly also the pathophysiology of some types of secondary HLH. Graded differences in cytotoxic function translate into a “yes-no” phenotype in the context of a viral infection. This implies that genetic variants with a subtle impact on cytotoxic function could have an important impact for the development of HLH.
The observations in the present study also provide an explanation for our recent findings in patients with MUNC13-4 and MUNC18-2 deficiency.35 In that group of patients, NK-cell cytotoxicity was severely impaired, but CTL cytotoxicity assays were only abnormal in those patients who developed typical early-onset HLH, but not in those with an atypical, later onset of the disease.35 At present, it is unclear why NK-cell cytotoxicity should be more affected by the defects in LYST than CTL cytotoxicity. Of note, different protocols are used to determine NK-cell and CTL cytotoxicity. Whereas NK cells are tested directly ex vivo, CTLs are preactivated in vitro for several days. It is possible that the residual potential of granule polarization was fully mobilized in the preactivated CTLs, but not in the resting NK cells. However, there are also some indications on differences in the lytic machinery of the 2 cell types.36 Our observations in MUNC13-4, MUNC18-2, and LYST deficiency suggest that there may be some level of redundancy in the molecular control of degranulation in CTLs, but not in NK cells. A better understanding of the function of LYST in the 2 cell types awaits a better characterization of the function of this still enigmatic protein.15
Third, our study can make a relevant contribution to genotype-phenotype associations in CHS by correlating clinical and genetic findings with immunologic observations, the “immunotype.” It has previously been proposed that there is a reasonably straightforward genotype-phenotype correlation for CHS.37,38 This was based on the finding that homozygous truncating mutations were associated with the severe childhood form of CHS (early-onset HLH), whereas at least one missense mutant allele was detected in 3 patients with the adult form (no HLH). However, in our patient series and in other reports,39,40 several protein truncating mutations have been observed in patients with later-onset or no HLH, and one of our patients with early-onset HLH had a missense mutation. Unfortunately, because of the lack of a good LYST-specific antibody, we could not obtain information about the consequences of the mutations at the protein level. Moreover, 2 examples of siblings with a divergent clinical phenotype have been reported.26,39,40 This is not unexpected because the time of onset of HLH is not exclusively determined genetically but also by environmental factors, such as triggering infections. The observation of different CTL cytotoxicity, CTL degranulation, and a different pigmentation phenotype26 in 2 siblings with the same mutation is more difficult to explain. Further studies on the protein level will be required to resolve this issue.
Overall, the genotype-phenotype correlation in CHS is insufficient for a clinical prognosis. The comparative analysis of CTL function in CHS patients, provided for the first time in this study, yielded a more significant correlation between the degree of impairment of the lytic function of CTLs and the disease phenotype, suggesting that this “immunotype”-phenotype correlation may be more helpful for clinical decisions. The mouse experiments provide evidence of how subtle “immunotype” variations can translate into clinical disease. We propose that, in patients with absent CTL cytotoxicity, there is a clear indication for early hematopoietic stem cell transplantation because of their high risk of developing HLH. Normal CTL cytotoxicity does not exclude the occurrence of HLH in childhood, but a more conservative approach may be justified.
The online version of this article contains a data supplement.
The publication costs of this article were defrayed in part by page charge payment. Therefore, and solely to indicate this fact, this article is hereby marked “advertisement” in accordance with 18 USC section 1734.
Acknowledgments
The authors thank Tatjana Kersten, Ilka Bondzio, and the Center of Chronic Immunodeficiency Advanced Diagnostic Unit for excellent technical assistance.
This work was supported by the Thyssen Stiftung, the Bundesministerium für Bildung und Forschung (BMBF 01 EO 0803), and the European Union (FP7 CURE-HLH grant agreement 201461).
Authorship
Contribution: B.J. and S.E. designed the study and prepared the manuscript; B.J. and A.E. performed mouse experiments; A.M.-P. and H.U. performed human experiments; K.L., A.L., U.G.-W., A.B., Z.K., Y.T.B., E.K., S.B., G.D., M.H., and T.V. recruited patients for the study and contributed the clinical data; A.S.-G. performed histologic analysis; P.A. gave technical support and conceptual advice; and U.z.S. and K.S. performed genetic analysis of CHS patients.
Conflict-of-interest disclosure: The authors declare no competing financial interests.
Correspondence: Stephan Ehl, Center of Chronic Immunodeficiency, Breisacher Strasse 117, 79106 Freiburg, Germany; e-mail: stephan.ehl@uniklinik-freiburg.de.

This feature is available to Subscribers Only
Sign In or Create an Account Close Modal