

Abstract
IL-7 is essential for T-cell homeostasis. Elevated serum IL-7 levels in lymphopenic states, including HIV infection, are thought to be due to increased production by homeostatic feedback, decreased receptor-mediated clearance, or both. The goal of this study was to understand how immune reconstitution through antiretroviral therapy (ART) in HIV+ patients affects IL-7 serum levels, expression of the IL-7 receptor (CD127), and T-cell cycling. Immunophenotypic analysis of T cells from 29 HIV− controls and 43 untreated HIV+ patients (30 of whom were followed longitudinally for ≤ 24 months on ART) was performed. Restoration of both CD4+ and CD8+ T cells was driven by increases in CD127+ naive and central memory T cells. CD4+ T-cell subsets were not fully restored after 2 years of ART, whereas serum IL-7 levels normalized by 1 year of ART. Mathematical modeling indicated that changes in serum IL-7 levels could be accounted for by changes in the receptor concentration. These data suggest that T-cell restoration after ART in HIV infection is driven predominantly by CD127+ cells and that decreases of serum IL-7 can be largely explained by improved CD127-mediated clearance.
Introduction
T-cell homeostasis tightly regulates the composition of the T-cell compartment,1 but many aspects of these homeostatic mechanisms in humans remain unclear. IL-7 is a cytokine produced by stromal cells in the BM, thymus, and lymph node2 and is critical for T-cell thymopoiesis. Through the JAK-STAT5 signaling pathway, IL-7 is essential for the development, maturation, and survival of naive and memory T cells in the periphery.2-6
The IL-7 receptor (IL-7R) consists of 2 chains: the α chain (IL-7Rα/CD127) and the common γ chain shared by IL-2, IL-4, IL-9, IL-15, and IL-21.7 Previous studies have found that, in addition to T cells, dendritic cells and monocytes also express CD127.8,9 Elevated levels of serum or plasma IL-7 have been observed in CD4 T-cell lymphopenia, including HIV infection, idiopathic CD4 lymphocytopenia, and after chemotherapy and BM transplantation.10-13 A strong inverse association has been observed between serum IL-7 levels and CD4 T-cell counts, especially in severe CD4 T-cell lymphopenia (< 200 cells/μL).10,11 Two possible hypotheses have been proposed to explain this association: increased production of IL-7 as part of a compensatory homeostatic response (possibly regulated by the presence of CD127 receptor on dendritic cells) or decreased receptor-mediated clearance from reduced availability of CD127 in lymphopenic conditions14-17 leading to accumulation of IL-7. It has been previously described that CD8 T-cell proliferation is more effective than CD4 proliferation in recovering depleted populations in response to homeostatic signals.18 Some studies have further suggested that very high IL-7 levels may negatively affect CD4 T-cell homeostatic proliferation,9 although in other animal models of lymphopenia-induced proliferation, excess IL-7 led to improved restoration of the T-cell pool, despite high serum levels.19
The goal of our study was to understand how immune reconstitution resulting from combination antiretroviral therapy (ART) and HIV viral suppression in HIV-infected patients affects longitudinal CD127 expression and cycling of CD4 and CD8 T cells with the aim of addressing the fundamental question of IL-7 regulation and T-cell homeostasis in HIV infection. By mathematical modeling, we attempted to determine whether changes in serum IL-7 levels could be attributed to alterations of receptor-mediated clearance.
Methods
Patients
Forty-three HIV-1+ patients who were enrolled in National Institute of Allergy and Infectious Diseases (NIAID) Institutional Review Board–approved protocols at the National Institutes of Health (NIH) Clinical Research Center were followed between 1996 and 2007. At entry, all patients signed informed consent in accordance with the Declaration of Helsinki and were ART naive. Thirty participants with a CD4 T-cell count < 350 cells/μL initiated ART and were longitudinally followed for ≤ 2 years with HIV-1 RNA < 500 or < 50 copies/mL, depending on assay sensitivity. PBMCs and serum were collected and cryopreserved before ART initiation at month 0 (M0) and at months 1, 3, 6, 12, and 24 (M1, M3, M6, M12, and M24) after ART initiation. HIV-1 RNA levels were determined with a modification of the Roche Amplicor HIV Monitor assay kit with a lower limit of detection of 500 or 50 copies/mL. Twenty-nine HIV seronegative controls (HCs) were also studied after enrollment in a blood draw NIH Institutional Review Board–approved protocol at the NIH Clinical Research Center.
Immunophenotyping
Immunophenotypic analysis of cryopreserved PBMCs was performed by 8-color flow cytometry. PBMCs were thawed in RPMI 1640 (Sigma-Aldrich) supplemented with 10% FCS and DNase I (10 U/mL; Roche Diagnostics). PBMCs were washed in PBS (Invitrogen), and dead cells were stained (Live/dead Fixable Blue Dead Cell Stain Kit; Invitrogen). Surface staining was performed with the following monoclonal antibodies: CD4-QDot 605 (Invitrogen), CD8-Pacific Blue (R&D Systems), CD45RO-Cy7PE (BD), CD27-APC (BD Biosciences), and CD127-PE (Beckman Coulter). PBMCs were then washed, fixed, and permeabilized (Fix/Perm; eBioscience) according to the manufacturer's instructions. Intracellular staining for the nuclear antigen Ki67 was performed (Ki67-FITC; BD PharMingen).
Samples were collected on an LSR II (BD Biosciences) with the use of FACS Diva software. Approximately 4 × 10⁵ total events were collected per sample. Flow cytometric data were analyzed with FlowJo Version 8 software (TreeStar). Viable CD3+ cells were selected, and then events were sequentially gated on CD4+ or CD8+ T cells and then on naive and memory populations. Naive cells were defined as CD45RO−CD27+. Memory cells were defined as CD45RO+CD27+ (central memory; CM) or CD45RO+CD27− (effector memory; EM). A fourth population of cells was defined as CD45RO−CD27− (effectors).
Cytokine values
Serum IL-7 levels in cryopreserved sera were measured with the Quantikine high-sensitivity human IL-7 immunoassay (R&D Systems) with a lower limit of detection < 0.1 pg/mL. The assay was performed according to the manufacturer's instructions, and all specimens were run in duplicate.
[125I]IL-7 binding assays
The binding affinity of IL-7 to its receptor (CD127) and the number of CD127 receptors per cell were estimated through an [125I]IL-7 binding assay with the use of freshly isolated PBMCs from 2 healthy donors. Recombinant human IL-7 was kindly provided by Cytheris. Iodination of IL-7 was performed with [125I]NaI with the use of the Iodogen method as previously described.20 [125I]IL-7 was purified by a size exclusion PD-10 column eluted with 0.02M sodium phosphate and 0.155M sodium chloride (normal saline), pH 7.2. The purified [125I]IL-7 was stored at 4°C in 0.02M sodium phosphate to 0.155M sodium chloride (normal saline solution), pH 7.2, containing 2% BSA and had a specific activity of 48 μCi (1.8 Bq)/μg.
After PBMC isolation, erythrocytes were lysed with ACK lysing buffer (BioWhittaker). Binding assays were performed as previously described.21 Briefly, PBMCs were washed and resuspended in the binding medium at a concentration of 9 × 10⁶ cells/mL in PBS containing 2% BSA, 20mM HEPES buffer, and 0.2% sodium azide at pH 7.2. Total binding was measured by incubating cells at various concentrations of [125I]IL-7 [0.05-10nM] for 30 minutes at 37°C. Nonspecific binding was measured by first incubating cells with ≥ 1000-fold molar excess of unlabeled IL-7 for 20 minutes at 37°C and subsequently with various concentrations of [125I]IL-7 for 30 minutes at 37°C. After incubation, samples were centrifuged for 2 minutes at 12 000 rpm, and the counts per minute in the cell pellet were measured. All data were corrected for nonspecific binding. The equilibrium binding data were fitted to an equation consisting of the sum of 2 Michaelis-Menten terms22 with the use of the nonlinear least-squares Levenberg-Marquardt algorithm.23 The 95% confidence interval of the estimates was obtained by bootstrapping the residuals between the observed data and the best-fitted (theoretical) values.
Statistical analysis
Wilcoxon rank-sum test was used for comparison between HC and HIV+ (n = 30) at each time point, and Wilcoxon signed-rank test was used for paired comparisons between each on-ART time point and M0. Association between 2 variables was explored by Spearman rank correlation coefficient (R) and simple linear regressions. Association between one variable and multiple covariates was explored by multiple linear regressions, after log-transformation of viral load and proliferation data; for these analyses, one patient was eliminated because of the inability to measure levels of proliferation (below the limits of the assay). To account for the multiple tests, differences or associations with P < .01 were considered statistically significant.
In the longitudinal analysis, the growth rate of cell populations after M3 was calculated as the change in cell count between 2 adjacent time points divided by the change in time between the 2 time points; the growth rate before M3 was calculated as the regression slope among the 3 measurements at M0, M1, and M3. The rate of change of cell populations or IL-7 level was also estimated by nonparametric local linear mixed-effects modeling (24 and supplemental Methods, available on the Blood Web site; see the Supplemental Materials link at the top of the online article). At any time t, the longitudinal curve of the variable was locally approximated by a line, with the slope of the line giving the rate of change at t. Letting t vary over the observation period, we obtained the time profile for the rate of change in the variable. Applying nonparametric local linear mixed-effects modeling simultaneously to a pair of variables, we obtained the time profile for the correlation between the rates of change in the 2 variables.25
Mathematical modeling
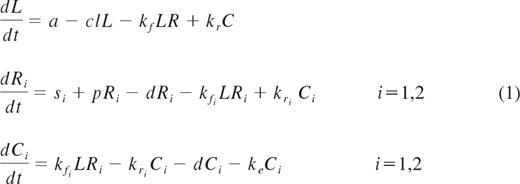
A mathematical model was used to test whether changes in serum IL-7 levels during ART could be explained by receptor-mediated clearance on the basis of CD127 expression on T cells. The model was based on the idealization of an in vitro experiment in which the binding of IL-7 ligand to the surface CD127 receptors is governed by the law of mass action coupled to a first-order kinetics of ligand-induced internalization26 and is explained by 3 differential equations for the unbound ligand (L), unoccupied receptors (R), and the complex (C; ie, the receptors occupied by the ligand). The rates of association kf, dissociation kr, and internalization ke, are constants and depend only on the type of ligand and receptor. The generalization of the model for the in vivo dynamics of the interplay between IL-7 serum levels and changes in CD127 receptors assumes that the ligand (L) is produced and cleared from the peripheral system at constant rates a and cl, respectively, and the receptors (R) are refilled at a constant source rate s and grow and disappear at rates p(t) and d(t), respectively. The receptors occupied by the ligand, C, like the unbound receptors, also disappear at rate d(t). The rates of growth and disappearance for the receptors (R) will change from their quasi steady state values at baseline to reach a new quasi steady state level after initiation of ART. The cell binding assays performed on fresh PBMCs from 2 healthy donors confirmed previous observations from other groups that CD127 receptors display dual affinity binding to IL-721,27 ; thus, the aforementioned differential equations for the receptors (R) and the complex (C) will be translated in the following 5 differential equations to account for high- and low-affinity receptors, where R = R1 + R2 and C = C1 + C2.
Data analysis.
The coupled set of differential equations were solved numerically using the “Runge-Kutta 4” ODE solver, that is, a fixed step-size, single-step explicit Runge-Kutta fourth-order method. Curve fitting, confidence interval estimates, and model simulations were performed with Labview 2010 (National Instruments). Steady state solution was solved with Mathematica 6 (Wolfram Research). Statistical analyses were performed with R software (R Project).
Results
Clinical characteristics
The baseline clinical characteristics of the ART-naive HIV+ patients (n = 43), including the subgroup that received ART, and HCs are shown in Table 1. Longitudinal graphs include only those patients who initiated ART after their baseline visit (n = 30).
Baseline clinical characteristics of all ART-naive HIV+ study participants, the subset of HIV+ participants that initiated ART, and HIV-seronegative controls (HCs)
| HIV+ (n = 43), median (interquartile range) | HIV+/ART (n = 30), median (interquartile range) | HC (n = 29), median (interquartile range) | P | ||
|---|---|---|---|---|---|
| HIV+ vs HC | HIV+/ART vs HC | ||||
| Age, y | 38 (33-43) | 36 (33-42) | 47 (43-58) | .0002 | .0002 |
| CD4+ T cells/μL | 187 (47-383) | 69 (21-229) | 623 (432-879) | < .0001 | < .0001 |
| CD4+ T cells, % | 15 (5-26) | 8 (2-19) | 45 (40-52) | < .0001 | < .0001 |
| CD8+ T cells/μL | 539 (351-977) | 457 (290-798) | 291 (230-470) | .0005 | .023 |
| CD8+ T cells, % | 58 (45-66) | 60 (49-68) | 22 (17-30) | < .0001 | < .0001 |
| Serum IL-7, pg/mL | 24.8 (19.3-36.3) | 30.0 (22.3-40.5) | 15.3 (12.3-19.6) | < .0001 | < .0001 |
| Log10 plasma HIV-1 RNA, copies/mL | 4.76 (3.98-5.15) | 5.02 (4.48-5.41) | NA | NA | NA |
By M6, 76% of HIV+ patients (22 of 29) achieved plasma viremia below detection levels (viral load data were missing for one patient at M6, but suppression was documented at M12). HIV+ patients had significantly lower CD4+ and higher CD8+ T cells/μL and higher serum IL-7 levels than HCs at most time points (Figure 1A-B,D; significant P values are shown as gray symbols). In a paired comparison of each time point to M0, CD4+ T-cell count significantly increased at all time points (Figure 1A; paired comparison significant P values are represented as black symbols). CD4+ T cells/μL and IL-7 levels were significantly inversely associated in HIV+ patients at baseline (R = −0.76, P < .0001; Figure 1C) but not in the HC group (R = −0.34, P = .068). HCs were significantly older than the HIV+ patients (Table 1), but there was no association between age and serum IL-7 levels in the HCs or the HIV+ patients (supplemental Figure 1). IL-7 levels decreased from M1 onward and did not differ from HC levels at M12 and beyond (Figure 1D). In addition, HIV+ patients had a significantly lower proportion of CD4+CD127+ and CD8+CD127+ T cells than HCs, with restoration in the CD8+ but not in the CD4+ T-cell subset at M24 (Figure 1E-F). The proportion of CD4+ and CD8+ T cells expressing CD127 began increasing significantly compared with baseline at M6 and beyond (Figure 1E-F).

CD4+ and CD8+ T cells/μL and proportion of CD4+CD127+ T cells do not normalize with ART, whereas IL-7 levels do not differ from HCs after 12 months of ART. Data shown include the total number of CD4+ (A) and CD8+ (B) T cells/μL, serum IL-7 pg/mL (D), and proportion of CD4+CD127+ (E) and CD8+CD127+ (F) T cells in the group of HIV+ patients (n = 30) who were followed longitudinally from M0 to M24. The association between CD4+ T cells/μL and serum IL-7 levels in HIV+ at M0 and HCs is shown (C). Circles (black) represent median values and vertical bars indicate interquartile range (IQR). Gray dashed lines indicate HC median values. P values (gray) at the top of the graphs represent unpaired comparisons between HC and HIV+ at each time point, and P values (black) above the IQR bars indicate paired comparisons of HIV+ patients at each time point during the therapy to the pretherapy level (M0). Significant P values < .01 are reported, *P = .01 > .001, **P = .001 ≥ .0001, and ***P < .0001. HIV+ data are shown as black circles and HCs as gray squares.
CD4+ and CD8+ T cells/μL and proportion of CD4+CD127+ T cells do not normalize with ART, whereas IL-7 levels do not differ from HCs after 12 months of ART. Data shown include the total number of CD4+ (A) and CD8+ (B) T cells/μL, serum IL-7 pg/mL (D), and proportion of CD4+CD127+ (E) and CD8+CD127+ (F) T cells in the group of HIV+ patients (n = 30) who were followed longitudinally from M0 to M24. The association between CD4+ T cells/μL and serum IL-7 levels in HIV+ at M0 and HCs is shown (C). Circles (black) represent median values and vertical bars indicate interquartile range (IQR). Gray dashed lines indicate HC median values. P values (gray) at the top of the graphs represent unpaired comparisons between HC and HIV+ at each time point, and P values (black) above the IQR bars indicate paired comparisons of HIV+ patients at each time point during the therapy to the pretherapy level (M0). Significant P values < .01 are reported, *P = .01 > .001, **P = .001 ≥ .0001, and ***P < .0001. HIV+ data are shown as black circles and HCs as gray squares.
Cycling in T-cell subsets
Although CD8+ T cells initially showed increased cycling (Ki67+) that normalized by M3, CD4+ T cells maintained increased cycling compared with HCs up to M6 (Figure 2A-B). The proportion of cycling CD3+ T cells was also increased but normalized by M3 (Figure 2C). Similarly, increased cycling of both CD3+CD127+ and CD8+CD127+ cells normalized shortly after ART initiation compared with HCs, whereas increased cycling in CD4+CD127+ T cells was observed through M6 (Figure 2D-F). The cycling of CD4+CD127− and CD8+CD127− T-cell subsets was not different from the HCs at most time points studied (Figure 2G-I).

Increased proportion of cycling (Ki67+) CD4+ and CD4+CD127+ T cells persistsup to M12 after ART, whereas the proportion of cycling CD8+ and CD8+CD127+ T-cell normalizes shortly after ART initiation. The proportion of cycling CD4+ (A), CD8+ (B), CD3+ (C), CD4+CD127+ (D), CD8+CD127+ (E), CD3+CD127+ (F), CD4+CD127− (G), CD8+CD127− (H), and CD3+CD127− (I) is shown in the group of HIV+ patients (n = 30) who were followed longitudinally from M0 to M24. Circles (black) represent median values, and bars indicate interquartile range (IQR). Gray dashed lines indicate HC median values. P values (gray) at the top of the graphs represent unpaired comparison between HC and HIV+ at each time point, and P values (black) above the IQR bars indicate paired comparison of HIV+ patients at each time point during the therapy to the pretherapy level (M0). Significant P values < .01 are reported, *P = .01 > .001, **P = .001 ≥ .0001, and ***P < .0001.
Increased proportion of cycling (Ki67+) CD4+ and CD4+CD127+ T cells persistsup to M12 after ART, whereas the proportion of cycling CD8+ and CD8+CD127+ T-cell normalizes shortly after ART initiation. The proportion of cycling CD4+ (A), CD8+ (B), CD3+ (C), CD4+CD127+ (D), CD8+CD127+ (E), CD3+CD127+ (F), CD4+CD127− (G), CD8+CD127− (H), and CD3+CD127− (I) is shown in the group of HIV+ patients (n = 30) who were followed longitudinally from M0 to M24. Circles (black) represent median values, and bars indicate interquartile range (IQR). Gray dashed lines indicate HC median values. P values (gray) at the top of the graphs represent unpaired comparison between HC and HIV+ at each time point, and P values (black) above the IQR bars indicate paired comparison of HIV+ patients at each time point during the therapy to the pretherapy level (M0). Significant P values < .01 are reported, *P = .01 > .001, **P = .001 ≥ .0001, and ***P < .0001.
The proportion of cycling CD4+, CD4+CD127+, and CD4+CD127− T cells did not significantly change from M0 to M1 and M3 but decreased at M6, M12, and M24. The proportion of cycling CD8+ and CD8+CD127+ T cells decreased from M0 at M3 and at all time points thereafter. The proportion of cycling CD3+, CD3+CD127+, and CD3+CD127− T cells decreased from M0 at M6, M12, and M24 (Figure 2).
Univariate linear regressions showed a positive association of the percentage of proliferating CD4+CD127+ T cells with HIV-1 RNA (slope = 0.42, P = .019) and serum IL-7 (slope = 0.02, P = .027) levels and an inverse association with the CD4+CD127+ T-cell counts (slope = −0.0072, P < .001) at baseline (M0) and similarly at M1. However, the multivariate linear regression involving all the above covariates showed a significant association only between the percentage of proliferating CD4+CD127+ T cells and total number of CD4+CD127+ T cell/μL (P < .01 ≤ 1 year and P = .023 at 2 years on ART).
The numbers of cycling CD4+, CD8+, and CD3+ T cells are shown in supplemental Figure 2. The number of cycling CD4+ T cells was similar, but the numbers of cycling CD8+ and CD3+ T cells were higher compared with HCs (supplemental Figure 2A-C). The number of cycling CD127+ T cells was similar to controls in the CD8+ and CD3+ subsets yet was significantly lower in the CD4+ T-cell subsets (supplemental Figure 2D-F).
Recovery of T cells expressing CD127
In the HIV+ group, CD4+CD127+, CD8+CD127+, and CD3+CD127+ T cells/μL were significantly lower than HCs at M0 (28 vs 485 T cells/μL, P < .0001; 71 vs 157 T cells/μL, P = .034; and 112 vs 641 T cells/μL, P < .0001, respectively) and increased over time (Figure 3A-C). In contrast, CD4+CD127−, CD8+CD127−, and CD3+CD127− T cells/μL increased from M0 to M1 and then leveled off. CD4+CD127+ T cells increased continuously throughout ART but did not normalize by M24 (Figure 3A). In contrast, CD8+CD127+ T cells normalized by M1 but then exceeded HC levels at both M12 and M24 (Figure 3B). At all study time points (except M12) there was a significant positive correlation between CD4+CD127+ and CD8+CD127+ T cells/μL (overall r = 0.53, P < .0001). The number of CD3+CD127+ T cells/μL increased with ART and reached HC levels by M24 (Figure 3C). Compared with M0, T-cell counts increased at M1 (CD4+CD127+, CD4+CD127−, CD8+CD127+, and CD3+CD127− cells/μL) and at M3 (CD3+CD127+ cells/μL) from paired comparisons within the HIV+ group.

Restoration of CD4+, CD8+, and CD3+ T cells/μL expressing CD127 after ART initiation. The total number of CD4+CD127+ (A), CD8+CD127+ (B), CD3+CD127+ (C), CD4+CD127− (D), CD8+CD127− (E), and CD3+CD127− (F) T cells/μL is shown in the group of HIV+ patients (n = 30) who were followed longitudinally from M0 to M24. Circles (black) represent median values, and bars indicate interquartile range (IQR). Gray dashed lines indicate HC median values. P values (gray) at the top of the graphs represent unpaired comparison between HC and HIV+ at each time point, and P values (black) above the IQR bars indicate paired comparison of HIV+ patients at each time point compared with the pretherapy level (M0). Significant P values < .01 are reported, *P = .01 > .001, **P = .001 ≥ .0001, and ***P < .0001.
Restoration of CD4+, CD8+, and CD3+ T cells/μL expressing CD127 after ART initiation. The total number of CD4+CD127+ (A), CD8+CD127+ (B), CD3+CD127+ (C), CD4+CD127− (D), CD8+CD127− (E), and CD3+CD127− (F) T cells/μL is shown in the group of HIV+ patients (n = 30) who were followed longitudinally from M0 to M24. Circles (black) represent median values, and bars indicate interquartile range (IQR). Gray dashed lines indicate HC median values. P values (gray) at the top of the graphs represent unpaired comparison between HC and HIV+ at each time point, and P values (black) above the IQR bars indicate paired comparison of HIV+ patients at each time point compared with the pretherapy level (M0). Significant P values < .01 are reported, *P = .01 > .001, **P = .001 ≥ .0001, and ***P < .0001.
CD127 expression on naive and CM T-cell subsets
Restoration of total numbers of CD4+ and CD8+ naive, CM, EM, and effector T cells/μL were studied (supplemental Figure 3). The number of naive and CM CD4+ T cells did not reach HC levels, whereas CD8+ naive T cells normalized, and CM cells were higher than HCs (supplemental Figure 3A-D). Effector memory and effector CD4+ T cells quickly normalized, whereas EM and effector CD8+ T cells were higher than HCs (supplemental Figure 3E-H). The number of CD4+ T-cell memory subsets increased significantly from M0 to subsequent time points. Only naive CD8+ T cells increased significantly from M0 to most studied time points.
CD127 expression on naive CD4+ T cells increased from M0 throughout ART but did not normalize by M24 (Figure 4A). In contrast, the number of naive CD4+CD127− T cells/μL reached levels similar to HC by M12 (Figure 4C). CD127 expression on naive CD8+ T cells also increased with ART but exceeded levels seen in HCs at both M12 and M24 (Figure 4B). The CD4+ CM T-cell subset closely paralleled the naive subset (Figure 4E,G). The number of CD8+CD127+ CM T cells/μL was low at M0 but normalized subsequently (Figure 4F). The number of CD8+CD127− CM T cells/μL exceeded HC levels at all time points (Figure 4H). The number of naive CD8+CD127− T cells/μL never differed from HCs (Figure 4D). In the paired comparisons, naive CD4+CD127+, CD4+CD127−, CD8+CD127+ and CM CD4+CD127+, CD4+CD127−, CD8+CD127+ all increased at M1 or M3 compared with M0 (Figure 4A-C,E-G).

Restoration of naive and CM T cells expressing CD127 after ART. The total number of naive (A-D) and CM (E-F) CD4+CD127+, CD8+CD127+, CD4+CD127−, and CD8+CD127− T cells/μL is shown in the group of HIV+ patients (n = 30) who were followed from M0 to M24. Circles (black) represent median values and bars indicate interquartile range (IQR). Gray dashed lines indicate HC median values. P values (gray) at the top of the graphs represent unpaired comparisons between HC and HIV+ at each time point, and P values (black) above the IQR bars indicate paired comparison of HIV+ patients at each time point during the therapy to the pretherapy level (M0). Significant P values < .01 are reported, *P = .01 > .001, **P = .001 ≥ .0001, and ***P < .0001. Naive cells were defined as CD45RO−CD27+; CM as CD45RO+CD27+.
Restoration of naive and CM T cells expressing CD127 after ART. The total number of naive (A-D) and CM (E-F) CD4+CD127+, CD8+CD127+, CD4+CD127−, and CD8+CD127− T cells/μL is shown in the group of HIV+ patients (n = 30) who were followed from M0 to M24. Circles (black) represent median values and bars indicate interquartile range (IQR). Gray dashed lines indicate HC median values. P values (gray) at the top of the graphs represent unpaired comparisons between HC and HIV+ at each time point, and P values (black) above the IQR bars indicate paired comparison of HIV+ patients at each time point during the therapy to the pretherapy level (M0). Significant P values < .01 are reported, *P = .01 > .001, **P = .001 ≥ .0001, and ***P < .0001. Naive cells were defined as CD45RO−CD27+; CM as CD45RO+CD27+.
Growth rate of CD127+ and CD127− subsets in CD4+ and CD8+ T cells
The growth rate of various cell populations is graphically depicted in Figure 5C to L. The growth rate of the CD127+ subsets was higher than the growth rate for the CD127− subsets, particularly at later time points (M6 and beyond), in both CD4+ and CD8+ T cells once the HIV viral load was suppressed. However, this trend held true only for naive and CM cell populations and not for EM and effector cell subsets.

Rates of change of IL-7 and CD127 receptors and growth rates of CD127+ and CD127− T cells of CD4+ and CD8+ T-cell subsets. (A) Time profiles for the correlation between the rate of change in serum IL-7 levels and that in CD3+127+ T cells/μL (red line), and the correlation between the rate of change in serum IL-7 and that in CD3+127− (blue line), with the dashed lines indicating the respective 95% confidence intervals. (B) Time profiles for the correlation between the rate of change in serum IL-7 with that in total CD3+ (black), CD4+ (red), and CD8+ (green) T cells/μL. The dashed lines represent the 95% confidence intervals. These time profiles are estimated up to 6 months, because later observations were sparse and the algorithm failed to converge. The growth rates of total (C-D), naive (E-F), CM (G-H), EM (I-J), and effector (K-L) CD4+ and CD8+ T cells after ART initiation. Median values are shown. The growth rate from M0 to M3 with intermediate data at M1 is calculated with the linear interpolation and is plotted at 1.5 months on the x-axis. P values represent the differences in the growth rate between CD127+ and CD127− T cells. Significant P values < .01 are reported, *P = .01 > .001, **P = .001 .0001, and ***P < .0001.
Rates of change of IL-7 and CD127 receptors and growth rates of CD127+ and CD127− T cells of CD4+ and CD8+ T-cell subsets. (A) Time profiles for the correlation between the rate of change in serum IL-7 levels and that in CD3+127+ T cells/μL (red line), and the correlation between the rate of change in serum IL-7 and that in CD3+127− (blue line), with the dashed lines indicating the respective 95% confidence intervals. (B) Time profiles for the correlation between the rate of change in serum IL-7 with that in total CD3+ (black), CD4+ (red), and CD8+ (green) T cells/μL. The dashed lines represent the 95% confidence intervals. These time profiles are estimated up to 6 months, because later observations were sparse and the algorithm failed to converge. The growth rates of total (C-D), naive (E-F), CM (G-H), EM (I-J), and effector (K-L) CD4+ and CD8+ T cells after ART initiation. Median values are shown. The growth rate from M0 to M3 with intermediate data at M1 is calculated with the linear interpolation and is plotted at 1.5 months on the x-axis. P values represent the differences in the growth rate between CD127+ and CD127− T cells. Significant P values < .01 are reported, *P = .01 > .001, **P = .001 .0001, and ***P < .0001.
Analysis of the model
Extracellular (free) ligand (L) binds reversibly to free surface receptor (R) with an on rate kf and an off rate kr to form the ligand-receptor complexes (C). The ligand-receptor complexes are endocytosed with an average rate constant ke. The free ligand enters the compartment at a rate a and is cleared at a rate cl. The peripheral system is continuously replenished with new receptors at a constant rate s (time−1). Receptors grow in number at a rate p. Both unbound and bound receptors (C) also disappear at a rate d.
As described in “Methods,” applying the law of mass action to this compartmental scheme generates a system of 5 differential equations that accounts for the high- and low-affinity displayed by the CD127 receptors to its ligand, IL-7.
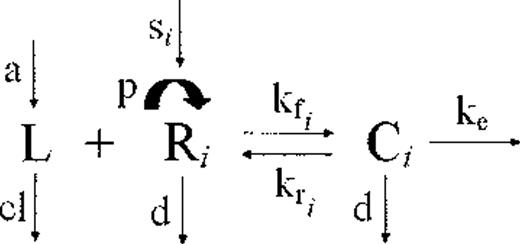
The binding affinity of IL-7 to the IL-7 receptor (CD127) and the number of CD127 receptors per cell were estimated through a [125I]IL-7 binding assay with the use of fresh PBMCs from 2 healthy donors. As shown in the insert plots in Figure 6, the Scatchard analysis of the data in both binding experiments yielded a curvilinear plot, confirming that CD127 receptors display dual-affinity binding to IL-7, as previously reported.21,27 The high-affinity receptors had a Kd of 0.155nM (95% CI, 0-0.52nM) and 0.112nM (95% CI, 0-0.52nM) and 678 (95% CI, 265-1378) and 588 (95% CI, 241-1368) CD127 receptors per cell, respectively, with kd = kr/kf; the low-affinity receptors had a Kd of 9.84nM (95% CI, 5.8-22.97nM) and 11.56nM (95% CI, 5.63-72.5nM) and 9058 (95% CI, 7321-13 944) and 7608 (95% CI, 5607-27 003) CD127 receptors per cell, respectively. Thus, ∼ 7% of the CD127 receptors display high-affinity binding.
![Figure 6. Equilibrium binding of [125I]IL-7 to fresh PBMCs from 2 healthy donors. The inserts show Scatchard representation of specific binding; r = molecules/cell bound.](/view-large/figure/7176092/zh89991177830006.jpeg)
Equilibrium binding of [125I]IL-7 to fresh PBMCs from 2 healthy donors. The inserts show Scatchard representation of specific binding; r = molecules/cell bound.
Equilibrium binding of [125I]IL-7 to fresh PBMCs from 2 healthy donors. The inserts show Scatchard representation of specific binding; r = molecules/cell bound.
The following parameters and assumptions were used in simulating the model described in equation 1: an estimate for the clearance rate of IL-7 (cl) is obtained from the decay in plasma levels observed after administration of rhIL-7 in HIV-1 infected patients.28 In that study, a clearance of 1 log in ∼ 20 hours was observed, which translates into a clearance rate (cl) of 0.115 hour−1. An estimate for the endocytosis rate, ke, of 0.1467 hours−1, is provided from the kinetics of the percentage of internalized CD127-bound receptors described in Carini et al.29 The receptor growth and disappearance rates, p and d, respectively, at steady state, are inferred from the proliferation and disappearance rates as estimated from in vivo labeling studies in HIV-infected patients,30 because the rates of change in receptors can be assumed to equal the rate of changes in CD127+ T cells. The association and dissociation rates are unknown from our study, because only their ratio could be estimated from the [125I]IL-7 binding assay; however, simulations showed low sensitivity to changes in kr or kf, whereas the dynamics of IL-7 changes are mostly dominated by their ratio (data not shown). The values of rate of free ligand entering the compartment (a), the source rate of receptors (si), and the baseline ligand-receptor complexes (Ci) were obtained from the steady state equations.
The model was simulated (in time scale of hours) for 720 days of ART therapy. The initial values of free ligand and free receptors and the fold-changes were obtained from the mean levels of serum IL-7 and mean number of CD127+ receptors from the 30 HIV+ patients who underwent therapy. The mean serum IL-7 level was 33.8 pg/mL (1.35 × 10⁻¹²M) at M0 and 18.7 pg/mL (7.47 × 10⁻¹³M) at M24 (IL-7 MW = 25 kDa). The mean number of CD127+ T cells in the blood was 201/μL and 578/μL at M0 and M24, respectively, which converts to receptor molar concentrations of 2.99 × 10⁻¹²M at M0 and 8.6 × 10⁻¹²M at M24. The receptor molar concentration was calculated from the total number of CD127 receptors estimated from the binding assay (8966/cell). The initial values for ligand-receptor complexes were obtained from the steady state solution. We used baseline (M0) steady state levels of growth and disappearance rates P = .001 hour−1 and d = 0.004 hour−1, respectively. Moreover, the growth rate [p(t)] during the course of the therapy is assumed to follow the observed pattern in proportion of proliferating CD127+ T cells as inferred from the Ki67 staining (linear interpolation between 2 adjacent time points), whereas the disappearance rate [d(t)] is assumed to normalize from its pretherapy steady state level after an exponential decay with a minimum threshold (fixed as posttherapy disappearance rate observed in patients treated with ART)30 of 3-fold lower compared with before therapy (Figure 7). The model was evaluated and updated with Runge-Kutta fourth-order continuous solver with a step size of 0.01 hour. With the use of the above-mentioned parameters, the model described in equation 1 shows that < 0.1% of total receptors (CD127) are occupied by the ligand at any time during the course of therapy (not shown).

Simulation of the model described in equation 1 for up to 24 months of ART. Theoretical curves predicted by the model (solid line), for the mean values of the concentration of receptors (CD127) and free ligand (serum IL-7 levels) in the group of 30 HIV+ patients at each time point (dots) are shown with the use of estimates observed in the blood compartment (A) or expected for the lymph node compartment (B). The receptor growth rate p(t) and the disappearance rate d(t) during the course of the therapy were assumed to follow the observed proportion of Ki67+ (proliferating) CD3+CD127+ T cells and an exponential decay kinetics, respectively (C). The mean values of low- and high-binding affinities from the 2 donors were used for simulations.
Simulation of the model described in equation 1 for up to 24 months of ART. Theoretical curves predicted by the model (solid line), for the mean values of the concentration of receptors (CD127) and free ligand (serum IL-7 levels) in the group of 30 HIV+ patients at each time point (dots) are shown with the use of estimates observed in the blood compartment (A) or expected for the lymph node compartment (B). The receptor growth rate p(t) and the disappearance rate d(t) during the course of the therapy were assumed to follow the observed proportion of Ki67+ (proliferating) CD3+CD127+ T cells and an exponential decay kinetics, respectively (C). The mean values of low- and high-binding affinities from the 2 donors were used for simulations.
Model simulations with the use of the concentration of CD127+ receptors in the blood show that the 2.8-fold increase of the CD127 receptors observed in the peripheral blood after 2 years of ART is not enough to reduce the free ligand concentration from the serum. However, most lymphocytes reside in the lymphoid tissues (lymph nodes and spleen), where lymphocytes are highly concentrated. With the use of the estimate that 70% of 2 × 10⁹ lymphocytes/g of lymphoid tissue in HCs are CD3+,31 (72% of which are CD127+, and normalizing on the CD127+ T-cell count in the blood at M0), the same model shows that a 2.8-fold increase of CD127 receptors in the lymphoid tissue is enough to decrease the free ligand concentration in the serum by 2.2-fold (Figure 7).
Our model also predicts an inverse association between the rates of change of IL-7 and CD127 receptors. Because these rates may change over time, instead of using linear regressions for constant rates, the nonparametric local linear mixed-effects modeling was applied for estimating the rates of change of IL-7 and CD127 as functions of time, as well as the correlation between the 2 rates. Figure 5A shows the correlations on the basis of the group of HIV+ patients who started ART: the correlation between the rate of change of IL-7 levels and that of CD3+CD127− population is close to zero and is nearly constant over time, whereas a negative correlation is observed between that of IL-7 levels and CD3+CD127+ population immediately after ART initiation. The same trend of correlation is also observed for the CD4+ T cells (which predominantly express the CD127 receptor) but not for the CD3+ or CD8+ T cells (Figure 5B).
Discussion
In this HIV+ cohort treated with ART for 2 years, we found that CD4+ T-cell subsets were not completely reconstituted and maintained elevated cycling longer in comparison to CD8+ T-cell subsets. The restoration of both CD4+ and CD8+ T cells was predominantly driven by increases in CD127+ naive and CM T cells. Despite the persistence of low CD4+ T-cell counts, serum IL-7 levels normalized by 1 year of ART, suggesting that tight homeostatic feedback may not significantly contribute to increases in IL-7 during lymphopenia. These data, in conjunction with mathematical modeling, suggest that the observed fluctuations of IL-7 after ART may be related to improved CD127-mediated clearance as T cells expressing CD127 are restored.
Many studies have previously reported that initiation of ART in HIV+ patients decreases T-cell cycling and increases naive T-cell restoration and CD127 expression in T cells.17,32-35 In our study all these variables were tested in concert and followed longitudinally with early post-ART time points to address specifically whether changes in the T cells expressing the IL-7 receptor could account for changes in serum IL-7 levels. The idea that IL-7 levels are elevated as a compensatory response to lymphopenia has much support, although the mechanism in humans (especially regarding IL-7 production) is not entirely clear. Napolitano et al found increased IL-7 in lymphocyte-depleted lymph nodes compared with hyperplastic specimens with the use of immunohistochemistry methods.10 However, this could have been because of the local accumulation of the cytokine in lymphopenic areas. Supranormal IL-7 levels were found in “CD4-exploders,” HIV+ people with very strong responses to ART,36 suggesting that CD4 T-cell count is significantly influenced by homeostatic control by IL-7. In a mouse model of lymphopenia CD4+ T-cell homeostatic proliferation was regulated through CD127 signaling on antigen presenting cells,9 and high IL-7 levels, either through lymphopenia or exogenous administration, actually decreased IL-7 production in stroma-derived cells and in APCs. Although this mechanism of controlling homeostatic proliferation through decreased IL-7 production was nicely proven in mice, we do not have adequate means of measuring IL-7 production in these cell types in humans.
With our compilation of all the relevant variables from a longitudinal cohort and novel mathematical model we show that there is consistency, although nonexclusively, with one of the 2 theories about increased IL-7 levels in lymphopenia. On the basis of the binding affinity of IL-7 for CD127 and the estimated number of receptors per unit mass of lymphoid organs, the concentration of this and probably other cytokines measured in the serum, appears to fall in the right order of magnitude to detect changes in the concentrations of its receptor. We saw that fluctuations in IL-7 levels during improvement of lymphopenia are less tightly dependent on CD4+ T-cell counts and more dependent on receptor-mediated clearance.
The model may not be comprehensive in considering all factors affecting the clearance of IL-7. Collagen deposition in the lymphoid tissue of HIV+ patients may be ∼ 4- to 10-fold higher than in the uninfected person.37 There are no data about fibronectin concentrations or changes during ART; however, in vitro binding assays suggest ultra-low affinity of IL-7 to fibronectin (∼ 100- and 10 000-fold lower compared with the 2 types of affinities observed in our PBMC in vitro data).38 On the basis of our modeling, the changes in CD127 receptors are indeed sufficient to explain the decrease in IL-7 observed during therapy, but further investigations will be needed to address the role of fibronectin or specific types of collagen in the clearance of free IL-7. In addition, peripheral blood was exclusively used in our study, but in SIV-infected macaques it has been clearly shown that CD127 expression in T cells tightly correlates between tissues and blood.39
Although it is agreed that IL-7 levels are increased in untreated HIV infection, there is no consensus as to whether they return to normal levels with effective ART. We found increased IL-7 levels that normalized at 1 year of ART similar to others,40,41 including a recent large longitudinal study.42 However, lack of normalization of serum IL-7 with ART has also been reported,17,43 but the ART-treated patients were not virologically suppressed or the observed IL-7 levels were much lower than in our cohort. In most studies though, including animal models,15 a clear association has been seen between CD4+CD127+ T cells with changes in serum IL-7 level.
Other mechanisms may also contribute to high IL-7 levels or may affect the responsiveness of cells to IL-7 in lymphopenia. The response to IL-7 may depend on thymic function and age. Reconstitution of naive T cells with ART is decreased in older HIV+ patients,44 and a relation between T-cell counts and IL-7 in patients with low thymic volume has been observed.45 It has also been shown that T-cell responsiveness to IL-7 may be impaired by HIV infection34 because of overstimulation and desensitization of the pSTAT5 signaling pathway. However, the near absence of viremia at M6 of ART and beyond would suggest that normal responses to IL-7 should be restored, yet we found persistently decreased CD4+ T-cell count with normalized IL-7 levels at 1 and 2 years on ART.
Serum IL-7 levels did not independently correlate with T-cell cycling. In fact, a transient increase in CD4+ and CD8+ T-cell cycling despite lowering IL-7 levels was seen at M1, suggestive of improved survival of cycling T cells. In addition, increased cycling of CD4+ T cells and CD4+CD127+ cells was maintained longer than in the CD8+ T cells even after viral suppression, suggesting the possibility of lineage-specific proliferative response to lymphopenia. Data reported recently46 clearly showed lineage-specific T-cell homeostatic proliferation in sooty mangabeys and rhesus macaques after either CD4+ or CD8+ T-cell depletion. This is also in agreement with the observation that different stimuli may be driving the cycling of CD4+ (lymphopenia) and CD8+ (viremia) T cells47 in HIV. It has been suggested that CD8 recovery in response to homeostatic proliferation may be more effective than CD4 recovery and, in fact, that very high IL-7 levels may even hinder CD4+ T-cell recovery.9 Although CD8+ T cells express much lower levels of CD127 than CD4+ T cells, they can be responding to other cytokines, including IL-2 and IL-15. In our study we also found evidence of the preferential recovery of CD127+ naive and CM subsets in both CD4+ and CD8+ T cells and corroborated findings of CD4+ T-cell recovery that lags behind that of CD8+ T cells. However, the lack of restoration of CD4+CD127+ cell numbers (and also CM and naive subsets) and the increase above baseline levels of the number of CD8+CD127+ and naive CD8+CD127+ T cells, along with a normalization of the number of CD3+CD127+ T cells/μL by M24 could be indicative of blind homeostasis that has been shown in mouse48 and BM transplantation studies49 and has both been supported and refuted in HIV infection.50 The fact that CD4+ T cells had not normalized and yet IL-7 levels and cell cycling decreased by M12 to M24 would suggest that the subset-specific homeostatic forces may be more evident and efficient in extreme lymphopenia. It is possible that the duration of lymphopenia and the relative changes of specific T-cell subsets that express cytokine receptors, and thus regulate available levels of circulating cytokines, could be the determinants of whether homeostasis would appear blind or lineage specific.
In conclusion, we provide evidence that receptor-mediated clearance could account for changes in IL-7 during reconstitution of T cells after initiation of ART. These findings offer support for the involvement of a more complex regulation of T-cell homeostasis in human conditions of severe lymphopenia that goes beyond a simple IL-7 feedback production loop.
Presented in poster form at the 16th Conference on Retroviruses and Opportunistic Infections, Montreal, QC, February 8-11, 2009; at the Keystone Symposium for “HIV Immunobiology: from Infection to Immune Control,” Keystone, CO, 2009; and “HIV Pathogenesis” in Banff, AB, March 27 through April 1, 2008.
The online version of this article contains a data supplement.
The publication costs of this article were defrayed in part by page charge payment. Therefore, and solely to indicate this fact, this article is hereby marked “advertisement” in accordance with 18 USC section 1734.
Acknowledgments
The authors thank the patients for their generous donation of time and study samples as well as the outpatient clinic 8 staff at NIH who managed their care. They also thank Dr Scott Durum for helpful discussions and Dr Dean Follmann for statistical assistance.
This work was supported in part by the Intramural Research Program of NIAID/NIH.
National Institutes of Health
Authorship
Contribution: I.S., M.D.M., and S.W.R. designed research; I.S. and J.M.M. provided study samples; J.N.H., S.S., S.W.R., P.D., and M.D.M. performed research experiments and collected data; S.S., Z.H., and M.D.M. performed statistical analysis; I.S., M.D.M., S.S., and J.N.H. interpreted and analyzed data; S.S. and M.D.M. completed mathematical models and analysis; and J.N.H., I.S., M.D.M., and S.S. wrote the manuscript. All authors reviewed and contributed to the manuscript preparation.
Conflict-of-interest disclosure: The authors declare no competing financial interests.
Correspondence: Irini Sereti, Clinical and Molecular Retrovirology Section, Laboratory of Immunoregulation, NIAID, NIH, 10 Center Dr, Bldg 10, Rm 11B07A, Bethesda MD 20892; e-mail: isereti@niaid.nih.gov.

This feature is available to Subscribers Only
Sign In or Create an Account Close Modal