Abstract
Regulation of tissue-type plasminogen activator (tPA) depends on fibrin binding and fibrin structure. tPA structure/function relationships were investigated in fibrin formed by high or low thrombin concentrations to produce a fine mesh and small pores, or thick fibers and coarse structure, respectively. Kinetics studies were performed to investigate plasminogen activation and fibrinolysis in the 2 types of fibrin, using wild-type tPA (F-G-K1-K2-P, F and K2 binding), K1K1-tPA (F-G-K1-K1-P, F binding), and delF-tPA (G-K1-K2-P, K2 binding). There was a trend of enzyme potency of tPA > K1K1-tPA > delF-tPA, highlighting the importance of the finger domain in regulating activity, but the differences were less apparent in fine fibrin. Fine fibrin was a better surface for plasminogen activation but more resistant to lysis. Scanning electron and confocal microscopy using orange fluorescent fibrin with green fluorescent protein-labeled tPA variants showed that tPA was strongly associated with agglomerates in coarse but not in fine fibrin. In later lytic stages, delF-tPA-green fluorescent protein diffused more rapidly through fibrin in contrast to full-length tPA, highlighting the importance of finger domain-agglomerate interactions. Thus, the regulation of fibrinolysis depends on the starting nature of fibrin fibers and complex dynamic interaction between tPA and fibrin structures that vary over time.
Introduction
Fibrin may be viewed as a substrate according to 2 distinct definitions of the word: (1) a surface or layer supporting biologic activity and (2) a substance acted on by an enzyme. The mechanism of tissue-type plasminogen activator (tPA) stimulation by fibrin is by “colocalization” of tPA and plasminogen on fibrin, which acts as a substrate (definition 1) or template; and the plasmin generated in this way is the enzyme that digests fibrin substrate (definition 2). Fibrinolysis encompasses both processes, which are distinct but overlapping. The role of fibrin structure in regulating the whole process of fibrinolysis is not completely understood, and there is disagreement over published results. For example, fibrin fiber diameter can be manipulated by thrombin, such that higher thrombin concentrations produce a fine network of thin fibers, whereas fibrin polymerization at lower thrombin concentration results in more lateral aggregation and produces clots composed of thicker fibers, as reviewed.1 It has been observed from gross changes in turbidity of fibrin clots undergoing lysis2,3 that clots made of thicker fibers appear to lyse more rapidly than clots made from fine fibers. However, this simple relationship has been questioned because clots made of thicker fibers are more turbid and lysis may appear to be faster when followed optically if turbidity is not normalized to correct for different starting values.1 Furthermore, it has been noted from more detailed microscopic studies that thinner fibers are more susceptible to lysis than thick fibers, yet this relationship is not reflected in the behavior of whole clots.4,5 The relationship between clot turbidity and lysis is further complicated by frequently observed transient increases in turbidity during lysis6 and by some observations that some peptides corresponding to portions of fibrin(ogen) can increase turbidity and confer resistance to lysis.7 Thrombi formed from whole blood, as opposed to purified fibrinogen and thrombin, are clearly more complex and heterogeneous environments for fibrinolysis (or thrombolysis) to occur, but the nature of the fibrin present is generally observed to resemble the coarse fiber fibrin organization seen in purified systems formed at lower thrombin concentrations.8 Hypofibrinolysis is a risk factor for cardiovascular disease and can arise in a number of situations because of abnormal clot structure, for example, where there are high fibrinogen concentrations9,10 or because of variants of fibrinogen that form high density fibrin clots.11,12 However, additional constituents, such as platelets, cause local disturbances where fibrin structure becomes denser, more closely resembling the fine fibrin structures seen in clots made at high thrombin concentrations.13
Fibrinolysis is dependent on plasminogen and tPA binding via specific domain interactions. There are 5 distinct structural domains in tPA, comprising Finger-Growth factor-Kringle 1-Kringle 2-protease (F-G-K1-K2-P). Many potential binding sites are available on tPA for cells and fibrin, but the most important sites for fibrinolysis appear to be in the F and K2 domains,14-16 and refined mutagenetic analysis indicates that K2 is less involved in fibrin binding than expected.17 However, studies performed to date do not take into consideration the specific roles of tPA domains in fibrin of variable structure as well as their distinct function in the rearranging fibrin architecture in the course of lysis.
Hence, there is a need to clarify the influence of fibrin structure on rates of fibrinolysis. We have established a number of tools to facilitate such investigations by examining the effects of fibrin both as a template and enzyme substrate. Precise kinetic assays and microscopic studies applied in conjunction with engineered variants of tPA, including fluorescent chimeras, have highlighted the interplay between tPA binding, changes in clot structure during lysis, and regulation of fibrinolysis. These findings have important implications in situations of hypofibrinolysis and failed thrombolytic therapy.9,18
Methods
Kinetic methods
Plasminogen activation assays were performed as previously described19 in microtiter plates using preformed clots of 9.1μM fibrinogen (human, plasminogen depleted from Calbiochem), incorporating 166nM plasminogen (Chromogenix), which were overlaid with a solution containing plasminogen activator and plasmin chromogenic substrate (S-2251, Val-Leu-Lys-p-nitroaniline, Chromogenix). The WHO 2nd IS for thrombin (01/580, NIBSC)20 was used as a pure form of α-thrombin to clot fibrinogen, where 1 IU/mL is equivalent to approximately 10.7nM by active site titration.21 Fibrin formed using different thrombin concentrations is referred to for clarity using a subscript notation, fibrinx, where x denotes approximate concentration in nanomolar units. Thus, for example, fibrin100 denotes fibrin clotted by thrombin at approximately 10 IU/mL, which has been rounded to 100nM. Plasmin generated at the clot interface was monitored by following absorbance at 405 nm (Thermomax plate reader, Molecular Devices), and rates of plasminogen activation were calculated as previously described.19 To investigate both plasminogen activation and fibrin lysis by tPA, under the same reaction conditions, parallel plates containing identical clots were prepared and to one plate activator and S-2251 were added to initiate plasminogen activation and measurement, whereas plasminogen activator in buffer only (no S-2251) was added to the second plate. In both cases, readings were taken at dual wavelengths of 405 and 650 nm, and kinetic data were prepared by subtracting 650 nm readings from 405 nm readings to remove interference from any bubbles developing in the clots. In the plate with S-2251, data were analyzed to calculate plasminogen activation rates as absorbance change per second squared over the initial period of reaction (< 0.1 absorbance change, before depletion of substrates22 ). In the second plate without S-2251, data from changes in clot turbidity were used to estimate rates of fibrinolysis, expressed as time to a percentage lysis, where 100% lysis is taken as initial absorbance minus final absorbance of the fibrin clots in the wells. Mineral oil was added to all reactions to prevent evaporation. Large sets of kinetic data from 96-well plates monitored over 8 hours with readings at 1-minute intervals were manipulated using Excel spreadsheets and routines written in Matlab (The Mathworks).
To measure fibrinolysis as collapse of clots, independent of turbidity measurements, the “bubble release” method followed was as described by Sands et al.23 Briefly, 0.2 mL of a mixture of a series of dilutions of plasminogen activator and thrombin solution was dispensed into tubes to which 1.0 mL of a mixture of fibrinogen and plasminogen was added. The final concentrations in the reaction mixtures were 3.8μM fibrinogen, 200nM plasminogen, thrombin 100 or 10nM, and tPA 2.4 to 0.3nM in doubling dilutions. Activity of recombinant tPA and variants is traceable to the WHO 3rd International Standard for tPA (98/714, NIBSC) and 10 000 IU is equivalent to 20 μg or 0.31 nmol. Clots form rapidly in this system, and bubbles can be seen to develop within the clot. The time taken for clot lysis was recorded as the time the bubbles are suddenly released and rise to the surface.
Generation and purification of tPA variants
Three tPA domain variants were expressed: normal tPA (domains Finger, Growth factor, Kringle 1, Kringle 2, and Protease, F-G-K1-K2-P), K1K1-tPA (F-G-K1-K1-P), and delF -tPA (G-K1-K2-P). To achieve this, derivatives of pFastBac-tPA24 were generated by site-directed mutagenesis via QuikChange (Stratagene) according to the manufacturer's protocol. All constructs were checked by sequence analysis. A deletion mutant lacking the finger domain (V4-V46) was generated and designated pFastBac-FΔ. A variant in which the kringle 2 domain was replaced by a second copy of the kringle 1 domain, designated pFastBac-tPA:k1k1, was generated in 3 steps: the first step was to delete k2 (C180-C261) to generate pFastBac-tPA:k2Δ. In the second step, a silent SgrA1 restriction site was introduced upstream of the k2 deletion site D179:S262, and a silent AflII restriction site was introduced downstream of D179:S262. In the third step, k1 was amplified by PCR using primers, including SgrA1 and AflII restriction sites, and the product was ligated to pFastBac-tPA:k2Δ to create pFastBac-tPA:k1k1.
pFastBac-tPA (and derivatives) were modified to express C-terminal fusions of tPA with enhanced green fluorescent protein as follows: the “stop” codon of tPA was modified to an XbaI restriction site by site-directed mutagenesis. The XbaI fragment of plasmid enhanced green fluorescent protein (GFP; Clontech) that includes the coding sequence for enhanced GFP was ligated to the XbaI site, introduced at the 3′ end of tPA, to create an in-frame fusion, including a 10-amino acid linker. Details of primers are available on request.
tPA and derivatives, expressed as previously described,24 were purified directly from the culture media using an Erythrina inhibitor (Landing Biotech)–Sepharose column. Proteins were visualized by sodium dodecyl sulfate-polyacrylamide gel electrophoresis for size and purity and quantitated using Coomassie Plus Protein Assay Reagent (Pierce Chemical) with a standard curve of tPA quantified by amino acid analysis (Alta Bioscience).
SEM imaging of fibrin
Fibrinogen (human, plasminogen-depleted from Calbiochem), 6μM in 25mM Na-phosphate pH 7.4 buffer containing 75mM NaCl and 500nM plasminogen, was clotted for 1 hour at 37°C with 5 or 100nM thrombin in Eppendorf tubes (pretreated with 25% [vol/vol] Triton X-100 solution for 1 hour and thoroughly washed with water). Thereafter the whole clot (50 μL) was transferred into 500 μL 40nM tPA. The digestion was stopped at various times with ice-cold 100mM Na-cacodylate, pH 7.2, buffer for 5 minutes followed by fixation in 1% (vol/vol) glutaraldehyde for 30 minutes. The fixed samples were dehydrated in a series of ethanol dilutions (20%-96% vol/vol), 1:1 mixture of 96% (vol/vol) ethanol/acetone, and pure acetone followed by critical point drying with CO2 in E3000 Critical Point Drying Apparatus (Quorum Technologies). The specimens were mounted on adhesive carbon discs, sputter coated with gold in SC7620 Sputter Coater (Quorum Technologies), and images were taken with scanning electron microscope EVO40 (Carl Zeiss) and the manufacturer's software.
Confocal microscopic imaging in the course of fibrinolysis
Fibrin clots were prepared from 6μM fibrinogen containing 90nM AlexaFluor 546-conjugated fibrinogen (Invitrogen) and 500nM plasminogen, clotted with thrombin for 30 minutes in 0.5-mm-high chambers constructed from glass slides. Thereafter 40nM tPA-GFP was added to the edge of the clot, and the fluorescence (excitation wavelength 488 nm, emission wavelength 525 nm for tPA-GFP detection, and excitation wavelength 543 nm, emission wavelength 575 nm for Alexa-546-fibrinogen detection) was monitored with Confocal Laser Scanning System LSM510 (Carl Zeiss) taking sequential images of the fluid-fibrin interface at a distance of approximately 50 μm from the glass surface with identical exposures and laser intensities using Plan-Neofluar 20×/0.5 objective. When indicated in a figure, the color channels of the original images were separated or overlaid using the Image Processing Toolbox of Metlab (The Mathworks).
Results
Enzyme kinetic studies
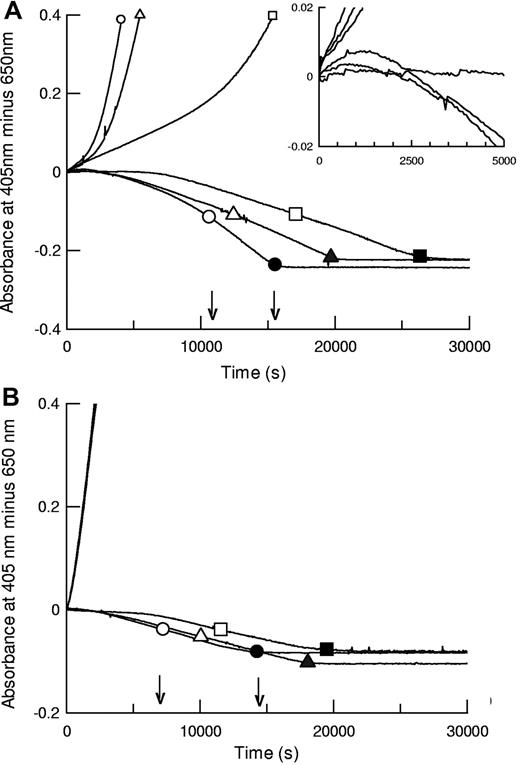
The kinetic methods developed here, using preformed clots where plasminogen activator is added externally, permit parallel monitoring of plasminogen activation and fibrin degradation under the same reaction conditions. Plasminogen activation is followed by absorbance at 405 nm (hydrolysis of chromogenic substrate), and fibrin lysis is monitored in a parallel plate by following decreasing turbidity in identical clots. Representative data from such an analysis are shown in Figure 1 for coarse fiber, open pore fibrin, and thin fiber, fine mesh fibrin, formed using 5nM thrombin (fibrin5) and 100nM thrombin (fibrin100), respectively. Morphometric analysis of fibrin structure from scanning electron microscope (SEM) images is presented in supplemental data (available on the Blood Web site; see the Supplemental Materials link at the top of the online article). For the 3 tPA variants shown, both plasminogen activation and overall fibrinolysis rates were affected by the different fibrins studied. Figure 1 shows that times for 50% and 100% lysis were shorter in fibrin100, but assessment of fibrinolysis rates by absorbance was complicated by transient increases in absorbance during lysis of fibrin5 (see inset), which may lead to underestimation of the rate of fibrin degradation in fibrin5, especially at earlier times. Behavior of the domain variants was significantly different in the coarse and fine fibrin, particularly the delF-tPA, which demonstrated a marked lag in plasminogen activation in fibrin5. Fibrin100, by contrast, appeared to provide an efficient surface for all the tPA variants studied.
Fibrinolysis and plasminogen activation kinetics by tPA (circles), K1K1-tPA (triangles), and delF-tPA (squares) in fibrin clots prepared using different thrombin concentrations. Thrombin concentrations used to form the clots were 5nM (A, fibrin5) and 100nM (B, fibrin100). Representative data using 0.075nM tPA are shown for plasmin generation measured by hydrolysis of S-2251 at 405 nm (positive absorbance change) and simultaneously for lysis of fibrin clots (negative absorbance change, in the absence of S-2251). Large open symbols represent the time points to 50% lysis of each clot; and the solid symbols show the time points for 100% lysis. Small symbols are included on plasminogen activation curves for identification purposes. The 3 plasminogen activation curves for the tPA variants in panel B are very close, indicating very similar activities. The arrows show the times for 50% and 100% lysis for tPA. The inset is a magnified view focusing on the initial rates of fibrinolysis in fibrin5.
Fibrinolysis and plasminogen activation kinetics by tPA (circles), K1K1-tPA (triangles), and delF-tPA (squares) in fibrin clots prepared using different thrombin concentrations. Thrombin concentrations used to form the clots were 5nM (A, fibrin5) and 100nM (B, fibrin100). Representative data using 0.075nM tPA are shown for plasmin generation measured by hydrolysis of S-2251 at 405 nm (positive absorbance change) and simultaneously for lysis of fibrin clots (negative absorbance change, in the absence of S-2251). Large open symbols represent the time points to 50% lysis of each clot; and the solid symbols show the time points for 100% lysis. Small symbols are included on plasminogen activation curves for identification purposes. The 3 plasminogen activation curves for the tPA variants in panel B are very close, indicating very similar activities. The arrows show the times for 50% and 100% lysis for tPA. The inset is a magnified view focusing on the initial rates of fibrinolysis in fibrin5.
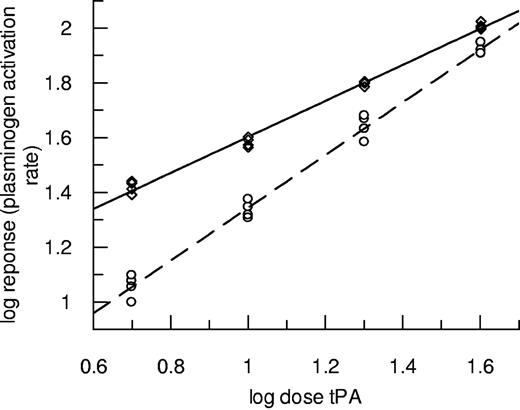
Experiments using the same techniques over a range of tPA concentrations were performed, and results for plasminogen activation are presented in Figure 2. In this case, data from fibrin10 are discussed to avoid the complications caused by transient increases in absorbance seen during lysis of fibrin5. Figure 2 shows how the potency of tPA was markedly affected by the nature of the fibrin, but the effect diminished as tPA concentration increased. In this representative example, the lowest tPA dose (0.15nM) had a more than 2-fold higher potency as plasminogen activator in fibrin100 compared with fibrin10. By contrast, fibrinolysis rates in the same clots (turbidity changes in the clot, not shown) were slower in fibrin100 such that tPA potency was calculated to be 73.8% (62.1%-87.1%) as active in fibrin100 compared with fibrin10. These results highlight the resistance of fine fibrin as a substrate for plasmin counter to its augmented function as a template for plasminogen activation. Fibrin100 was also found to be more resistant to fibrinolysis in the “bubble release” assay format, where measurements do not depend on clot turbidity changes and tPA is incorporated throughout the clot (data not shown). In this format, there was also a small but consistent decrease in tPA potency in fibrin100 such that tPA had 86.9% (83.1%-90.8%) potency compared with fibrin10.
Plasminogen activation rates over a range of tPA concentrations in the presence of fibrin formed at high and low thrombin concentrations. Clots were prepared using thrombin at 100nM fibrin100 (◇, solid line) or 10nM fibrin10 (○, dashed line) and subsequently tPA from 0.15 to 1.2nM overlaid in the presence of S-2251. Initial rates were measured up to an absorbance change of 0.1. Data are plotted as log dose tPA (nM added to the clot) versus log response (rate of change of absorbance/s2 × 109).
Plasminogen activation rates over a range of tPA concentrations in the presence of fibrin formed at high and low thrombin concentrations. Clots were prepared using thrombin at 100nM fibrin100 (◇, solid line) or 10nM fibrin10 (○, dashed line) and subsequently tPA from 0.15 to 1.2nM overlaid in the presence of S-2251. Initial rates were measured up to an absorbance change of 0.1. Data are plotted as log dose tPA (nM added to the clot) versus log response (rate of change of absorbance/s2 × 109).
Microscopy studies
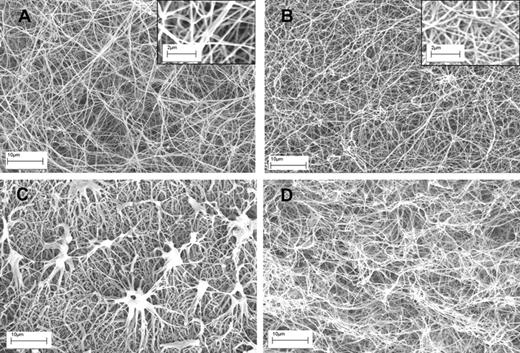
Having established these opposing effects of fibrin structure on plasminogen activation and fibrinolysis, changes in fibrin during lysis were investigated using microscopy. Figure 3 shows typical examples of clots formed of fibrin100 and fibrin5, before and after 10 minutes of lysis, after the addition of tPA. There are clear differences in fiber thickness and pore structure as seen in Figure 3A and B, but also significant differences in the progress of lysis between the 2 types of fibrin (Figure 3C-D). Significantly, fibrin5 lysis is accompanied by the generation of discrete, dense fibrin structures not seen in fibrin100. Although there are some methodologic differences in the approach used in Figure 3 to prepare clots for SEM and the clots used in the kinetic experiments in Figure 1, it may be proposed that these aggregates are responsible for the transient increase in absorbance noted for fibrin5 lysis, which peak during the first 30 minutes or so after tPA addition.
SEM images of fibrin clots formed using high and low thrombin concentrations before and during lysis using tPA. (A-B) The structure of fibrin5 and fibrin100 formed at 5 and 100nM thrombin, respectively. Insets are areas from panels A and B at higher magnification to show more detail of the fibrin fiber structure present in each clot. (C-D) The same kind of fibrin but after 10 minutes of lysis after the addition of tPA to the surface of the clot. (C) Characteristic fibrin aggregate structures in fibrin5 that are not formed in fibrin100.
SEM images of fibrin clots formed using high and low thrombin concentrations before and during lysis using tPA. (A-B) The structure of fibrin5 and fibrin100 formed at 5 and 100nM thrombin, respectively. Insets are areas from panels A and B at higher magnification to show more detail of the fibrin fiber structure present in each clot. (C-D) The same kind of fibrin but after 10 minutes of lysis after the addition of tPA to the surface of the clot. (C) Characteristic fibrin aggregate structures in fibrin5 that are not formed in fibrin100.
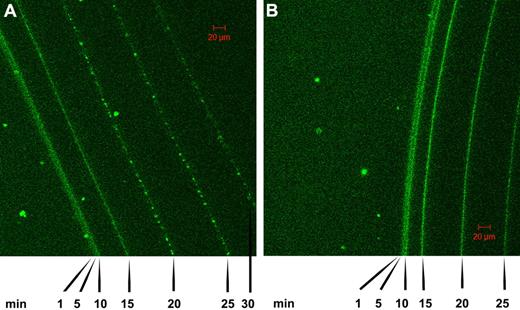
Further work on the time course of lysis of fibrin clots was performed using confocal microscopy in conjunction with tPA-GFP added to clots formed of fibrin100 and fibrin5 and the progress of lysis followed over time, as shown in Figure 4. These data also indicate that the front of the fibrin clot moves faster in fibrin5 than in fibrin100, in general agreement with the trends discussed above in relation to Figures 1 and 2. There are also morphologic differences that develop in the 2 fibrins as indicated by the pattern of fluorescence, which reflects tPA distribution. Specifically, it can be seen that a granular pattern develops in the fibrin5 lysis series in contrast to the homogeneous fluorescence pattern that is maintained in the fibrin100 series. Time-lapse animations of the lysis front movement in fibrin100 and fibrin5 are also available in supplemental Videos 1 and 2.
Confocal microscopy showing a time course of lysis of fibrin clots formed using high and low thrombin concentrations in the presence of tPA-GFP. (A) The pattern of tPA binding and fibrin lysis as the fibrin front recedes for fibrin formed using 5nM thrombin (fibrin5). (B) The same time course for fibrin formed at 100nM thrombin (fibrin100). Images were taken at the indicated time after the addition of tPA-GFP, and the green channel components of the sequential frames were overlaid in a single image for presentation purposes. A characteristic granular pattern of fluorescence can be seen at the lysis front in fibrin5, whereas in fibrin100 the tPA-GFP is distributed more homogeneously.
Confocal microscopy showing a time course of lysis of fibrin clots formed using high and low thrombin concentrations in the presence of tPA-GFP. (A) The pattern of tPA binding and fibrin lysis as the fibrin front recedes for fibrin formed using 5nM thrombin (fibrin5). (B) The same time course for fibrin formed at 100nM thrombin (fibrin100). Images were taken at the indicated time after the addition of tPA-GFP, and the green channel components of the sequential frames were overlaid in a single image for presentation purposes. A characteristic granular pattern of fluorescence can be seen at the lysis front in fibrin5, whereas in fibrin100 the tPA-GFP is distributed more homogeneously.
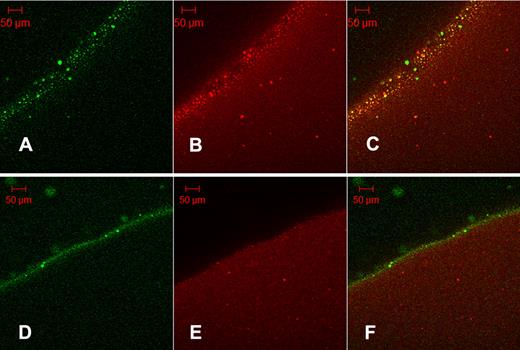
It may be proposed that the granules seen in Figure 4A are the same protein aggregates seen in Figure 3C as their size is of the same order: SEM aggregates mean diameter = 5.74 μm (SD = 2.01 μm, n = 25); and fluorescent grains mean diameter = 5.04 μm (SD = 2.23 μm, n = 20). Further evidence of the binding of tPA to aggregates formed in fibrin5 is provided in Figure 5, using orange fluorescent fibrinogen converted to fluorescent fibrin100 and fibrin5. Fluorescent aggregates in orange fibrin5 are coincident with the green fluorescence of tPA-GFP (Figure 5C), whereas the distribution of red and green fluorescence is more homogeneous in the lower panels showing fibrin100.
Colocalization of tPA-GFP with fibrin protein aggregates. Orange-labeled fibrinogen was clotted with thrombin at 5nM (A-C, fibrin5) or 100nM (D-F, fibrin100) and fibrinolysis initiated with the addition of tPA-GFP. After 35 minutes of lysis, micrographs were taken of green fluorescence (A,D) and red fluorescence (B,E). (C,F) Overlays of the corresponding single fluorescent micrographs for each fibrin type. Fibrin5 shows the granular pattern of fibrin aggregates noted previously, which can be seen to bind tPA. (C) Overlay also shows a number of green particles of precipitated tPA-GFP. Fibrin100 displays a narrow zone of bound tPA and few fibrin aggregates.
Colocalization of tPA-GFP with fibrin protein aggregates. Orange-labeled fibrinogen was clotted with thrombin at 5nM (A-C, fibrin5) or 100nM (D-F, fibrin100) and fibrinolysis initiated with the addition of tPA-GFP. After 35 minutes of lysis, micrographs were taken of green fluorescence (A,D) and red fluorescence (B,E). (C,F) Overlays of the corresponding single fluorescent micrographs for each fibrin type. Fibrin5 shows the granular pattern of fibrin aggregates noted previously, which can be seen to bind tPA. (C) Overlay also shows a number of green particles of precipitated tPA-GFP. Fibrin100 displays a narrow zone of bound tPA and few fibrin aggregates.
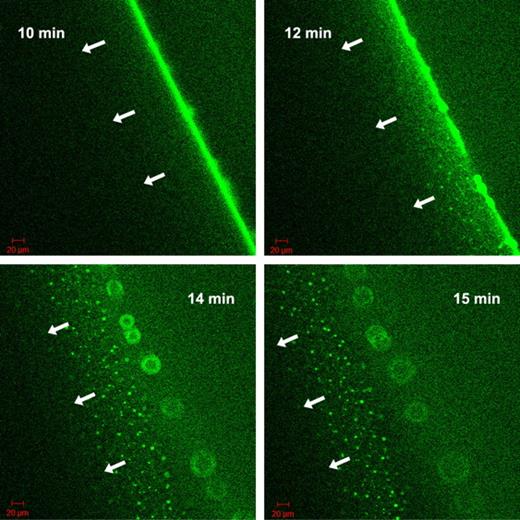
The nature of the fluorescent grains formed by tPA-GFP at the fibrin5 interface was approached with known modifiers of the tPA-fibrin interactions. Carboxypeptidase B, which eliminates new C-terminal lysine residues exposed in the course of fibrin digestion by plasmin, slows down the migration of the lytic front in the experimental setup described in Figure 4, if it is added to fibrin at the time of clotting at 8 U/mL (data not shown). However, it does not eliminate the fluorescent aggregates, only delays their formation on the surface of fibrin5 (supplemental Figure 2). 6-aminohexanoate, which interferes both with tPA and plasmin(ogen) binding to fibrin, dissipates the granular pattern of tPA-GFP related fluorescence only at high concentrations ≥ 0.1mM, where binding and inhibition of plasmin can become significant (supplemental Figure 2). Thus, the exposure of C-terminal lysines does not seem to be a crucial step for the formation of fibrin aggregates. Attention was therefore focused on tPA finger domain binding to fibrin aggregates and the known interaction with cross β-sheet structures.25 Thioflavin T, which binds to cross β-sheets,26 was used to probe the presence of cross β-sheets in fibrin aggregates formed during lysis. Colocalization of tPA-GFP to sites that also bind thioflavin T was observed (supplemental Figure 3). To further investigate the significance of tPA finger domain in interactions with fibrin aggregates, a finger-deleted variant of tPA with fused GFP was constructed and used in the experimental setup of Figure 4. In agreement with the observations of a lag phase seen in Figure 1 using delF-tPA, delF-tPA-GFP took longer to accumulate at the fibrin-solution interface of clots formed of fibrin5. However, a strong fluorescence signal at the boundary was eventually seen, and lysis progressed with the formation of some heterogeneous fluorescent aggregates. These were not as strong or long lived as with tPA-GFP, and the lytic front was observed to dissipate after 15 minutes, leaving a wider distribution of fluorescent tPA signal than seen with tPA-GFP. Subsequently, the fluorescence of delF-tPA-GFP was seen to travel ahead of the clot edge, leaving behind structures that appeared as a “starburst” pattern. delF-tPA-GFP is a marker for C-terminal lysines, which appear to have a wide distribution around the lysis front. By contrast, tPA-GFP was very focalized on aggregates in fibrin5, suggesting that finger domain-fibrin aggregate binding is particularly important. Selected snapshots of the progress of clot lysis in fibrin5 with delF-tPA-GFP are shown in Figure 6 and presented as a time lapse movie in supplemental Video 3. Once again, the situation with fibrin100 was notable for a lack of distinct larger fluorescent aggregates and a more homogeneous zone of lysis. However, there was also evidence of delF-tPA-GFP moving ahead of the fibrin/buffer interface, which forms the lytic front when full-length tPA-GFP is the activator.
Progress of fibrinolysis in fibrin5 formed using 5nM thrombin with delF-tPA-GFP. The 4 panels are snapshots of the distribution of delF-tPA-GFP during fibrinolysis at the times indicated in the upper corner. Initial binding and concentration of the delF-tPA-GFP to the surface of the clot were slow, but after 10 minutes a narrow zone of concentrated activator formed. Subsequently, some tPA diffused ahead of the fibrin-buffer interface and was associated with some fibrin aggregates; a proportion of delF-tPA-GFP also remained close to the fibrin-buffer interface appearing as a “starburst” pattern.
Progress of fibrinolysis in fibrin5 formed using 5nM thrombin with delF-tPA-GFP. The 4 panels are snapshots of the distribution of delF-tPA-GFP during fibrinolysis at the times indicated in the upper corner. Initial binding and concentration of the delF-tPA-GFP to the surface of the clot were slow, but after 10 minutes a narrow zone of concentrated activator formed. Subsequently, some tPA diffused ahead of the fibrin-buffer interface and was associated with some fibrin aggregates; a proportion of delF-tPA-GFP also remained close to the fibrin-buffer interface appearing as a “starburst” pattern.
Discussion
Fibrinolysis and clot structure
Fibrinolysis may be considered as a 2-step process,27 and the work presented here shows the value of approaching plasminogen activation and the whole process of fibrinolysis as distinct yet overlapping processes. We observe that the behavior of fibrin as a template for the stimulation of plasminogen activation is independent of the effectiveness of fibrin as a substrate for plasmin. A key feature in understanding the regulation of fibrinolysis highlighted in the current study is the formation of fibrin aggregates, identified in the microscopic images of Figures 3 and 5 and clearly able to bind tPA as shown in Figures 4 and 5. The relationship between fibrin structure and rate of fibrinolysis is not simple and is complicated by several factors. These include (1) the lack of correlation of effectiveness of fibrin as a stimulator for plasminogen activation and a substrate for plasmin, (2) the different dose dependencies of tPA concentration and rate seen in Figure 2, and (3) the presence of fibrin aggregates, which cause a heterogeneous distribution of tPA and also interfere with absorbance measurements. These confounding factors may account for conflicting results in some studies discussed in the Introduction,1 which could arise from subtle differences in experimental arrangements.
Although it is often observed that coarse clots formed of thick fibers lyse more rapidly than clots of thin fibers, at the molecular level of fibrin fibers it has been noted that individual thin fibrin fibers may be dissolved more rapidly than thick fibers.4,5 A model has been proposed whereby plasmin cuts fibers by focused lateral transection (“crawling”) rather than more general surface erosion,28 and larger fibers lead to more efficient fibrinolysis by assisting the “crawling” of plasmin.29 A somewhat different interpretation points to reduced dimensionality of enzyme action and more focalized attack of plasmin in coarse fibers.5 In their detailed analysis and modeling of fibrin degradation, Walker and Neshiem30 also concluded that fibrin lysis by plasmin occurs through limited discrete cleavage that is nonrandom. Furthermore, they observed that large fibrin degradation product fragments released from clots could reassociate, and the affinity of the fibrin degradation products for the clot was proportional to their size. It is possible that the large protein structures seen during early stages of fibrinolysis in fibrin5 (Figure 3C) are these aggregates of fibrin degradation products that bind to the clot in the zone of lysis and are responsible for the transient increases in absorbance noted above (Figure 1A inset). Fibrinolysis in fine structured fibrin100 clots would thus result in smaller fragments, with weaker affinity and less tendency for rebinding to the clot. The concentration of tPA around fibrin aggregates would lead to focal points of activation of plasminogen, and this may be a mechanism of localized fibrinolysis that does not rely entirely on the behavior of plasmin.
tPA domain-fibrin binding
Results obtained using tPA variants have allowed us to dissect out the role of tPA domains at different stages of fibrinolysis. Microscopic and kinetic studies using tPA variants and GFP chimeras that interact via F and K2 domains together, and F or K2 alone, allow us to follow the initial interactions and subsequent pattern of tPA-fibrin binding to build up a more complete picture of the process of fibrinolysis. A number of previous studies have been published that use fluorescein isothiocyanate plasminogen or fibrinogen31 as a marker of fibrinolysis or colloid labeled fibrinogen or FITC-tPA.4 The current confocal microscopic studies focused on tPA behavior using tPA-GFP, which is specifically labeled at the C-terminus to avoid interference with binding domains yet retains high enzymatic activity (not shown). The process followed in Figure 4 highlights the marked difference in tPA-binding behavior and lysis of fibrin100 and fibrin5, where a homogeneous distribution or distinct “hot spots” of bound tPA are seen, respectively. Similar fluorescent agglomerates have also been seen when FITC-plasminogen has been used as the marker for active fibrinolysis during studies of fibrin clots formed in plasma, whose fibrin structure corresponds to the coarse morphology found in clots made from purified fibrinogen at low thrombin concentrations.31,32 Thus, fibrin aggregates have previously been shown to bind plasminogen, and we have extended these observations using time-lapse microscopy and kinetic studies to highlight the role of the finger domain in localizing tPA to fibrin aggregates formed in coarse fibrin. Where fine fibrin is the stimulator of tPA, the domain structure has less influence and plasminogen activation is more efficient with all variants examined than in coarse fibrin. The limiting factor in fine fibrin fibrinolysis is plasmin digestion of fibrin.
Questions surrounding the precise binding sites for tPA and plasminogen in fibrin have been around for many years, and several specific sites that are cryptic in fibrinogen but become exposed in fibrin have been proposed.7,33 However, the search has not been entirely successful, and no consensus has been achieved on binding sites and strength to fully explain tPA stimulation by fibrin. Caution has been advised over this “reductionist” approach,34 and more evidence is required if specific binding sites are to be definitively established. From the current work, a model of fibrinolysis characterized by 3 distinct modes of binding can be proposed. Initial F-dependent binding sites of special significance in coarse fibrin appear to be important. Subsequently, K2-dependent binding to new C-terminal lysine sites will further enhance binding in a well-characterized way.35,36 Data presented above (supplemental Figure 3) that colocalize tPA binding and thioflavin T binding supports the idea that the third mode of tPA binding is to a cross-β structural motif.25 tPA is known to be a promiscuous binding molecule, and previous studies have identified tPA binding to aggregates with a variety of proteins, including biotherapeutics and amyloid plaques.37,38 We propose that the aggregates seen in Figure 3C strongly bind tPA, and the finger domain is important for this interaction. This mode of binding is necessarily important in regulating the pattern of fibrinolysis in coarse fibrin. In the absence of the finger domain, tPA is more widely distributed within coarse fibrin and tPA K2 accumulation is a marker for the presence of C-terminal lysines. The recently described thermodynamically unstable β-hairpins in the αC-domains of fibrinogen39 may be involved in the cross-β structures of the agglomerates. The αC-domains are sensitive sites of plasmin action40 and, after early digestion of this region, swapping of these β-hairpins may stabilize focally and transiently the partially degraded fibrin oligomers.
The in vitro studies presented here, including purified components, may be questioned as nonphysiologic. However, a number of reports suggest that fibrin(ogen) structure in vivo is very important in regulating rates of fibrinolysis. Inevitably, fibrin and clot structure/function relationships are more complicated in vivo than suggested here as clots will include numerous proteins and cells and other constituents, which can affect structure and hence lysis rates.27 Recent work has also identified polyphosphate released from platelets41,42 and red blood cells43 as important regulators of fibrin fiber thickness, clot structure, and mechanical properties. Further work is required to identify all the factors that regulate clot structure, fibrin binding, plasminogen activation, and fibrin lysis. However, Finger-dependent focalization on cross-β structures in coarse fibrin agglomerates generated primarily at the fibrin surface during fibrinolysis may represent a previously underappreciated, distinct mechanism of tPA binding that has important implications for the regulation of fibrinolysis.
The online version of this article contains a data supplement.
The publication costs of this article were defrayed in part by page charge payment. Therefore, and solely to indicate this fact, this article is hereby marked “advertisement” in accordance with 18 USC section 1734.
Acknowledgments
The authors thank Györgyi Oravecz for technical assistance.
This work was supported by the Wellcome Trust (083174), British Heart Foundation (F5/06/021), Hungarian Scientific Research Fund (OTKA 75430 and OTKA K60123), and Medical Scientific Council (ETT 005/2009).
Wellcome Trust
Authorship
Contribution: C.L. and K.K. designed the research, analyzed the data, and wrote the paper; L.S. performed the SEM experiments; K.K. performed the confocal experiments; C.T., S.C.W., and M.M.C.G.S. designed and expressed the tPA variants; and M.M.C.G.S., C.L., and S.C.W. performed kinetic experiments.
Conflict-of-interest disclosure: The authors declare no competing financial interests.
Correspondence: Colin Longstaff, Biotherapeutics Group, National Institute for Biological Standards and Control, S Mimms, Herts, United Kingdom EN6 3QG; e-mail: colin.longstaff@nibsc.hpa.org.uk.

This feature is available to Subscribers Only
Sign In or Create an Account Close Modal