Abstract
B-cell chronic lymphocytic leukemia is associated with immune suppression and an altered T-cell repertoire with expansion of memory cells. Cytomegalovirus (CMV) is a common herpes virus that elicits a strong virus-specific T-cell immune response after infection. We studied the CMV-specific CD4+ T-cell response in 45 patients and 35 control subjects and demonstrated that it was markedly expanded in the patient group, averaging 11% of the CD4+ pool compared with 4.7% in controls. The magnitude of the CMV-specific CD4+ immune response increased with disease stage and was particularly high in patients who received chemotherapy. Within this group, the CMV-specific response comprised over 46% of the CD4+ T-cell repertoire in some patients. Serial analysis revealed that CMV-specific immunity increased during treatment with chemotherapy and remained stable thereafter. CMV-seropositive patients exhibited a markedly altered CD4+ T-cell repertoire with increased numbers of CD45R0+ T cells and a reduction in CD27, CD28, and CCR7 expression. Overall survival was reduced by nearly 4 years in CMV-seropositive patients, although this did not reach statistical significance. CLL patients therefore demonstrate an expansion of the CD4+ CMV-specific immune response, which is likely to contribute to the immunological and clinical features of this disease.
Introduction
Infectious disease is a major cause of morbidity and mortality in patients with B-cell chronic lymphocytic leukemia (B-CLL).1 Hypogammaglobulinemia and impaired function of the cellular immune response can occur early in the course of disease and contribute to the state of immune suppression.2-4 In addition, treatments used to control the disease can themselves render patients susceptible to infection.5 Many studies of T-cell phenotype and function have been undertaken in patients with B-CLL and have shown abnormalities in the phenotype of CD4 and CD8 T cells, including inversion of the normal CD4:8 ratio6,7 and the accumulation of terminally differentiated effector T cells with relative absence of naive precursors.8,9 It has been suggested that these abnormalities contribute to the immunosuppression of B-CLL and indicate the presence of a tumor-specific CD4+ T-cell response.
Cytomegalovirus (CMV) is a human herpes virus that infects the majority of the human population during their lifetime. Infection is associated with the development of a vigorous CMV-specific immune response, which typically comprises over 2% of the CD8+ T-cell repertoire.10 In states of immunosuppression, such as following allogeneic transplantation or during HIV infection, this value is often increased and is felt to represent cellular response to subclinical viral reactivation occurring during immunosuppression.11 It has been shown that the CMV-specific CD8+ T-cell response is similarly increased in patients with B-CLL and the phenotype of CMV-specific cells was that of late differentiated effector cells.12 Much less is known about the activity of the CD4+ CMV-specific T-cell response in either healthy donors or in patient groups. The development of intracellular staining for cytokine production has led to the opportunity to study CMV-specific CD4+ T-cell immunity in more detail.
CMV seropositivity is associated with the accumulation of memory T cells and has been shown as a confounding factor in the analysis of T-cell phenotype in patients with rheumatoid arthritis and in normal ageing.13-15 Here, we have analyzed CD4+ CMV-specific T-cell responses in patients with B-CLL and have compared these to an age-matched control group. We found that the CMV-specific CD4+ T-cell response is markedly increased in patients with B-CLL and show that this is associated with chemotherapy. These changes are so marked as to determine the total CD4+ T-cell repertoire of the patient.
Methods
Patient population
Seventy-three patients with B-CLL were recruited from the University Hospitals NHS Trust, Birmingham, United Kingdom. Ethical permission was obtained from the South Birmingham Ethics Committee and written informed consent was provided in all cases in accordance with the Declaration of Helsinki. Patients were studied at all stages of disease. A control group of 49 healthy donors was recruited from a local cohort of volunteers with a median age of 66 years (range 62–81), of which 35 donors were CMV seropositive. CMV seropositivity was determined by serological testing and 45 patients were found to be CMV seropositive (Table 1). There were no differences between the CMV-seropositive and seronegative groups with respect to age, stage of disease, or treatment history. Ten milliliters of blood was obtained at each time point and analysis used either whole blood samples or peripheral blood mononuclear cells (PBMC) obtained by density centrifugation and maintained in RPMI (GIBCO) with 10% fetal calf serum (FCS; GIBCO). The absolute lymphocyte count of each sample was measured by automated cell analysis on a Coulter counter.
Clinical characteristics of the patients studied
| Parameter . | CMV seropositive patients . | CMV seronegative patients . |
|---|---|---|
| No. of patients | 45 (61.6%) | 28 (38.4%) |
| Median age, y (range) | 74.6 (52-87) | 71.8 (56-89) |
| Sex | ||
| Male | 26 (53.7) | 17 (60.8%) |
| Female | 19 (46.3) | 11 (39.2%) |
| Stage of disease | ||
| Binet A | 29 (64.4%) | 18 (64.7%) |
| Binet B + C | 16 (35.6%) | 10 (35.3%) |
| Treatment | ||
| No history of therapy | 30 (66.6%) | 19 (70.3%) |
| Positive history | 15 (33.3%) | 8 (29.7%) |
| Complications (during study period) | ||
| Autoimmune phenomena | 2 | 3 |
| Zoster reactivation | 2 | NF |
| Pneumonia | 1 | NF |
| Shingles | 1 | NF |
| Guillain-Barre syndrome | 1 | NF |
| Other cancers | 4 | NF |
CMV indicates cytomegalovirus; and NF, not found.
Measurement of absolute CD3+, CD4+, and CD8+ T-cell counts
Absolute T-cell counts were determined by use of FACS analysis in combination with the combined lymphocyte and monocyte counts obtained from full blood count analysis. The antibodies anti-CD3–FITC, anti-CD4–PE, and anti-CD8–Tricolor were used to stain whole blood samples and the percentage of each population was determined by FACS analysis. This percentage was then used to determine the absolute number of each T-cell subset.
Detection of CMV-specific CD4+ T cells
CMV-specific CD4+ T cells were determined according to the previously described method.16 Briefly, whole blood in sodium heparin was aliquoted into 15-mL propylene tubes and the costimulatory monoclonal antibodies anti-CD28 and anti-CD49d were added to the samples at a 1 μg/mL final concentration. CMV lysate or staphyloccocal enterotoxin B (positive control) was added to the tubes and a negative control without antigen was used in all cases. Tubes were incubated at 37°C for 6 hours, and in the presence of 10 μg/mL of the cytokine secretion inhibitor brefeldin A for the final 4 hours. EDTA was added at final concentration of 2mM for 15 minutes at room temperature, and then the red blood cells were lysed and the leukocytes were fixed by incubation of cultures with FACS lysing solution (Becton Dickinson) for 10 minutes. Cells were washed in PBS containing 0.5% bovine serum albumin (BSA) and 0.1% sodium azide, and then permeabilized by incubation in FACS permeabilization buffer (Becton Dickinson) for 10 minutes at room temperature. The cells then were washed in PBS with BSA and sodium azide prior to staining.
Immunofluorescent staining and flow cytometric analysis
The following monoclonal antibodies were used in this study: anti-IFNγ (FITC, PE); anti–IL-2 (FITC, PE); anti-TNFα (FITC, PE); mouse IgG2a (FITC, PE); mouse IgG1 (FITC, PE); CD49d (pure); and CD28 (pure); all antibodies were obtained from Becton Dickinson Immunocytometry Systems. CD4 (ECD, PC5); CD8 (FITC); CD3 (PE); CD69 (PC5); CD57 (FITC, PE); CD28 (FITC); CD45RO (FITC, PE); CD45RA (FITC); CD27 (FITC); CD38 (FITC); and HLA-DR (FITC) antibodies and mouse IgG1 (ECD, TC) were obtained from Coulter Immunology. CD28 (TC) and CD8 (TC) antibodies were from Caltag. CCR7 (FITC) antibody was obtained from R&D Systems. Cells were incubated with directly conjugated monoclonal antibodies for 30 minutes in room temperature in the dark. After staining, cells were washed, fixed in 1% paraformaldehyde in PBS and then kept at 4°C until flow cytometric analysis. Four-color flow cytometric analysis was performed on a flow cytometer. Between 2 × 10⁴ to 5 × 10⁴ CD4+ cells were typically collected. Cells were gated on SSC versus FSC to collect lymphocytes and then on CD4+ cells versus SSC. Data were analyzed using WinMDI software and displayed as dot plots of cytokine versus CD69 fluorescence.
Materials
CMV Ag, strain AD169, was purchased from Microbix Biosystems Inc. staphyloccocal enterotoxin B and Brefeldin A were purchased from Sigma; and FACS lysing and Permeabilization solution from Becton Dickinson.
Statistical analysis
Kaplan-Meier analysis was used to determine the influence of CMV seropositivity on survival in patients with B-CLL. A log-rank test was used to test the difference between the 2 survival curves.
Results
T-cell count is increased in patients with B-CLL, and CMV-seropositive patients exhibit an increment in CD3+ and CD8+ T-cell counts
The number of CD3+, CD3+CD4+ and CD3+CD8+ lymphocytes was initially determined in peripheral blood from patients with B-CLL and an age-matched control group. The CD3+ T-cell count was increased by over 2 fold in B-CLL patients compared with controls (Table 2). Furthermore, CMV seropositivity was associated with an increased CD3+ cell count in both the patients (CMV seropositive 2648/mL (175-9936) vs CMV seronegative 2225/mL (113-8996, P = .042) and the control group (CMV seropositive 1100/mL (290-2670) vs CMV seronegative 792/mL, (192-976) P = .02).
Absolute T-cell count in B-CLL patients and control group
| T-cell subpopulations (no/μL) . | B-CLL patients . | Age-matched controls . | ||||
|---|---|---|---|---|---|---|
| CMV seropositive . | CMV seronegative . | P . | CMV seropositive . | CMV seronegative . | P . | |
| CD3+ | 2648 (175-9936) | 2225 (113-8996) | .042 | 1100 (290-2670) | 792 (192-976) | .02 |
| CD4+ | 1139 (123-4072) | 1262 (57-5183) | .14 | 467 (153-981) | 566 (185-780) | .10 |
| CD8+ | 1457 (151-7573) | 1072 (49-6377) | .019 | 541 (117-1043) | 175 (122-656) | .0007 |
B-CLL indicates ; and CMV, cytomegalovirus.
The CD4+ T-cell count was also increased in B-CLL patients in comparison to the control group but was not influenced by CMV serostatus. Indeed, the CD4+ T-cell count was marginally decreased in CMV-seropositive individuals in both the patient (1139/mL vs 1262/mL) and control groups (467/mL vs 566/mL) but this did not reach statistical significance.
CMV seropositivity had a particularly marked effect on the CD8+ T-cell count in both the patient and control groups. Within the patient group, the mean CD8+ T-cell count in CMV-seropositive donors was 1460/mL compared with 1070/mL in the CMV-seronegative group (P = .019). In the control group, the corresponding values were 541/mL and 175/mL, respectively (P < .001), and this observation likely reflects the reported increase in the number of CMV-specific CD8+ T cells that has been observed in CLL patients.12
Of interest, patients with B-CLL exhibited increased T-cell counts compared with the control group, irrespective of CMV serostatus. The reasons for this are unknown but could reflect an increased immune component against other infectious agents or a potential tumor-specific immune response.
The number of CMV-specific CD4+ T cells is increased in patients with B-CLL
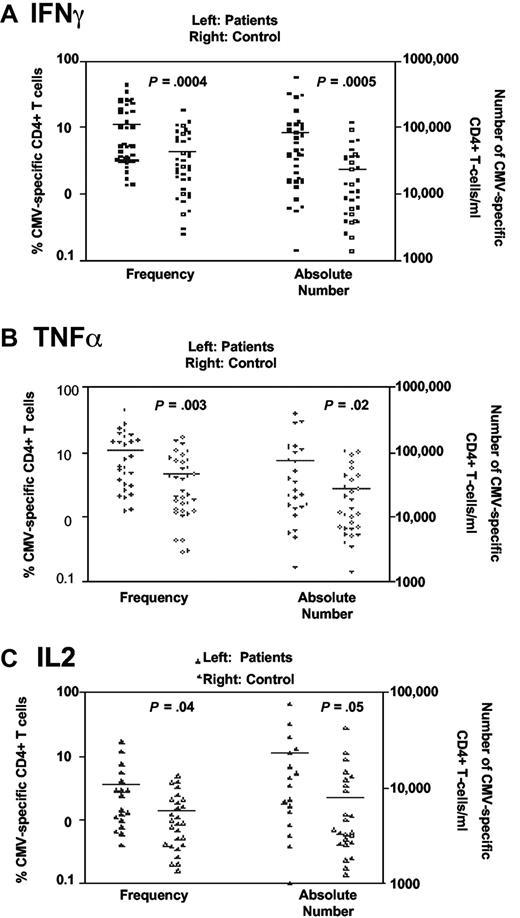
Blood samples were obtained from CMV-seropositive B-CLL patients and age-matched controls and the number of CMV-specific CD4+ T cells was determined by cytokine flow cytometry (CFC). CMV lysate was used as a source of antigenic stimulation prior to analysis of IFNγ, TNFα, or IL-2 expression within the CD3+CD4+ T-cell subset (Figure 1).
Higher frequencies of CMV-specific CD4+ T cells are present in patients with B-CLL. CMV-specific CD4+ responses were assessed using CFC following stimulation of whole blood using CMV lysate. CMV-specific T cells were determined by production of intracellular (A) IFNγ, (B) TNFα, or (C) IL-2. A higher frequency and absolute number of CMV-specific CD4+ T cells were present in CMV-seropositive patients relative to the age-matched CMV-seropositive control group (n = 35).
Higher frequencies of CMV-specific CD4+ T cells are present in patients with B-CLL. CMV-specific CD4+ responses were assessed using CFC following stimulation of whole blood using CMV lysate. CMV-specific T cells were determined by production of intracellular (A) IFNγ, (B) TNFα, or (C) IL-2. A higher frequency and absolute number of CMV-specific CD4+ T cells were present in CMV-seropositive patients relative to the age-matched CMV-seropositive control group (n = 35).
The CMV-specific CD4+ T-cell response was expressed as a percentage of the total CD4+ T-cell repertoire and was found to be significantly increased in B-CLL patients (Figure 1). This was the case when CFC was determined by expression of either IFNγ, TNFα, or IL-2 (mean frequency 11% compared with 4.3% for IFNγ; 11% vs 4.6% for TNFα; and 3.6% vs 1.3% for IL-2). A lower frequency IL-2 response to CMV stimulation was seen in both the patient and control groups. The absolute number of CMV-specific CD4+ T cells was more markedly increased (3.5 fold) in CLL patients compared with the control group (83 900/mL vs 24 100/mL for IFNγ, 79 300/mL vs 26 900/mL for TNFα; and 23 200/mL vs 7850/mL for IL-2).
CMV-specific CD4+ T cells are most markedly increased in CLL patients with advanced stages of disease
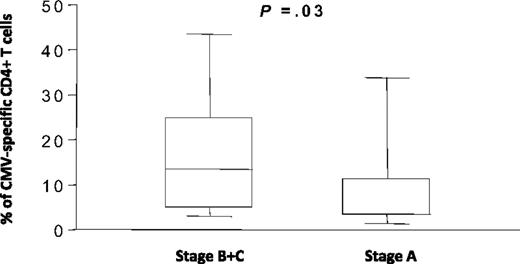
In order to determine the parameters that might influence the increase in CMV-specific CD4+ T cells in B-CLL patients, the frequency of CMV-specific CD4+ T cells was compared in patients with different stages of disease. A significant increase in the frequency of CMV-specific CD4+ T cells was seen in patients at Binet stages B and C compared with patients at stage A of the disease (Figure 2). The mean value in patients with advanced disease was 15.2% (range 1.7%–43%) of the CD4+ pool compared with 8.2% (1.4%–34%) in patients at stage A disease (P = .03).
The frequency of CMV-specific CD4+ T cells in B-CLL patients is increased in advanced disease. The frequency of CMV-specific CD4+ T cells was determined by IFNγ production and grouped according to the Binet stage of disease. CMV-specific CD4+ T cells represented 8.2% of the CD4+ T-cell pool in patients with stage A disease (n = 29) compared with 15.2% in patients at Binet stages B and C (n = 16).
The frequency of CMV-specific CD4+ T cells in B-CLL patients is increased in advanced disease. The frequency of CMV-specific CD4+ T cells was determined by IFNγ production and grouped according to the Binet stage of disease. CMV-specific CD4+ T cells represented 8.2% of the CD4+ T-cell pool in patients with stage A disease (n = 29) compared with 15.2% in patients at Binet stages B and C (n = 16).
An increase in CMV-specific CD4+ T cells is associated with treatment for CLL
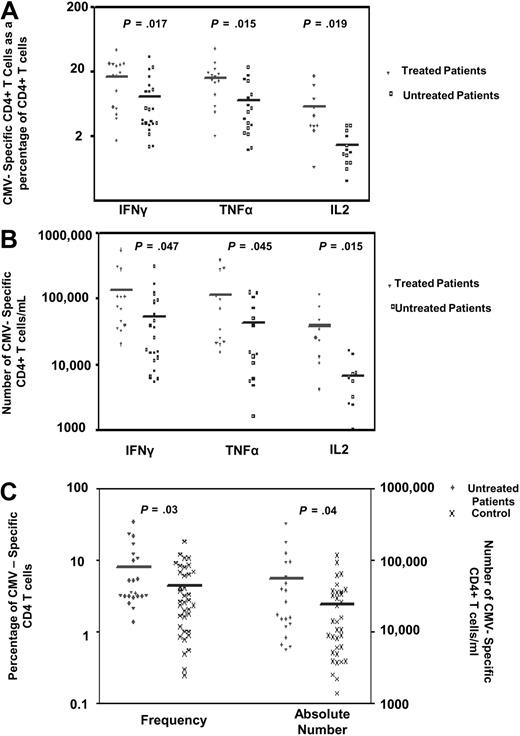
The increased CMV-specific CD4+ T-cell response that was observed in patients with advanced disease might reflect a response to treatment, so patients were subdivided according to whether or not they had been treated for their disease. A significant increase in the CMV-specific CD4+ T-cell response was observed in association with a history of treatment (Figure 3A,B). The mean percentage of CMV-specific CD4+ T cells was 17%, 16%, and 5.8% for IFNγ, TNFα, and IL-2 CFC, respectively, in patients with a history of treatment compared with 8.06%, 7.08%, and 1.41% in untreated patients (P = .017, P = .015, and P = .019, respectively). As treatment can be associated with a decrease in the lymphocyte count, it was felt to be important to identify the absolute CMV-specific T-cell count in these groups. Despite the potentially immune suppressive effects of chemotherapy, the mean number of CMV-specific CD4+ T cells was increased in treated patients at 138 000/mL, 116 000/mL, and 39 200/mL for IFNγ, TNFα, and IL-2 responses, respectively, compared with 55 900/mL, 42 400/mL, and 6270/mL in untreated patients (P = .047, P = .045, and P = .015 respectively).
The frequency of CMV-specific CD4+ T cells is increased in patients with a history of treatment. CMV-specific CD4+ T cells were measured in CMV-seropositive patients and expressed (A) as a percentage of the CD4+ T-cell pool or (B) as an absolute number. The mean percentage of CMV-specific CD4+ T cells was 17%, 16%, and 5.8% for IFNγ, TNFα, and IL-2 responses, respectively, in patients with a history of treatment compared with 8.06%, 7.08%, and 1.41%, respectively, in untreated patients (P = .017, P = .015, and P = .019). The mean number of CMV-specific CD4+ T cells in CMV-seropositive treated patients was 138 300/mL, 115 800/mL, and 39 200/mL for IFNγ, TNFα, and IL-2 responses, respectively, compared with 55 900/mL, 42 400/mL, and 6270/mL in untreated patients (P = .047, P = .045, and P = .015, respectively). (C) A significant difference was observed in the frequency and number of IFNγ-positive CMV-specific CD4+ T cells between untreated CMV-seropositive patients and the CMV-seropositive control group (mean 8.06% of CD4+ T cells compared with 4.3%, P = .03, and 55 900/mL compared with 24 100/mL, P = .04; n = 35).
The frequency of CMV-specific CD4+ T cells is increased in patients with a history of treatment. CMV-specific CD4+ T cells were measured in CMV-seropositive patients and expressed (A) as a percentage of the CD4+ T-cell pool or (B) as an absolute number. The mean percentage of CMV-specific CD4+ T cells was 17%, 16%, and 5.8% for IFNγ, TNFα, and IL-2 responses, respectively, in patients with a history of treatment compared with 8.06%, 7.08%, and 1.41%, respectively, in untreated patients (P = .017, P = .015, and P = .019). The mean number of CMV-specific CD4+ T cells in CMV-seropositive treated patients was 138 300/mL, 115 800/mL, and 39 200/mL for IFNγ, TNFα, and IL-2 responses, respectively, compared with 55 900/mL, 42 400/mL, and 6270/mL in untreated patients (P = .047, P = .045, and P = .015, respectively). (C) A significant difference was observed in the frequency and number of IFNγ-positive CMV-specific CD4+ T cells between untreated CMV-seropositive patients and the CMV-seropositive control group (mean 8.06% of CD4+ T cells compared with 4.3%, P = .03, and 55 900/mL compared with 24 100/mL, P = .04; n = 35).
These data raised the possibility that the increment in the CMV-specific CD4+ T-cell response was influenced solely by treatment for CLL rather than the underlying disease itself. However, a comparison between the untreated patient group and controls revealed a significant increase in both the frequency and number of CMV-specific CD4+ T cells between untreated patients and the control group (mean 8.06% vs 4.3% of CD4+ T cells, P = .03 and 55 900/mL compared with 24 100/mL, P = .04; Figure 3C).
The CMV-specific CD4+ T-cell immune response increases during episodes of treatment with chemotherapy
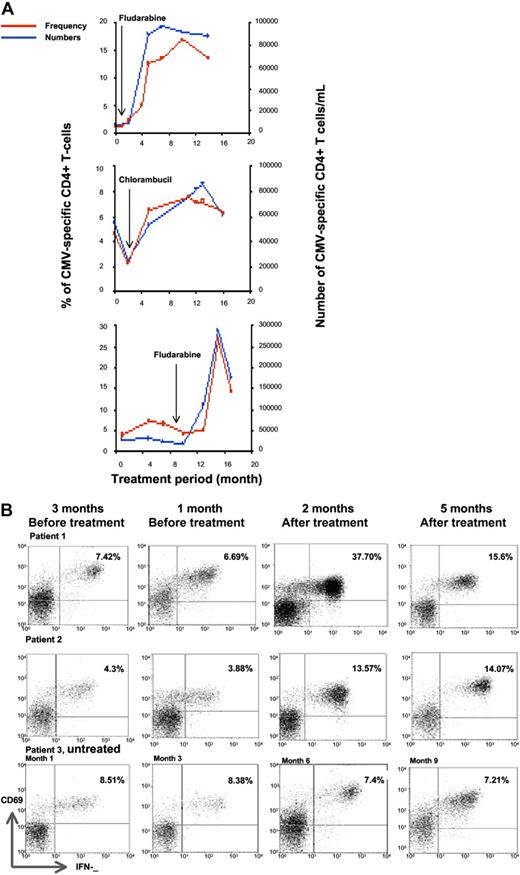
In order to understand the observation of an increased CMV-specific immune response in patients who had undergone treatment, we elected to perform serial analysis of the immune response during treatment episodes. Two patients receiving monthly courses of fludarabine (40 mg/m2 orally for 5 days), as well as 1 patient receiving chlorambucil at a dose of 4 mg daily, were studied at monthly intervals.
The magnitude of the CMV-specific immune response, expressed either as a percentage of the CD4+ T-cell pool or as an absolute number of cells, increased markedly during treatment with chemotherapy, peaking at approximately 4 months following fludarabine treatment compared with a slower rise in those receiving chlorambucil (Figure 4A). In contrast, serial analysis of several patients who received chemotherapy more than 1 year ago showed stable or slowly falling numbers of CMV-specific T cells (Figure 4B). Patients who had not been treated also demonstrated stable T-cell numbers.
The proportion of CMV-specific CD4+ T cells increases markedly during treatment with chemotherapy. (A) The temporal kinetics of the CMV-specific CD4+ T-cell response was assessed in relation to treatment history. The frequency and absolute number of IFNγ-producing CD4+ T cells increases sharply during treatment with chlorambucil or fludarabine. (B) Examples of the kinetics of the CMV-specific CD4+ T-cell immune response in 3 patients who were studied serially at 3 monthly intervals. Patient 1 showed a stable immune response prior to commencing treatment with fludarabine, after which the CMV-specific CD4+ T-cell response peaked at 37.7% of the CD4+ T-cell pool after 2 months and then declined. Patient 2 received treatment with chlorambucil and also exhibited an increase in the CMV-specific CD 4+ T-cell immune response, which increased up to 5 months after treatment. Patient 3 was untreated and showed a stable CMV-specific immune response. FACS analysis was gated on CD4+ T cells and IFNγ expression is shown on the x-axis and CD69 on the y-axis. The absolute CD4 T-cell counts (cells/μL) were (A) 671, 540, 530, and 642 at 0, 4, 8, and 12 months; (B) 1104, 829, 800, and 983 at 0, 4, 8, and 14 months; and (C) 389, 377, 417, and 97 at 6, 10, 12, and 16 months, respectively.
The proportion of CMV-specific CD4+ T cells increases markedly during treatment with chemotherapy. (A) The temporal kinetics of the CMV-specific CD4+ T-cell response was assessed in relation to treatment history. The frequency and absolute number of IFNγ-producing CD4+ T cells increases sharply during treatment with chlorambucil or fludarabine. (B) Examples of the kinetics of the CMV-specific CD4+ T-cell immune response in 3 patients who were studied serially at 3 monthly intervals. Patient 1 showed a stable immune response prior to commencing treatment with fludarabine, after which the CMV-specific CD4+ T-cell response peaked at 37.7% of the CD4+ T-cell pool after 2 months and then declined. Patient 2 received treatment with chlorambucil and also exhibited an increase in the CMV-specific CD 4+ T-cell immune response, which increased up to 5 months after treatment. Patient 3 was untreated and showed a stable CMV-specific immune response. FACS analysis was gated on CD4+ T cells and IFNγ expression is shown on the x-axis and CD69 on the y-axis. The absolute CD4 T-cell counts (cells/μL) were (A) 671, 540, 530, and 642 at 0, 4, 8, and 12 months; (B) 1104, 829, 800, and 983 at 0, 4, 8, and 14 months; and (C) 389, 377, 417, and 97 at 6, 10, 12, and 16 months, respectively.
The expanded CMV-specific CD4+ T-cell pool determines the CD4+ T-cell repertoire in CMV-seropositive B-CLL patients
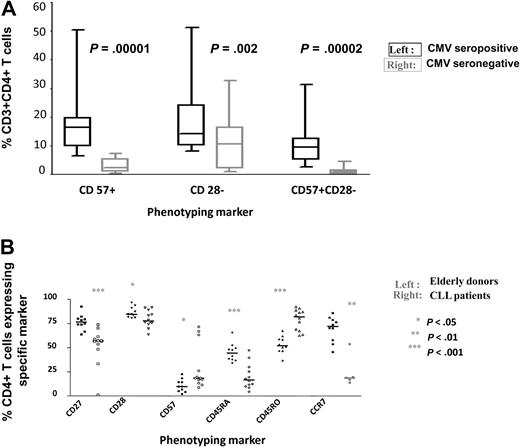
CMV-specific CD4+ populations exhibit a characteristic effector memory phenotype with a pattern of CD45RO+CD27−CD28−CD57+ expression.14,15 This profile was also seen in the analysis of CMV-specific responses in the CLL patient cohort (data not shown). Several abnormalities of the CD4+ T-cell repertoire have been reported in B-CLL patients6,9 and it was felt to be important to determine if CMV infection contributed to these features. CD28− and CD57+ T cells have previously been correlated with specific clinical features in CLL, such as neutropenia and clonal T-cell expansions. Use of multicolor cytometry allowed the study of coexpression of CD28 with CD57. We observed that 9.5% of CD4+ T cells showed a CD28−CD57+ phenotype in CMV-seropositive patients compared with <1% in the uninfected group (Figure 5A; P = .00002).
CMV-seropositive patients have an altered CD4+ T-cell repertoire. (A) CD28−CD57+CD4+ T cells are present almost exclusively in CMV-seropositive patients. PBMC were stained with monoclonal antibodies against CD8, CD28, and CD57, and the relative expression of CD28 and CD57 was determined on the CD8+ T-cell populations of CMV-seropositive and seronegative patients. Significant differences in the number of CD57+, CD28− and CD57+CD28− populations were observed between the 2 groups. (B) The phenotype of the CD4+ T-cell repertoire is markedly altered in CMV-seropositive patients (n = 12) compared with an age-matched CMV-seropositive control group (n = 10). PBMC were stained with monoclonal antibodies against CD4, CD27, CD28, CD57, CD45RA, CD45RO, and CCR7, and the relative expression of each marker was determined in the CD4+ T-cell population. Significant differences were observed between the 2 groups.
CMV-seropositive patients have an altered CD4+ T-cell repertoire. (A) CD28−CD57+CD4+ T cells are present almost exclusively in CMV-seropositive patients. PBMC were stained with monoclonal antibodies against CD8, CD28, and CD57, and the relative expression of CD28 and CD57 was determined on the CD8+ T-cell populations of CMV-seropositive and seronegative patients. Significant differences in the number of CD57+, CD28− and CD57+CD28− populations were observed between the 2 groups. (B) The phenotype of the CD4+ T-cell repertoire is markedly altered in CMV-seropositive patients (n = 12) compared with an age-matched CMV-seropositive control group (n = 10). PBMC were stained with monoclonal antibodies against CD4, CD27, CD28, CD57, CD45RA, CD45RO, and CCR7, and the relative expression of each marker was determined in the CD4+ T-cell population. Significant differences were observed between the 2 groups.
The CD4+ T-cell repertoire in healthy CMV-seropositive elderly donors shows a unique profile in relation to uninfected individuals,14 and we therefore went on to compare the CD4+ pool in CMV-seropositive subjects in both the CLL patient and control groups. CLL patients showed an altered pattern of expression of all phenotypic markers on the total CD4+ T-cell repertoire when compared with the control group (Figure 5B). In particular, there was reduced expression of the important costimulatory and survival molecules CD27 and CD28, as well as CD45RA and CCR7, which are observed on naive and/or central memory cells, respectively. In contrast, the expression of CD57 and CD45RO, both of which are expressed on late differentiated effector memory cells, was increased in CMV-seropositive patients. These findings show that although CMV modulates the CD4+ T-cell repertoire in healthy donors, these effects are much more marked in the CLL patient group, which reflects the great increase in the absolute CMV-specific CD4+ T-cell count.
More infectious episodes were seen in the CMV-seropositive cohort but CMV seropositivity had no effect on overall patient survival
Comparison of the clinical features of the CLL cohort in relation to CMV serostatus showed that major infectious episodes were more commonly observed within the CMV-seropositive cohort (Table 2). Clinical data were therefore obtained on the entire cohort in order to see if CMV seropositivity had any influence on patient survival. Information was available for 53 patients, of which 23 were dead and 30 were still alive at the time of analysis. For patients still alive, the median follow-up time was 105 months (range 6-212 months). Reverse Kaplan-Meier analysis of all patients gave a median follow-up time for all patients of 117 months.
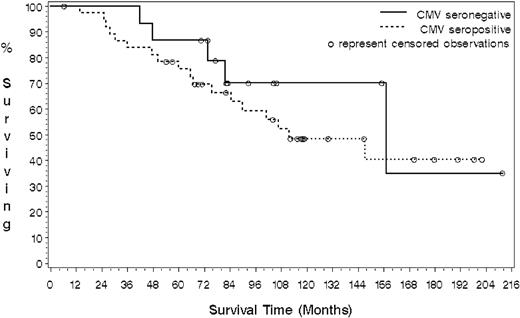
Sixteen patients were CMV seronegative (5 dead; 11 censored) and 37 were CMV seropositive (18 dead; 19 censored). No differences were observed in the type of chemotherapy used in each group. Those patients who were seronegative for CMV demonstrated an increased survival compared with CMV-seropositive patients, with a median survival estimated of 157 months compared with 112 months. (Figure 6) However, although the hazard ratio was 0.67 (95% CI: 0.25 to 1.81), indicating an observed 33% reduction in the risk of death for CMV-seronegative patients, this effect did not reach statistical significance due to the small cohort size (P = .42).
CMV-seronegative B-CLL patients show a trend toward increased overall survival compared with the CMV-seropositive group. Kaplan-Meier analysis was used to determine the influence of CMV seropositivity on survival in patients with B-CLL. A log-rank test was used to test the difference between the 2 survival curves. The median survival of the CMV-seronegative group was estimated at 157 months compared with 112 months for the CMV-seropositive patients (P = .42)
CMV-seronegative B-CLL patients show a trend toward increased overall survival compared with the CMV-seropositive group. Kaplan-Meier analysis was used to determine the influence of CMV seropositivity on survival in patients with B-CLL. A log-rank test was used to test the difference between the 2 survival curves. The median survival of the CMV-seronegative group was estimated at 157 months compared with 112 months for the CMV-seropositive patients (P = .42)
Discussion
A wide range of abnormalities within the T lymphoid system have been observed in patients with B-CLL. A characteristic feature is an increase in the CD45RO+ memory T-cell population and a comparable reduction in the CD45RA+ naive subset.17 Functional abnormalities18 and clonal expansions of T cells have also been observed,19 and it has been suggested that this may represent a tumor-specific immune response, although no antigenic specificity has been demonstrated. High numbers of cytotoxic T cells that express perforin have also been reported in the CD4+ compartment20 and, importantly, changes in the T-cell repertoire are associated with clinical complications. In particular, the development of neutropenia has been specifically associated with increased numbers of CD57+ T lymphocytes.21
In this report, we characterized the CD4+ T-cell response to cytomegalovirus in patients with B-CLL and have made a number of important observations. The most striking finding is that the absolute magnitude of the CMV-specific CD4+ T-cell response is increased by over 3 fold in patients with B-CLL. Indeed, in 2 patients, the proportion of the CD4+ T-cell pool directed against this virus was measured at 44% and 46%, respectively, which are among the highest values ever reported for the CMV-specific CD4+ T-cell response. As some CMV-specific CD4+ T cells may not have the capacity to produce IFNγ, and so would not be detectable by our cytokine assay, the true value may be even higher.
Having observed this effect, it became important to address the potential factors that might be related to the expansion. Initially, we looked at the effect of disease stage on the magnitude of CMV-specific immunity, and revealed that the CD4+ T-cell response doubled as patients progressed from Binet stage A to stage C, and patients with the greatest absolute levels of CMV-specific immunity were almost always those with progressive disease. When patients were subdivided on the basis of treatment history, the size of the CMV-specific immune response was shown to be far greater in patients who had undergone chemotherapy. Treatment with either chlorambucil or fludarabine doubled the magnitude of the CMV-specific cellular response. However, although treatment further expands the CMV-specific immune repertoire, it should be noted that the CD4+ T-cell response is increased in all CLL patients, irrespective of treatment history.
A prospective analysis of patients undergoing chemotherapy allowed us to determine the kinetics of the CMV-specific immune response. The CMV-specific CD4+ T-cell immune response increased by approximately 3 fold in patients during treatment with fludarabine or chlorambucil. Interestingly, the rate of this increase was dependent on the nature of the treatment, and the half-life of T-cell expansion was measured at 40 days during fludarabine treatment and 120 days during chlorambucil treatment.
The observation that the CMV-specific CD4+ T-cell immune response increased in patients with CLL is somewhat paradoxical given the immune suppression that is associated with this disease. However, the magnitude of the CMV-specific immune response is strongly boosted by episodes of viral reactivation,22 and we suspect that the immune suppression associated with CLL leads to subclinical viremia, which in turn triggers an increase in the CMV-specific immune response.
Strong evidence for this is seen in our prospective studies, where the CMV-specific immune response increases markedly within the first 3 months following immunosuppressive chemotherapy. Interestingly, we were not able to detect CMV reactivation by PCR within this cohort, which indicates that viral replication is effectively controlled in CLL patients undergoing chemotherapy with fludarabine or chlorambucil. However, it is to be expected that more intensive chemotherapy would subvert the ability of the immune response to respond to viremia, and this is likely to explain the high rates of CMV reactivation that are observed after treatment with alemtuzumab.23
CMV-specific CD4+ T cells exhibit a characteristic phenotype with high levels of expression of CD57 and CD45RO, but with greatly reduced levels of CD28. When we compared the total CD4+ T-cell pool in CLL patients to that of healthy donors, we observed that CMV seropositivity markedly influenced the global T-cell repertoire. This reinforces the understanding that chronic CMV infection is one of the most profound modulators of the lymphoid pool24 and should be taken into account in studies of immune profile in relation to disease.
Features such as an increase in memory or CD57+ T cells have been associated with clinical complications of CLL, and it became important for us to determine the influence of CMV seropositivity on the clinical characteristics of the patients within this cohort. Serious infections such as pneumonia and shingles were seen only in the CMV-seropositive patients, and as the relative usage of fludarabine was comparable in both groups, this might suggest that CMV infection increases the degree of immune suppression within patients. Survival data were only available on 53 patients, but importantly, overall survival was reduced by nearly 4 years in the CMV-seropositive group. This observation was not statistically significant with this sample size but it demonstrates an urgent need to study larger cohorts to determine the importance of CMV serostatus on the clinical course of patients with CLL. There is increasing interest in the potential contribution of CMV infection to immune senescence, and the potential mechanisms by which CMV carriage could impair immune function include reduction in the naive T-cell pool or secretion of soluble immunomodulatory mediators from the expanded memory population.
Chronic herpes virus infections are ubiquitous in all populations and relatively little attention has been given to their potential to modulate the natural history of human disease. Our studies suggest that CMV infection has a profound influence on the immune system in patients with B-CLL and that this effect increases with disease progression. Further studies are required to understand the clinical importance of this association and to investigate the potential therapeutic opportunities that may be revealed.
An Inside Blood analysis of this article appears at the front of this issue.
The publication costs of this article were defrayed in part by page charge payment. Therefore, and solely to indicate this fact, this article is hereby marked “advertisement” in accordance with 18 USC section 1734.
Acknowledgments
This work was supported by financial support from the Medical Research Council UK and a Personal Scholarship from the Government of Iran.
Authorship
Contribution: B.P. performed the experimental work and helped in experimental design; R.B. assisted in developing the experimental assays; H.P. and J.M. assisted with data collection and study analysis; L.B. performed the statistical analysis for the paper; C.F. helped with the design of the study; and P.M. led the design and writing of the project.
Conflict-of-interest disclosure: The authors declare no competing financial interests.
Correspondence: Paul Moss, School for Cancer Sciences, University of Birmingham, Edgbaston, United Kingdom, B15 2TT; e-mail: p.moss@bham.ac.uk.

This feature is available to Subscribers Only
Sign In or Create an Account Close Modal