

Abstract
Limiting dilution transplantation assay (LDTA) is considered as the gold standard method to assess hematopoietic stem cell (HSC) content. Traditionally, HSC frequency estimates are based on the single-hit Poisson model (SHPM), which posits that one donor HSC is sufficient to generate a progeny of detectable differentiated cells above a threshold value in hosts. However, there is no clear support for this statement, and it is receivable that more than one donor HSC may be necessary to provide detectable reconstitution in hosts above the threshold level for detection, usually 0.5% to 1% of donor-derived cells. To address this hypothesis, we evaluated the ability of a class of multiCell Poisson models (C≥1PMs) to fit to LDTAs. In 7 of the 8 reanalyzed LDTAs, C≥1PMs plausibly compete with the traditional SHPM. Model averaging across the set of plausible models gives 1.32- to 5.88-fold increases in HSC frequencies compared with the SHPM.
Introduction
Although limiting dilution transplantation assay (LDTA) in recipient animals coupled to the single-hit Poisson model (SHPM) is considered as one of the best methods for quantitating hematopoietic stem cells (HSCs),1 investigators should be aware of the potential problems associated with this assay.2 In particular, HSC frequency estimates traditionally rely on the SHPM,1,3 which posits that one donor HSC is sufficient to generate a progeny of detectable differentiated cells above a threshold value in hosts, usually considered approximately 1% of donor-derived cells as estimated by flow cytometry.2 It turns out that the reliability of HSC frequency estimates is critically dependent on this hypothesis. Indeed, it is perfectly acceptable that the progeny of one HSC may be unable to reach this limit of detection imposed by standard flow cytometric analysis. In this context, several recipients having received one, or even more than one, HSC(s) may be falsely classified as negative for reconstitution. This potential situation disqualifies the use of the SHPM. To address this problem, we demonstrate that it is possible to accurately quantitate HSCs, providing that the traditional SHPM is mathematically remodeled to turn to a new class of Poisson models termed multicell Poisson models (C≥1PMs), which take into account the possibility of recipients misclassified as negative. The validity of this new modeling approach is demonstrated by reassessing 8 previously published LDTAs4,5 aimed at comparing HSC frequencies in Hoxa-9−/− versus wild-type mice (2 LDTAs)4 and in Notch ligand–stimulated versus –unstimulated CD34+ cord blood cells (6 LDTAs).5 In 7 of the 8 reanalyzed LDTAs, C≥1PMs plausibly compete with the traditional SHPM, leading to significant changes in HSC frequency estimates compared with the SHPM.
Methods
Source of the 8 reanalyzed LDTAs
Model assumptions
The equation of the SHPM model is as follows:
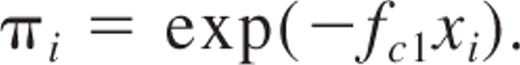
This is the first term in the Poisson series, describing the equation of the SHPM.3,6 In this equation, πi is considered as the proportion of the recipient population with no detectable donor-derived blood cells (negative outcome), fc1 is the HSC frequency estimate, and xi is the number of cells at each cell dose group i with i = 1, 2, …, k, where k is the total number of cell doses. The major assumption of the SHPM is that only animals that receive zero HSCs do not produce positive outcome, whereas animals transplanted with 1, 2, …, C HSC(s) will result in positive outcome.
The general equation of the models of the class of C≥1PMs is as follows:

This equation describes a series of more sophisticated Poisson models that extend the basic SHPM by including the second term, third term, …, nth term of the Poisson series in addition to the first term of the Poisson series, where fc>1 is the HSC frequency estimate. This equation can be written as follows:
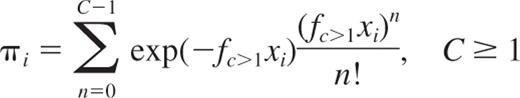
It describes the general form of the multicell PMs (C≥1PMs). C appears for each model as the minimum number of HSCs necessary to promote a detectable positive outcome. A set of 20 models is tested, C taking the value 1, 2, …, 20. The C≥1PMs include the SHPM (C = 1) but leave open the possibility that more than one HSC (C > 1) is necessary to give rise to a progeny of detectable differentiated cells in transplanted animals (positive outcome). In the case where C > 1, our hypothesis is that C≥1PMs mathematically capture the situation in which a proportion of recipients having received HSC(s), but not in sufficient number (ie, 1 to C − 1), have been falsely scored as negative outcome.
Fitting a generalized linear model for assessing the fit of the SHPM to LDTAs
In a previously published paper,7 we advised a statistical test aimed at estimating the fit of the SHPM to the data and based on a generalized linear modeling approach. Briefly, testing the null hypothesis that the slope β is equal to 1 (β = 1) explores the SHPM hypothesis, and this can be performed by a standard likelihood ratio test.8 Standardized deviance residuals9 were also used as SHPM checking diagnostics after fitting the SHPM3 to the LDTAs.
Fitting the C≥1PMs to LDTAs and computation of HSC frequency estimates
Calculations of C≥1PM-based HSC frequencies were obtained by a standard maximum likelihood procedure applied to binomial data.9 Comparison of the C≥1PMs models was performed with Akaike information criterion (AIC) and the related Akaike weights, called w, grounded on an extension of the AIC known as information-theoretic approach, applied to model uncertainty and multimodel inference.10-15 Finally, C≥1PM-based HSC frequency estimates were averaged across the set of all plausible C≥1PMs, along to a statistical procedure that takes into account the HSC frequency estimates and the relative Akaike weights of all plausible C>1PMs10,11 (supplemental Methods).
Results and discussion
The SHPM is rejected for the LDTA nos. 1a, 2a, and 2e (P < .05) and is barely acceptable for the LDTA nos. 1b and 2d (P < .1; supplemental Table 3), casting doubt on the accuracy of the previously reported HSC frequency estimates4,5 for these 5 of the 8 LDTAs. The standardized deviance residuals under the SHPM are presented in supplemental Figure 1A-B. Overall, it can be observed that the residuals are usually positive at low cell doses and negative at high cell doses. Given the structure of the deviance residuals,9 this means that the fraction of negative mice under the SHPM tends to be underestimated at low cell doses and overestimated at high cell doses. The occurrence of such a systematic pattern favors the hypothesis that the SHPM is not correct and motivates the development of alternative Poisson models. Next, C≥1PMs are fitted to the LDTA data with C taking the values 1 to 20. Based on the log-likelihood values, it can be computed AIC, ΔAICm (the AIC difference between the best model and a given model in the set), and weights w that represent the probability of each model to be the expected best model (Supplemental data); a representative example of calculation is given in supplemental Table 4. Based on each Akaike weight w, it can be observed that the best model probability w obtained for a given C≥1PM is not large relative to the weights for the other competing C≥1PMs (supplemental Figure 2 left panels). The conclusion is that there is no model from the C≥1PMs, including the traditional SHPM, that can be considered as the best-approximating model to the data, except in LDTA no. 2f exhibiting w close to 1 for the model with C = 1, strong evidence that the SHPM is the expected best model. Considering this model uncertainty for 7 of the 8 LDTAs, HSC frequency estimates f̃ were computed by a model averaging procedure across the plausible C≥1PMs, defined as the set of models with ΔAICm ≤ 10 (supplemental Figure 2 right panels). C≥1PM-averaged HSC frequency estimates f̃ are higher than HSC frequency estimates fc1 based on the SHPM, with 1.32- to 5.88-fold increases (Table 1). Fitted SHPM and C≥1PMs regression lines for the 8 LDTAs are presented in Figure 1A-H, with χ2/df ratios (χ2-dispersion statistics; supplemental data) favoring the conclusion that C>1PMs fit better to the data than the SHPM. This study strongly suggests that C≥1PMs should be routinely used to more accurately estimate HSC frequencies in LDTAs. In line with our main finding that a single HSC may not be sufficient to generate detectable hematopoietic reconstitution in recipients, single-cell transplantations performed with various HSC-enriched populations may have chronically underestimated the total HSC frequencies.16
Results of the modeling study fitting Poisson models (SHPM and C≥1PMs) to the 8 LDTAs with HSC frequency estimates, their SEs, and 95% confidence intervals
| LDTA no. | Cell subset | SHPM (C = 1) | C≥1PMs | f̃ | |||||
|---|---|---|---|---|---|---|---|---|---|
| fc1* | SE (fc1)† | 95% CI (fc1) | C‡ | f̃§ | SE (f̃)‖ | 95% CI (f̃) | fc1 | ||
| 1a | Hoxa-9−/− 12 weeks | 6.11 × 10⁻⁶ (1/163 934) | 1.65 × 10⁻⁶ | 2.88 × 10⁻⁶ - 9.34 × 10⁻⁶ (1/347 222 - 1/107 066) | 1, 2, 3, 4, 5, 6, 7, 8, 9, 10, 11 | 3.59 × 10⁻⁵ (1/27 816) | 1.53 × 10⁻⁵ | 5.98 × 10⁻⁶ - 6.59 × 10⁻⁵ (1/167 179 - 1/15170) | 5.88 |
| 1b | Wild-type 12 weeks | 4.37 × 10⁻⁵ (1/22 883) | 1.11 × 10⁻⁵ | 2.2 × 10⁻⁵ - 6.55 × 10⁻⁵ (1/45 454 - 1/15 167) | 1, 2, 3, 4, 5, 6, 7, 8, 9 | 1.85 × 10⁻⁴ (1/5416) | 7.62 × 10⁻⁵ | 3.51 × 10⁻⁵ - 3.34 × 10⁻⁴ (1/28 449 - 1/2993) | 4.23 |
| 2a | Delta1-IgG 3 weeks | 1.25 × 10⁻⁴ (1/8000) | 1.94 × 10⁻⁵ | 8.73 × 10⁻⁵ - 1.63 × 10⁻⁴ (1/11 454 - 1/6135) | 1, 2, 3, 4 | 3.32 × 10⁻⁴ (1/3014) | 9.05 × 10⁻⁵ | 1.54 × 10⁻⁴ - 5.09 × 10⁻⁴ (1/6 477 - 1/1964) | 2.66 |
| 2b | Control-IgG 3 weeks | 3.79 × 10⁻⁵ (1/26 385) | 7.22 × 10⁻⁶ | 2.38 × 10⁻⁵ - 5.21 × 10⁻⁵ (1/42 016 - 1/19 193) | 1, 2, 3 | 7.25 × 10⁻⁵ (1/13 791) | 3.2 × 10⁻⁵ | 1.175 × 10⁻⁵ - 1.33 × 10⁻⁴ (1/85 106 - 1/7503) | 1.91 |
| 2c | Noncultured 3 weeks | 8.18 × 10⁻⁶ (1/122 249) | 1.36 × 10⁻⁶ | 5.52 × 10⁻⁶ - 1.08 × 10⁻⁵ (1/181 159 - 1/92 592) | 1, 2 | 1.08 × 10⁻⁵ (1/92 592) | 4.4 × 10⁻⁶ | 2.17 × 10⁻⁶ - 1.94 × 10⁻⁵ (1/459 559 - 1/51482) | 1.32 |
| 2d | Delta1-IgG 9 weeks | 9.91 × 10⁻⁵ (1/10 090) | 1.54 × 10⁻⁵ | 6.88 × 10⁻⁵ - 1.29 × 10⁻⁴ (1/14 534 - 1/7751) | 1, 2, 3 | 1.69 × 10⁻⁴ (1/5904) | 7.62 × 10⁻⁵ | 1.99 × 10⁻⁵ - 3.18 × 10⁻⁴ (1/50 176 - 1/3136) | 1.7 |
| 2e | Control-IgG 9 weeks | 5.62 × 10⁻⁵ (1/17 793) | 1.04 × 10⁻⁵ | 3.59 × 10⁻⁵ - 7.65 × 10⁻⁵ (1/27 855 - 1/13 071) | 1, 2, 3 | 1.29 × 10⁻⁴ (1/7692) | 3.075 × 10⁻⁵ | 6.97 × 10⁻⁵ - 1.9 × 10⁻⁴ (1/14 343 - 1/5255) | 2.29 |
| 2f | Noncultured 9 weeks | 1.58 × 10⁻⁵ (1/63 291) | 2.46 × 10⁻⁶ | 2.06 × 10⁻⁵ - 1.1 × 10⁻⁴ (1/48 543 - 1/9090) | 1 | NA | NA | NA | |
NA indicates not available (the SHPM is clearly the best expected model).
Maximum likelihood estimate of the HSC frequency obtained on fitting the SHPM to the data.
SE(fc1) indicates conditional standard error of fc1; based on standard normal distribution of fc1 95% CI (fc1) is given by the endpoints fc1 ± 1.96 × SE (fc1).
Value(s) of C corresponding to the set P of plausible C≥1PMs, C being the minimum number of HSCs necessary to promote detectable repopulation in recipients (positive outcome).
f̃ indicates the C≥1PM model–averaged HSC frequency estimate in the set P of plausible C≥1PMs.
SE (f̃) indicates the unconditional standard error of f̃; 95% CI (f̃) is given by the endpoints f̃ ±1.96× SE (f̃); see supplemental data.

Fitted SHPM and C≥1PM-averaged regression lines for the 8 LDTAs. Vertical axis represents expected fraction, termed yi, of negative mice predicted by the SHPM, or expected fraction, termed yi, of negative mice predicted by model averaging across the set P of plausible C≥1PMs; and horizontal axis, number of injected cells xi at each cell dose group i. (A) LDTA no. 1a: Hoxa-9−/− bone marrow cells. (B) LDTA no. 1b: wild-type bone marrow cells. (C) LDTA no. 2a: Notch ligand (delta1-IgG) stimulated CD34+ cells, 3 weeks after transplantation. (D) LDTA no. 2b: CD34+ cultured with control IgG, 3 weeks after transplantation. (E) LDTA no. 2c: noncultured CD34+, 3 weeks after transplantation. (F) LDTA no. 2d: Notch ligand (delta1-IgG) stimulated CD34+ cells, 9 weeks after transplantation. (G) LDTA no. 2e: CD34+ cultured with control IgG, 9 weeks after transplantation. (H) LDTA no. 2f: noncultured CD34+, 9 weeks after transplantation. Blue line indicates fitted SHPM regression line; red line, fitted C≥1PM-averaged regression line; and black symbols, experimental data (yi/Ni, xi), where yi is the number of mice with negative outcome, Ni is the total number of mice, and xi is the number of injected cells, at each cell dose i. (A-H) The values of χ2/df ratios (Pearson χ2-dispersion statistics) highlight that the C≥1PM class better fit to the data than the SHPM in 7 of the 8 LDTAs: the lower value of this ratio, the better fit of the model to the data (supplemental data).
Fitted SHPM and C≥1PM-averaged regression lines for the 8 LDTAs. Vertical axis represents expected fraction, termed yi, of negative mice predicted by the SHPM, or expected fraction, termed yi, of negative mice predicted by model averaging across the set P of plausible C≥1PMs; and horizontal axis, number of injected cells xi at each cell dose group i. (A) LDTA no. 1a: Hoxa-9−/− bone marrow cells. (B) LDTA no. 1b: wild-type bone marrow cells. (C) LDTA no. 2a: Notch ligand (delta1-IgG) stimulated CD34+ cells, 3 weeks after transplantation. (D) LDTA no. 2b: CD34+ cultured with control IgG, 3 weeks after transplantation. (E) LDTA no. 2c: noncultured CD34+, 3 weeks after transplantation. (F) LDTA no. 2d: Notch ligand (delta1-IgG) stimulated CD34+ cells, 9 weeks after transplantation. (G) LDTA no. 2e: CD34+ cultured with control IgG, 9 weeks after transplantation. (H) LDTA no. 2f: noncultured CD34+, 9 weeks after transplantation. Blue line indicates fitted SHPM regression line; red line, fitted C≥1PM-averaged regression line; and black symbols, experimental data (yi/Ni, xi), where yi is the number of mice with negative outcome, Ni is the total number of mice, and xi is the number of injected cells, at each cell dose i. (A-H) The values of χ2/df ratios (Pearson χ2-dispersion statistics) highlight that the C≥1PM class better fit to the data than the SHPM in 7 of the 8 LDTAs: the lower value of this ratio, the better fit of the model to the data (supplemental data).
The online version of this article contains a data supplement.
The publication costs of this article were defrayed in part by page charge payment. Therefore, and solely to indicate this fact, this article is hereby marked “advertisement” in accordance with 18 USC section 1734.
Acknowledgment
This work was supported by Association pour la Recherche sur le Cancer (grant 3218).
Authorship
Contribution: T.B. performed mathematical and statistical data modeling; and M.C. and T.B. cowrote the paper.
Conflict-of-interest disclosure: The authors declare no competing financial interests.
Correspondence: Thierry Bonnefoix, Inserm, U823, Oncogenic Pathways in the Haematological Malignancies, Institut Albert Bonniot, Grenoble Cedex 9, France; e-mail: thierry.bonnefoix@ujf-grenoble.fr.

This feature is available to Subscribers Only
Sign In or Create an Account Close Modal