

Abstract
In a genome-wide association study of 848 blacks with sickle cell anemia, we identified single nucleotide polymorphisms (SNPs) associated with fetal hemoglobin concentration. The most significant SNPs in a discovery sample were tested in a replication set of 305 blacks with sickle cell anemia and in subjects with hemoglobin E or β thalassemia trait from Thailand and Hong Kong. A novel region on chromosome 11 containing olfactory receptor genes OR51B5 and OR51B6 was identified by 6 SNPs (lowest P = 4.7E−08) and validated in the replication set. An additional olfactory receptor gene, OR51B2, was identified by a novel SNP set enrichment analysis. Genome-wide association studies also validated a previously identified SNP (rs766432) in BCL11A, a gene known to affect fetal hemoglobin levels (P = 2.6E−21) and in Thailand and Hong Kong subjects. Elements within the olfactory receptor gene cluster might play a regulatory role in γ-globin gene expression.
Introduction
Fetal hemoglobin (HbF), a tetramer of 2 α- and 2 γ-globin chains, is the major modifier of the clinical course of patients with sickle cell anemia (homozygosity for HBB glu6val) and the β thalassemias. HbF does not incorporate into the sickle hemoglobin (HbS) polymer, thereby inhibiting the HbS polymerization that leads to erythrocyte damage and dysfunction; in the β thalassemias, HbF compensates for the reduction or absence of normal HbA production. Adult levels of HbF are highly heritable, and the production of HbF is genetically regulated by several quantitative trait loci and by genetic elements linked to the HBB gene–like cluster.1-3 The best characterized regions that modulate the expression of HbF are on chromosomes 2p and 6q, and upstream from HBG2. Other putative regulatory regions reside on chromosomes 8q and Xp.1 To further understand the genetic modulation of HbF in sickle cell anemia, we have completed genome-wide association studies (GWAS) in a discovery set of 848 and a replication set of 305 black patients. For further replication, we also compared the results in sickle cell anemia with subjects with heterozygous β thalassemia or hemoglobin E (HbE) from Hong Kong and Thailand. An association between HbF levels in sickle cell anemia and polymorphisms in the olfactory receptor gene cluster upstream of the β-globin gene cluster locus control region (LCR) was found, suggesting the presence of a novel regulatory region
Methods
Participants
We measured HbF levels in 848 black subjects from the Cooperative Study of Sickle Cell Disease (CSSCD), a multi-institutional prospective longitudinal study of sickle cell disease.4 The primary replication study included 305 black subjects from several studies: the Multicenter Study of Hydroxyurea5 (MSH; N = 212), the Duke University pulmonary hypertension study6 (N = 78), and the Boston Medical Center (BMC) pulmonary hypertension study6,7 (N = 15). Some characteristics of the sickle cell anemia patients are described in Table 1. An attempt was made to validate the results in 113 subjects from Thailand with heterozygous β thalassemia or heterozygous HbE, and in 406 subjects from Hong Kong8 with heterozygous β thalassemia. None of the patients included in the CSSCD discovery set was treated with hydroxyurea; pretreatment levels of HbF were analyzed for patients in the sickle cell anemia replication set. All studies were approved by the institutional review board of each participating institution.
Patient characteristics
| Variable | CSSCD | Replication |
|---|---|---|
| Sex, n (%) | ||
| Males | 394 (46) | 140 (46) |
| Females | 454 (54) | 165 (54) |
| Mean HbF, percentage (SD) | ||
| Males | 5.8 (5.3) | 4.8 (3.6) |
| Females | 7.3 (5.6) | 6.4 (4.7) |
| Mean age, y (SD) | ||
| Males | 15.9 (10.2) | 30.1 (9.3) |
| Females | 18.4 (11.1) | 32.4 (10.8) |
| Mean hemoglobin, g/dL (SD) | ||
| Males | 8.5 (1.4) | 8.6 (1.4) |
| Females | 8.4 (1.2) | 8.1 (1.2) |
Summary statistics of the important patient characteristics in the CSSCD and replication sets. HbF, age, and hemoglobin concentration are stratified by sex.
Genotyping
The DNA samples of the CSSCD, BMC, Hong Kong, and Duke subjects were genotyped with the Illumina Human610-Quad SNP array with approximately 600 000 single nucleotide polymorphisms (SNPs) and covers approximately 60% of the genome of the HapMap Yoruban (r2 > 0.8) and 18 000 known genes. The MSH DNA samples were genotyped with the Illumina HumanCNV370-duo bead chip or the 317K array. Samples were processed according to the manufacturer's protocol, and BeadStudio Software was used to make genotype calls using the Illumina predefined clusters.
Quality control
We excluded SNPs with a call rate less than 95%, SNPs with a count less than 3 for the homozygous minor allele genotype, and subjects with a call rate less than 93%. Identity by descent measurements were computed in the software PLINK9 to identify related persons, defined as an identity by descent estimate greater than 0.20. Related persons within a study were removed, as were subjects enrolled in or related to persons across the different sickle cell anemia studies. Sex was inferred using heterozygosity estimates from SNPs on chromosome X to identify and remove subjects whose genetic sex did not match their sex assignment in the database. To assess whether admixture or population substructure could bias our results, we conducted a genome-wide principal components analysis (PCA) for CSSCD subjects using the software EIGENSOFT.10 As reference populations, we used data for SNPs common to the 610K array from the international HapMap project11 and included 58 unrelated subjects (Yoruba) from Ibadan, Nigeria (YRI), and 60 unrelated Utah residents with ancestry from Northern and Western Europe (CEU) in the PCA.
Phenotype
HbF was measured by alkali denaturation in the CSSCD and MSH samples.12 In Thailand, Hong Kong, Duke, and BMC subjects, HbF was measured by high-pressure liquid chromatography. Within the range of HbF observed, both alkali denaturation and high-pressure liquid chromatography gave similar results; nevertheless, the use of different methods of measuring HbF among subjects in the replication set might be a confounder.13 The cubic root transformation was used in analysis of HbF. For the CSSCD subjects, longitudinal HbF values were gathered from phases 1 through 3 of this study, and only steady-state values were used (ie, measurements not taken during an acute event). Because HbF is known to decrease with increasing age, we examined the relationship between HbF and age in CSSCD and found that HbF stabilized at 5 years of age (supplemental Figure 1, available on the Blood website; see the Supplemental Materials link at the top of the online article). Therefore, we only used measurements at which the person's age was 5 years or older, and the median statistic was used to summarize the longitudinal values for each person.
Single SNP statistical analysis
The association between HbF and the genotype for each SNP was tested with a multiple linear regression analysis, adjusting for sex and assuming an additive model using the software PLINK.9 The additive model codes the SNP genotype as the number of minor alleles (0, 1, 2). The cubic root of HbF was used in the analysis to obtain a normal distribution of the phenotype, and sex was included as a covariate because HbF measurements differed significantly between males and females (P = 1.9E−06). For the X chromosome, the SNP genotype was coded (0, 1, 2) for females and (0, 1) for males corresponding to the number of minor alleles. Twenty-one SNPs in the discovery set that reached a significance level of 10−06 were tested in the replication set. Only 11 SNPs were available for replication on the 370K Illumina array. Ten of the 11 SNPs had similar regression coefficients in the discovery and replication sets and are presented in Table 2. For SNPs examined in both the discovery and replication sets, the data were combined and analyzed jointly. If the association is consistent in both datasets, then the joint analysis should have a similar regression coefficient and a more significant P value than that obtained when only analyzing subjects from the CSSCD. Excess association resulting from population stratification was assessed using genomic control, and the genomic inflation factor lambda was estimated in PLINK.
Significant SNPs in CSSCD and consistent associations in the replication set
| Chromosome | SNP | Base pair units | Minor allele | YRI | CEU | Gene name | CSSCD | Replication | Combined | CSSCD mean HbF | Replication mean HbF | |||||||||
|---|---|---|---|---|---|---|---|---|---|---|---|---|---|---|---|---|---|---|---|---|
| Frequency of minor allele | β | P | Frequency of minor allele | β | P | β | P | G11 | G12 | G22 | G11 | G12 | G22 | |||||||
| 2 | rs6732518 | 60562101 | G | 0.29 | 0.24 | BCL11A | 0.33 | 0.13 | 1.59E−07 | 0.32 | 0.08 | .036 | 0.12 | 2.87E−09 | 8.26 | 7.32 | 5.56 | 6.87 | 5.75 | 5.25 |
| 2 | rs766432 | 60573474 | C | 0.25 | 0.12 | BCL11A | 0.28 | 0.24 | 2.61E−21 | 0.27 | 0.20 | 9.99E−08 | 0.23 | 1.33E−29 | 10.07 | 7.77 | 5.19 | 8.43 | 6.36 | 4.59 |
| 11 | rs4910755 | 5329327 | C | 0.27 | 0.22 | OR51B5; OR51B6 | 0.15 | 0.16 | 4.51E−07 | 0.14 | 0.10 | .040 | 0.14 | 9.17E−08 | 8.07 | 8.14 | 6.09 | 6.49 | 6.47 | 5.42 |
| 11 | rs4910756 | 5329432 | G | 0.01 | 0.17 | OR51B5; OR51B6 | 0.12 | 0.16 | 4.95E−06 | 0.12 | 0.11 | .031 | 0.14 | 5.94E−07 | 9.19 | 8.00 | 6.23 | 5.90 | 6.66 | 5.32 |
| 11 | rs7483122 | 5329582 | G | 0.01 | 0.21 | OR51B5; OR51B6 | 0.14 | 0.17 | 6.86E−07 | 0.15 | 0.07 | .115 | 0.13 | 6.76E−07 | 8.05 | 8.14 | 6.09 | 6.49 | 6.15 | 5.44 |
| 11 | rs5006884 | 5329827 | A | 0.25 | 0.22 | OR51B5; OR51B6 | 0.13 | 0.20 | 4.73E−08 | 0.13 | 0.09 | .066 | 0.16 | 2.72E−08 | 10.58 | 8.17 | 6.09 | 6.23 | 6.32 | 5.38 |
| 11 | rs5006883 | 5329887 | G | — | 0.20 | OR51B5; OR51B6 | 0.11 | 0.16 | 7.81E−06 | 0.13 | 0.10 | .032 | 0.14 | 1.54E−06 | 8.52 | 8.14 | 6.22 | 6.49 | 6.62 | 5.35 |
| 11 | rs5024042 | 5330138 | A | 0.26 | 0.22 | OR51B5; OR51B6 | 0.14 | 0.16 | 6.03E−07 | 0.15 | 0.10 | .031 | 0.14 | 1.03E−07 | 8.07 | 8.11 | 6.09 | 6.80 | 6.36 | 5.37 |
| 11 | rs10500635 | 5343244 | A | 0.27 | 0.22 | 0.15 | 0.16 | 4.90E−07 | 0.15 | 0.09 | .045 | 0.14 | 1.26E−07 | 8.07 | 8.14 | 6.09 | 6.80 | 6.25 | 5.39 | |
| 11 | rs416586 | 5450133 | G | 0.40 | 0.24 | 0.18 | 0.13 | 8.65E−06 | 0.17 | 0.11 | .020 | 0.12 | 5.71E−07 | 11.01 | 7.06 | 6.21 | 5.14 | 6.92 | 5.11 | |
Significant SNPs (P < 10E−06) in CSSCD for the additive model with consistent associations in the replication set. For SNPs common to the CSSCD and the replication set arrays, the data were combined and analyzed jointly. The combined analysis has similar β estimates and smaller P values than the individual analyses, showing that the associations are consistent in both studies. G11, G12, and G22 refer to the homozygous genotype for the minor allele, the heterozygous genotype, and the homozygous genotype for the major allele.
— indicates not applicable.
To test the association between HbF and rs5006884 adjusting for the haplotype of the HbS β-globin gene-like cluster and sex, we dichotomized the haplotype into 2 groups: one containing subjects with 1 or 2 Senegal haplotype chromosomes and the other with no Senegal haplotype chromosomes. To compute the proportion of variability of HbF explained by BCL11A and the olfactory receptor region SNPs, we computed the residual deviance for 4 regression models of HbF with the following covariates: sex; sex and the most significant SNP in BCL11A (rs766432); sex and the most significant SNP in the olfactory receptor region (rs5006884); and sex, rs766432, and rs5006884. We then calculated the percentage change in the residual deviance between each model and the model including only sex as a covariate. Linkage disequilibrium (LD) plots were generated with the program Haploview 4.114 using data from CSSCD subjects.
SSEA
To identify genes enriched with moderately strong associations, we developed an SNP set enrichment analysis (SSEA).15 This method computes the probability that a set of SNPs is selected as significant by chance, and scores each gene by this probability. The lower this probability, the more likely the set of significant SNPs contained in the gene represents a true association, regardless of their individual strength. The probability is computed using the hypergeometric distribution:
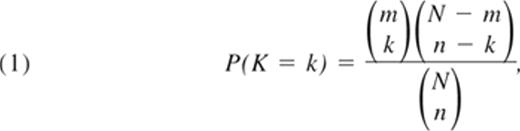
where N is the total number of analyzed SNPs, n is the total number of SNPs with a P value less than p0, m is the number of SNPs in the gene, and k is the number of SNPs with a P value less than p0 in the gene. To implement this method, first SNPs in very strong LD (r2 > 0.9) were removed, and then a single SNP analysis was used to test the association of each one of the N SNPs with HbF, and compute the number n of significant SNPs with P values less than p0. A genotypic association model was used for this analysis because the genotypic model does not impose any restriction on the relationship between a phenotype and genotype and thus can capture dominant, recessive, and codominant relationships in addition to the additive model. Then for each gene, the number of SNPs with P value less than p0, k, was calculated and used in the formula to compute the gene-specific score. We set the SNP P value, p0, to .01 for the gene-based test in the CSSCD dataset based on the following consideration: the average number of SNPs per gene in the Illumina 610 array is 25, so that a P value less than .01 would lead to an average number of 0.25 false-positive SNPs per gene. In the sickle cell anemia replication set, Thailand, and Hong Kong subjects, we analyzed only those genes that had a significant gene-based test in the CSSCD dataset and relaxed the SNP P value, p0, to .05 because of the smaller average number of SNPs per gene in the 370 array.
Results
Patient characteristics
Females have on average higher HbF levels than males in the discovery and replication sickle cell anemia cases. We adjusted for sex in all analyses to account for the difference in HbF between males and females. HbF levels are significantly different between the CSSCD cohort and the replication set after adjusting for sex (P = .01). However, this difference occurs because the CSSCD subjects are, on average, younger than the subjects in the replication set. After adjusting for both sex and age in a regression model, HbF levels do not significantly differ between CSSCD and the replication set (P = .99); thus, the 2 cohorts are comparable with respect to HbF.
Population structure
We found that the first principal component, which by definition captures the largest amount of variability in the data, clearly separated the Africans (YRI) from the whites (CEU). The first principal component for the CSSCD subjects ranged between those of the YRI and CEU populations and captures the amount of white admixture of the CSSCD subjects (supplemental Figure 2). Although this finding shows that admixture is indeed present in this cohort, the level of admixture, as captured by principal component 1, is not associated with HbF measures when tested with a regression model (P = .74). Principal components 2 to 10, which capture decreasingly smaller amounts of variability and detect more subtle substructure in the data, are also not significantly associated with HbF levels. Because GWAS results are prone to inflated test statistics resulting from admixture only when the level admixture varies with respect to the phenotype, our test statistics are distributed appropriately. Likewise, the population structure of the sickle cell anemia discovery and replication subjects was similar when a combined PCA was conducted.
Association analysis
The Manhattan plot summarizing the GWAS results for the additive model in CSSCD is shown in Figure 1, with the most significantly associated SNPs reported in Table 2. Six SNPs exceeded the strict genome-wide significance threshold of 10−08 for the additive model and included the SNP rs766432 in BCL11A, previously found to be associated with HbF in several different populations,16-18 and the SNP rs5006884 in a novel region on chromosome 11 containing the olfactory genes OR51B5 and OR51B6. The 4 additional SNPs that met genome-wide significance are in BCL11A (supplemental Table 1), but these SNPs are not present in the 370 Illumina array and thus could not be replicated. Eight additional SNPs have a P value less than 10−06 in the CSSCD set and have consistent effects in the replication set and various levels of significance (Table 2).

Manhattan plot summarizing the GWAS results for CSSCD using the additive model. The large spike on chromosome 2 corresponds to a region containing BCL11A, and the moderate spike on chromosome 11 corresponds to a region containing olfactory genes OR51B5 and OR51B6.
Manhattan plot summarizing the GWAS results for CSSCD using the additive model. The large spike on chromosome 2 corresponds to a region containing BCL11A, and the moderate spike on chromosome 11 corresponds to a region containing olfactory genes OR51B5 and OR51B6.
To provide further evidence that the associations found in the olfactory receptor region are probably not an artifact of LD, we ran a series of regression models testing the association between HbF and the top SNP in the OR51B5/OR51B6 locus, rs5006884, adjusting for Xmn1-HBG2 site, the sickle cell haplotype, and other SNPs in the β-globin locus and LCR region. The significance of rs5006884 decreased slightly from 1.6E−04 to 9.1E−03, after adjusting for the sickle cell haplotype, showing that the effect of rs5006884 on HbF is independent of the sickle cell haplotype. Note that the reference significance of rs5006884 is 1.6E−04, resulting from a lower sample size because only 64% of the CSSCD subjects had information about the HbS β-globin–like gene cluster haplotype. When adjusting for the Xmn1-HBG2 site, the significance of rs5006884 decreased from 3.98E−06 to 1.34E−03, showing that this SNP is still associated with HbF after adjusting for the Xmn1 site. Only 82% of the subjects had information about the Xmn1 genotype in the CSSCD database, and the reference significance for the same sample size for rs5006884 is 3.98E−06. rs5006884 was still associated with HbF (P = 1.5E−05) in a model adjusting for rs2071348, a SNP in the β-globin locus associated with HbF, giving further evidence that the olfactory receptor region provides important additional information independent of the β-globin gene–like complex. Likewise, rs5006884 was still associated with HbF after adjusting for SNPs in the LCR region, defined as chromosome 11: 5235931-5284996, suggesting that the association is independent of this region. All analyses were adjusted for HbF differences resulting from sex.
Data for SNPs common to the discovery and replication sets were combined and analyzed jointly (Table 2). Similarity of the regression β coefficients across datasets and increased significance of the P values compared with those observed in the analyses of individual datasets provide additional evidence that the associations are consistent in both datasets. Both the Q-Q plot in Figure 2 and the genomic inflation factor of 1.003 suggest that the test statistics are not inflated and are distributed appropriately.

QQ plot of CSSCD GWAS for the additive model. The QQ plot shows minimal to no inflation in the test statistics with a genomic control value of 1.003.
QQ plot of CSSCD GWAS for the additive model. The QQ plot shows minimal to no inflation in the test statistics with a genomic control value of 1.003.
On chromosome 6 in the HBS1L-MYB region, we found rs9494145 strongly associated with HbF in CSSCD (β = 0.24, P = 2.78E−07) and a consistent association in the replication set (β = 0.19, P = 2.04E−03). Two additional SNPs found in this region with moderate associations in CSSCD are rs9399137 (β = 0.22, P = 2.67E−05) and rs4895441 (β = 0.16, P = 1.33E−04, supplemental Table 1). rs9399137 had a consistent association in the replication set (β = 0.27, P = 1.10E−03), and rs4895441 was not present on the chips used for replication. The minor allele frequencies for rs9494145 and rs9399137 are low (0.07, 0.05), and there is only one observation for the homozygous minor allele genotype in CSSCD; thus, these results should be interpreted with caution.
SSEA
Sickle cell anemia is a rare disease in developed countries where phenotype and laboratory data are most available; thus, assembling large datasets is not as feasible as it is for common diseases. Because of this limitation, some real associations with limited effect sizes will not reach genome-wide significance. We reasoned that a gene containing several SNPs with moderately strong associations probably provides evidence of a true association, even if none of its SNPs reaches the traditional genome-wide significance level of 10−08. SSEA identified BCL11A and 2 olfactory receptor genes on chromosome 11 (OR51B5 and OR51B6) as enriched in both the discovery and replication sickle cell anemia sets (Table 3). Although the individual P values for some of the SNPs in the replication set are only moderately significant (Table 2), the probability that multiple SNPs in the same gene would have moderately significant P values under the null hypothesis of no association is low. For example, 8 of the 9 SNPs in OR51B6 had SNP P values less than .05 in the replication set, and the probability of observing this event by chance alone if the SNPs are not associated with HbF is 7.57E−09. The region on chromosome 11 containing OR51B5 and OR51B6 includes an enrichment of SNPs that are in high LD with each other (Figure 3B). The small cluster of significant SNPs in BCL11A is in high LD with the most significant SNP rs766432 (Figure 3A). The most significant SNPs in the olfactory receptor region (rs5006884) and BCL11A (rs766432) explain 5.6% and 10.3% of the variability in HbF and together explain 15.6% of the variability, using the regression models described in “Single SNP statistical analysis.”
Top genes in CSSCD identified by SSEA
| Official gene name | Location | CSSCD (n = 848) | Replication set (n = 305) | Thai (n = 152) | Hong Kong (n = 406) | ||||||||
|---|---|---|---|---|---|---|---|---|---|---|---|---|---|
| No. of SNPs in gene | Significant SNPs | SSEA P | No. of SNPs in gene | Significant SNPs | SSEA P | No. of SNPs in gene | Significant SNPs | SSEA P | No. of SNPs in gene | Significant SNPs | SSEA P | ||
| OR51B6 | 11p15.4 | 14 | 10 | 1.86E−15 | 9 | 8 | 7.57E−09 | 10 | 0 | .44 | 11 | 0 | .42 |
| OR51B5 | 11p15.4 | 16 | 9 | 1.19E−12 | 9 | 7 | 3.79E−07 | 9 | 0 | .47 | 12 | 1 | .38 |
| BCL11A | 2p16.1 | 31 | 8 | 3.68E−08 | 13 | 6 | 1.66E−04 | 9 | 6 | 1.67E−05 | 16 | 7 | 8.41E−05 |
| OR51B2 | 11p15 | 10 | 5 | 3.27E−07 | 3 | 1 | .19 | 5 | 3 | .004 | 13 | 0 | .36 |
Genes enriched with significant SNPs in CSSCD with SSEA (P < .001) and replicated in at least one of the replication sets. The number of significant SNPs is the number of SNPs with individual P value less than .01 in CSSCD and .05 in the replication (Thailand and Hong Kong sets).

LD plots for regions on chromosome 11 and 2 showing an enrichment of significant associations. LD plot was generated with the program Haploview 4.1 using the data for CSSCD subjects. Each diamond represents the value of D′, with the standard LD color scheme: white, D′ < 1 and LOD < 2; blue, D′ = 1 and LOD < 2; shades of pink/red, D′ < 1 and LOD ≥ 2; bright red, D′ = 1 and LOD ≥ 2. The top panel displays the −log10 P value for each SNP in the additive model for CSSCD. (A) BCL11A on chromosome 2. (B) Region on chromosome 11 containing OR51B5 and OR51B6.
LD plots for regions on chromosome 11 and 2 showing an enrichment of significant associations. LD plot was generated with the program Haploview 4.1 using the data for CSSCD subjects. Each diamond represents the value of D′, with the standard LD color scheme: white, D′ < 1 and LOD < 2; blue, D′ = 1 and LOD < 2; shades of pink/red, D′ < 1 and LOD ≥ 2; bright red, D′ = 1 and LOD ≥ 2. The top panel displays the −log10 P value for each SNP in the additive model for CSSCD. (A) BCL11A on chromosome 2. (B) Region on chromosome 11 containing OR51B5 and OR51B6.
Thailand and Hong Kong cases
In the Thailand and Hong Kong heterozygotes for HbE and β thalassemia samples, strong replication was seen for BCL11A (Table 4; rs766432) with a P value of 1.2E−07 for the Hong Kong subjects. For reference, we also report the P value 6.6E−05 for the Thailand subjects.16 OR51B2 was validated in the Thailand subjects with SSEA (Table 3).
Replication in Thailand and Hong Kong
| Chromosome | SNP | Base pair units | Minor allele | CSSCD | Thailand | Hong Kong | ||||||
|---|---|---|---|---|---|---|---|---|---|---|---|---|
| Frequency of minor allele | β | P | Frequency of allele | β | P | Frequency of allele | β | P | ||||
| 2 | rs6732518 | 60562101 | G | 0.33 | 0.13 | 1.59E−07 | 0.92 | 0.21 | .014 | 0.97 | 0.13 | .45 |
| 2 | rs766432 | 60573474 | C | 0.28 | 0.24 | 2.61E−21 | 0.22 | 0.22 | 6.59E−05 | 0.25 | 0.32 | 1.19E−07 |
Significant SNPs (P < 10E−06) in CSSCD for the additive model with consistent associations in the Thailand or Hong Kong subjects.
Chromosome X associations
Previous studies have suggested that an F-cell production locus exists in the interval Xp 22.2-22.3; and in candidate gene association studies, we found a modest association between HbF levels and SNPs targeting this region.19-21 In our GWAS, we found moderately strong associations for 1 SNP (rs6530488) in Xp22.2, a region previously identified in candidate gene studies,22,23 and 3 SNPs (rs16981804, rs4969555, rs4969549) in Xp22.11 (supplemental Table 1). These SNPs tag FRMPD4, PHEX, and EIF2S3; however, none surpassed a strict P value of 10−06. Although little is known about the function of any of these genes, none is an obvious candidate for modulating F-cell production.
Discussion
Genetic regulation of HbF concentration in sickle cell anemia was suggested by the observation that persons with the Senegal β-globin gene cluster haplotype had higher HbF levels than carriers of a Bantu haplotype.24 One SNP associated with HbF concentration (rs7482144) creates an Xmn1 restriction site 158 bp upstream of HBG2 and is present in the Senegal (and Arab-Indian) β-globin gene–like cluster haplotypes of sickle cell anemia. This SNP has consistently been associated with increased expression of the HBG2 gene, HbF levels, or F-cell numbers in normal persons and persons with the HbS gene or with β thalassemia.18,24-28 The mechanism of this effect remains enigmatic29-34 ; and although this SNP is not represented in the Illumina arrays, in approximately 60% of CSSCD cases rs7482144 was ascertained by restriction analysis.
GWAS and candidate gene studies showed that SNPs in the 6q22-23 HBS1L-MYB interval, in and around BCL11A, and in the HBB cluster were associated with HbF levels and F-cell numbers in normal persons and multiple patient groups with sickle cell disease, β thalassemia, β thalassemia trait, and HbE trait.3,16,17,35 BCL11A acts as a developmentally regulated silencer of HBG expression, whereas the HBS1L-MYB region might contain tissue-specific regulatory elements characterized by histone acetylation and GATA-1 binding that affect hematopoiesis and erythroid differentiation.36-40 Our studies, coupled with the aforementioned observations, suggest that these genomic regions modulate HbF levels in both normal persons and hemoglobinopathic patients and in very different racial and ethnic groups. However, the causative mutations in these regions, having not yet been discovered, might vary among populations.
Independent work has shown that, together, the associations of polymorphisms in the HBS1L-MYB interval, in the BCL11A locus, and near HBG2 explain only 20% to 50% of the variance in HbF in sickle cell anemia, β thalassemia, and in normal persons, suggesting that other genetic loci, most probably with small individual effects, also modulate HbF.3 Finding such loci can expand our understanding of the biology of HbF regulation, can increase our ability to predict HbF levels in patients, and might identify pathways that could be targeted to increase HbF expression. However, finding these loci become increasingly difficult as the effect size of each new modulatory region found is probably smaller than those previously discovered. Our analysis provides strong evidence that polymorphisms in the olfactory receptor gene region upstream of the β-globin gene cluster LCR are associated with HbF concentration in sickle cell anemia. We also confirm by GWAS the strong association of BCL11A with HbF concentration.
Phylogenetic conservation within the LCR and many molecular studies suggested an important regulatory function for this upstream region.3,41 Whereas LCR hypersensitive sites are conserved among mammalian genomes, sequences outside these sites are as conserved as some hypersensitive site cores and could contribute to the ability of transfected LCR fragments to establish and/or maintain an open chromatin domain after their stable integration into genomic DNA. Phylogenetic conservation of some olfactory receptor genes and their flanking sequences suggests that this region might also have a role in controlling expression within the β-globin gene–like complex.42,43 Chromatin in the β-globin gene cluster remains in an open conformation, even in the absence of the LCR, if the olfactory receptor gene cluster is intact.44 In Sardinians, using both linkage analysis and GWAS, 6 SNPs in the HBB locus were associated with HbF.17 Five of these SNPs lie between bp units 4910038 and 5263085, placing them within the olfactory receptor gene cluster. Although 3 of these SNPs (rs840716, rs968856, and rs1391619) are represented on the Illumina array, they were not significant in our studies using the same additive model. SNP rs2071348 at chromosome 11 (5220722) had a moderate level of significance in the discovery and replication sickle cell anemia samples (2.5E−05 and 2.2E−03, respectively) and fell within this region. The most significant SNPs in Sardinians span chromosome 11 (4568230-5263085) and chromosome 11 (5368648-5499595), whereas the majority of the SNPs in the olfactory receptor gene cluster we found associated with HbF fall between these 2 regions at chromosome 11 (5329327-5343648; Figure 4). The top SNP in the olfactory receptor gene cluster (rs5006884) remained significantly associated with HbF after adjusting for sex and for SNPs common to the Illumina platform found in the Sardinian population, indicating that this association is an independent finding. In a study of Thailand HbE-β0 thalassemia patients, 7 SNPs in 2 distinct LD blocks within the olfactory receptor gene cluster were associated with disease severity and SNP rs3886223 had the strongest association (odds ratio = 3.03, P = 3.7E−11).46

The human HBB locus and upstream olfactory receptor genes, chromosome 11 from 5 150 000 to 5 500 000 base pairs. Regions of interest (solid) were identified as associated with HbF levels in Sardinians, and regions of interest (striped) were identified in the current GWAS. rs500684 and rs2071348 were significantly associated with HbF in CSSCD (P = 4.7E−08, P = 2.5E−05). rs139161 and rs968856 (brackets) were reported among the top SNPs in Sardinians but were not significantly associated with HbF in the CSSCD or replication sets. Note that base pair locations are reported along the forward direction in kilobases, whereas the HBB locus is transcribed in the reverse direction. CTCF binding predictions were generated by screening for high-interest potential matches from a BLAST search (http://blast.ncbi.nlm.nih.gov) using one of 2 published CTCF consensus sequences: either 5′-GTGGCCACCAGGGGGCGCCG-3′ or 5′-CCGCTAGGGGGCAGCA-3′.45
The human HBB locus and upstream olfactory receptor genes, chromosome 11 from 5 150 000 to 5 500 000 base pairs. Regions of interest (solid) were identified as associated with HbF levels in Sardinians, and regions of interest (striped) were identified in the current GWAS. rs500684 and rs2071348 were significantly associated with HbF in CSSCD (P = 4.7E−08, P = 2.5E−05). rs139161 and rs968856 (brackets) were reported among the top SNPs in Sardinians but were not significantly associated with HbF in the CSSCD or replication sets. Note that base pair locations are reported along the forward direction in kilobases, whereas the HBB locus is transcribed in the reverse direction. CTCF binding predictions were generated by screening for high-interest potential matches from a BLAST search (http://blast.ncbi.nlm.nih.gov) using one of 2 published CTCF consensus sequences: either 5′-GTGGCCACCAGGGGGCGCCG-3′ or 5′-CCGCTAGGGGGCAGCA-3′.45
Low LD between SNPs in the β-globin locus and the olfactory receptor cluster genes (supplemental Figure 3) suggests that one or more variants in the olfactory receptor genes independently are associated with HbF. However, one cannot definitely exclude LD between untested SNPs in either the olfactory receptor region or the HBB locus.
The observed differences in HbF levels between males and females in both the discovery and replication sets suggest sex-specific modulation of HbF. The top SNP on chromosome 11 (rs5006884) had a stronger effect in males (β = 0.25) than in females (β = 0.15) when we fit separate regression models for males and females. The effects are in the same direction, indicating that the minor allele is associated with increased levels of HbF; however, there may be other SNPs for which the effect is only seen in males or females or for which the effect is in opposite directions for males and females. Their detection requires assessing SNP by gender interactions for which our studies are underpowered. Because gender explains only 2.7% of the variability in HbF, larger studies are needed to detect sex-specific effects.
Lack of replication in the Thailand and Hong Kong subjects for OR51B5 and OR51B6 might reflect the fact that subjects' alternative means of HbF regulation have evolved in different ethnic groups. For example, the 6q22-23 HBS1L-MYB interval accounts for approximately 20% of the overall variance in of HbF in normal European whites but only 3% to 7% of the variance in blacks and Brazilians with sickle cell anemia.35 Alternatively, there might be insufficient power in the smaller Thailand and Hong Kong populations to detect an effect.
Polymorphisms in the upstream olfactory receptor region might conceivably modulate HbF levels by altering chromatin structure within the β-globin gene–like cluster.45,47 Within the region of olfactory receptors is a known DNase hypersensitive site approximately 111 kb upstream of the HBE promoter (HS-111).48 This site is a component of an active chromatin hub in murine cells expressing globin genes.49 However, the functional roles of these regions in relation to downstream globin gene expression presently remain uncertain,50,51 and additional experimentation is needed. In human K562 cells expressing embryonic and fetal globin genes, transcription occurred upstream of the LCR and included the region of HS-111 and OR51B5, further supporting the functional importance of this region and the possibility that polymorphisms could affect chromatin structure.52 Also in this region are conserved binding sites for the transcription factor CTCF that flank the β-globin gene–like cluster and can function in positive and negative regulation of transcription. In humans, evidence suggests that these sites function as insulators. Polymorphisms in this region might affect the actions of enhancers, possibly through their effects on CTCF binding its receptors, thereby affecting the interaction of the globin genes with enhancers in the olfactory receptor regions.53-55
One model suggested that an insulating element at 5′ hypersensitive site 5 of the LCRs could prevent inappropriate interactions between the LCR and upstream regions in erythroid cells, such as the olfactory receptor genes and the U3 enhancer of the ERV-9 retroviral element. Functional studies in human cell lines and primary erythroid cells are needed to further explore these and other possible mechanisms by which the olfactory receptor locus might modulate HbF expression.
The online version of this article contains a data supplement.
The publication costs of this article were defrayed in part by page charge payment. Therefore, and solely to indicate this fact, this article is hereby marked “advertisement” in accordance with 18 USC section 1734.
Acknowledgments
This work was supported by the National Institutes of Health (grants R01 HL 87681 and R01 HL 068970, M.H.S.; and R01 DK 069646, D.H.K.C.).
National Institutes of Health
Authorship
Contribution: N.S., J.N.M., S.W.H., and D.A.D. developed the database, worked on bioinformatics, performed all analyses, and revised the manuscript; R.S. performed analyses; C.T.B. was involved in SNP genotyping; E.S.K., M.E.G., A.A.-K., M.J.T., S.F., S.Y.H., and C.-K.L. provided patient information and laboratory data and edited the manuscript; and P.S., L.A.F., C.T.B., D.H.K.C., and M.H.S. conceived the study, wrote the manuscript, analyzed data, and revised the manuscript.
Conflict-of-interest disclosure: The authors declare no competing financial interests.
Correspondence: Martin H. Steinberg, Boston Medical Center, 88 E Newton St, Evans Bldg, Rm 211, Boston University School of Medicine, Boston, MA; e-mail: mhsteinb@bu.edu.
