Abstract
Human T-lymphotropic virus type 1 (HTLV-1) infection causes adult T-cell leukemia and several lymphocyte-mediated inflammatory diseases. Persistent HTLV-1 infection is determined by a balance between host immune responses and virus spread. Immunomodulatory therapy involving HTLV-1–infected patients occurs in a variety of clinical settings. Knowledge of how these treatments influence host-virus relationships is not understood. In this study, we examined the effects of cyclosporine A (CsA)–induced immune suppression during early infection of HTLV-1. Twenty-four New Zealand white rabbits were split into 4 groups. Three groups were treated with either 10 or 20 mg/kg CsA or saline before infection. The fourth group was treated with 20 mg/kg CsA 1 week after infection. Immune suppression, plasma CsA concentration, ex vivo lymphocyte HTLV-1 p19 production, anti–HTLV-1 serologic responses, and proviral load levels were measured during infection. Our data indicated that CsA treatment before HTLV-1 infection enhanced early viral expression compared with untreated HTLV-1–infected rabbits, and altered long-term viral expression parameters. However, CsA treatment 1 week after infection diminished HTLV-1 expression throughout the 10-week study course. Collectively, these data indicate immunologic control is a key determinant of early HTLV-1 spread and have important implications for therapeutic intervention during HTLV-1–associated diseases.
Introduction
Human T lymphotropic virus type 1 (HTLV-1) is the causative agent of adult T-cell leukemia (ATL)/lymphoma and is strongly associated with HTLV-1–associated myelopathy/tropical spastic paraparesis (HAM/TSP) and a variety of other immune-mediated disorders.1-3 Despite a strong immune response against HTLV-1, the virus typically is maintained as a persistent infection throughout the lifetime of infected subjects. Critical immunologic parameters, including efficient cytotoxic T-cell responses against HTLV-1–expressing cells, determine viral loads throughout the course of infection and are linked to disease outcomes.4,5
There have been several reports focused on the effect of immune suppression on pathogenesis of HTLV-1 disease.6-9 HTLV-1–infected patients who are concurrently treated with immunosuppressive drugs, typically for organ or bone marrow transplantation procedures, often exhibit an accelerated or altered course for the development of HTLV-1–associated diseases.10-13 These patients typically receive drugs such as cyclosporine A (CsA) and tacrolimus (FK-506) to prevent organ graft rejection. There are limited reports of the effects of immune suppression on early HTLV-1 infection because of the lack of clinical materials and inability to simulate the initial exposure of HTLV-1 infection on humans.
We have used the rabbit model of HTLV-1 infection, in part, because of the ease and consistency of transmission of the viral infection in this species. Rabbits have been used to confirm routes of transmission for the virus infection, monitor sequential immune responses against HTLV-1 infection, test vaccine approaches, and determine virus-host relationships during the course of infection.14-18
Our current study reported in this work tested the effects of immune suppression on the early spread of HTLV-1 infection in an established rabbit model. New Zealand white rabbits were divided into groups and treated with 10 mg/kg CsA, 20 mg/kg CsA, or saline vehicle control before infection by intravenous inoculation of HTLV-1–infected rabbit cells. Another group of rabbits was treated with 20 mg/kg CsA 1 week after HTLV-1 infection. Plasma CsA concentrations were monitored to ensure that therapeutic concentrations of the drug were obtained during treatment periods. Immune suppression was monitored in the rabbits by measuring lymphocyte proliferation to a recall antigen and mitogen stimulation, as well as flow cytometry and hematologic analysis. HTLV-1 viral expression in rabbits was monitored by testing ex vivo lymphocyte HTLV-1 p19 production, serologic parameters, and proviral loads from peripheral blood lymphocyte cultures. CsA treatment before HTLV-1 infection enhanced early viral expression compared with untreated HTLV-1–infected rabbits, and did alter long-term viral expression parameters. However, CsA treatment 1 week after infection diminished HTLV-1 expression throughout the 10-week study course. Our data indicate that immunologic control during early virus exposure determines subsequent HTLV-1 spread and has important implications for therapeutic intervention strategies and the development of HTLV-1–associated diseases.
Methods
Rabbit and human cell lines and blood leukocyte isolation
A CD4+ rabbit lymphocyte line (R49) was used to establish HTLV-1 infection in New Zealand white rabbits, as described.19 The derivation and infectious properties of the full-length, wild-type HTLV-1 proviral clone (ACH) and generation of the R49 cell line have been previously reported.19 Jurkat T cells (clone E6-1; ATCC catalog no. TIB-152) were maintained in RPMI 1640 supplemented with 10% fetal bovine serum, 10% penicillin/streptomycin (100 μg/mL), and 10% glutamine (0.03 mg/mL) at 37°C in 5% carbon dioxide. Peripheral blood mononuclear cells (PBMCs) were isolated from 10 to 20 mL of whole blood from the lateral auricular artery at each time point indicated. Percoll (Sigma-Aldrich) at 1.083 g/mL was used to isolate rabbit lymphocytes. Rabbit lymphocytes were cultured in RPMI 1640 (Invitrogen), 15% fetal bovine serum (Invitrogen), 1% penicillin-streptomycin (Invitrogen), 1% sodium pyruvate (Invitrogen), 2% l-glutamine (Invitrogen), 250 μL of 2 mercaptoethanol, and 10 U/mL recombinant human interleukin-2 (National Institutes of Health AIDS Research and Reference Reagent Program 136).
Rabbit inoculation
We obtained 24 female 12-week-old New Zealand white rabbits (Harlan). Rabbits were housed and maintained in accordance with a protocol approved by the Ohio State University Animal Care and Use Committee. On the day of inoculation, the rabbits were inoculated with 1 × 10⁷ R49 cells in the lateral ear artery. The rabbits were regularly evaluated for any overt signs of clinical disease. Complete hematologic analysis of blood samples was performed by automated cell counting and morphologic examination. The rabbits were humanely killed for necropsy at indicated time points.
CsA treatments and monitoring
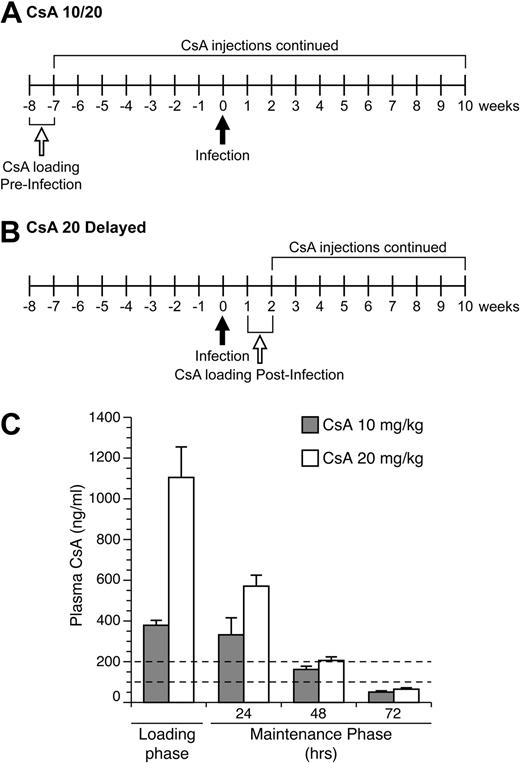
Immune suppression was induced in rabbits using loading and maintenance treatment regiments of CsA (Bedford Laboratories; 55390-122-10, stock concentration 50 mg/mL diluted in 0.9% sodium chloride; Figure 1A-B). Rabbits were injected subcutaneously with 2 mL of diluted CsA at either 10 mg/kg or 20 mg/kg daily for 1 week, during the loading phase. After day 7, CsA injections were injected to maintain CsA therapeutic concentrations every 3 days until necropsy. Plasma CsA levels were measured by high pressure liquid chromatography at the Ohio State Medical Center. Rabbits were weighed monthly and monitored for clinical effects of CsA treatments.
Lymphocyte proliferation assay
PBMCs were isolated from whole blood, as described.20 To monitor mitogen stimulation and recall antigen responses, 5 × 10⁵ rabbit PBMCs/mL were cultured with concanavalin A (Con A; Sigma-Aldrich; C-0412), tetanus toxoid, and γ-irradiated Jurkat T cells. Rabbit PBMC cultures were treated with 5 μg/mL tetanus toxoid (Calbiochem; 582231) or cocultured with 2 × 10⁵ cells/mL γ-irradiated Jurkat T cells. Tritiated thymidine was used to measure lymphocyte proliferation to Con A and Jurkat T-cell recall antigen, as described.21
Hematology
Automated complete blood counts and differential cell counts were performed on 500 μL of whole rabbit blood at The Ohio State University College of Veterinary Medicine, Clinical Laboratories (VetScan hematologic analyzer). Relative leukocyte differential cell counts were confirmed by counting at least 100 cells from blood films in a blinded manner by 2 qualified technicians. Morphologic examination was used to classify blood leukocytes as normal lymphocytes, reactive lymphocytes (enlarged nuclei with open chromatin), heterophils, monocytes, basophils, and eosinophils. Absolute white blood cell numbers were calculated by multiplying the total white blood cell count by the percentage of each leukocyte in differential counts.
Immunophenotyping
Flow cytometric analysis was conducted on a Beckman Coulter EPICS Elite flow cytometer. PBMCs were isolated, as previously described.20 Cells were washed twice in phosphate-buffered saline with 0.1% fetal bovine serum (Invitrogen) and 0.1% sodium azide and stained at 1:100 with anti-rabbit T-cell fluorescein isothiocyanate (Antigenix America), anti-rabbit CD4 phycoerythrin (Antigenix America), or anti-rabbit CD8 phycoerythrin (Antigenix America). Cells were then incubated at 37°C for 1 hour. The anti-rabbit T-cell fluorescein isothiocyanate recognizes an uncharacterized, but common T-cell antigen that identifies more than 90% rabbit thymocytes and 40% of mesenteric lymph node lymphocytes. After incubation, cells were washed twice and fixed with 4% paraformaldehyde. After cells were fixed, they were analyzed by flow cytometry.
Serologic response to HTLV-1 infection
The HTLV-1–specific antibody titer from inoculated rabbits was determined by use of a commercial enzyme-linked immunosorbent assay (ELISA; bioMerieux), which was adapted for use with rabbit plasma by substitution of horseradish peroxidase–conjugated goat anti–rabbit immunoglobulin G (1/3000 dilution; Chemicon International). Plasma was diluted 1/8000 to obtain values in the linear range of the assay, and data were expressed as absorbance values. Reactivity to specific viral antigenic determinants was detected using a commercial HTLV-1 Western immunoblot assay (GeneLabs Diagnostics) adapted for rabbit plasma by use of alkaline phosphatase–conjugated goat anti–rabbit immunoglobulin G (1/1000 dilution; bioMerieux). Plasma (diluted 1/100) showing reactivity to HTLV-1 Gag (p24 or p19) and Env (p21 or gp46) antigens was classified as positive for HTLV-1 seroreactivity.
Detection of p19 matrix antigen from cultured rabbit PBMC
To test for active HTLV-1 infection in rabbit PBMC p19 MA, enzyme-linked immunosorbent assays (ZeptoMetrix) were preformed on supernatants from 1-day PBMC cultures (1 × 10⁶ per well), as described.20
Detection of proviral copy number by polymerase chain reaction
To quantify the proviral copy number, genomic DNA was isolated from rabbit PBMC using the manufacturer's protocol (Qiagen DNeasy blood and tissue kit 69504). DNA concentration and quality were determined (NanoDrop Technologies). HTLV-1 polymerase gene (pol) primers were used at a final concentration of 200nM both forward and reverse primers. The forward pol primer 5′-CCC TAC AAT CCA ACC AGC TCA G-3′ and the reverse primer 3′-TTT TGG GCT ACC GTC GAA GTG GTG-5′ were used to amplify genomic DNA. Standard curves were generated using DNA from a molecular clone of HTLV-1, the ACH plasmid, and assayed concurrently with test samples. Forward rabbit glyceraldehyde-3-phosphate dehydrogenase (rGAPDH) primers 5′-TGC CCA GTG TCA AGT CTG TT-3′ and reverse primers 3′-TCT TCG TCG TGT GTC GTG TC-5′ were used at a final concentration of 250nM to amplify genomic DNA. Standard curves for rGAPDH were generated by subcloning a 780-basepair fragment from the rGAPDH gene into the pCR4-Topo vector (Invitrogen) and run concurrently with test samples. For each run, a standard curve was generated from triplicate samples of log 10 dilutions of plasmid DNA in DNase/RNase-free water. The HTLV-1 proviral load was expressed as infected cells per 10 000 PBMCs and was calculated using the following formula: (HTLV-1 pol copy number)/(rabbit GAPDH copy number/2) × 10 000.
Statistical methods
Log transformation was applied to ex vivo p19 production, HTLV-1 antibody ELISA, and proviral load for the purpose of variance stabilization. Linear mixed models were used to model correlated multiple observations of each rabbit for the data analysis of lymphocyte proliferation, ex vivo p19 production, HTLV-1 antibody ELISA, and proviral load. Treatment group, time, and their interaction were included in the models. Contrasts of treatment group means of interest, such as immune suppressed versus no treatment, were calculated and P values were adjusted by Holm step-down method to account for multiple comparisons.
Results
CsA plasma concentrations
To monitor CsA in treated rabbits to ensure our protocol established therapeutic concentrations, we submitted samples for high pressure liquid chromatography analysis to measure CsA in plasma samples from rabbits (Figure 1C). Our goal was to achieve concentrations of CsA in plasma similar to reported targeted therapeutic levels in human transplant patients, 100 to 200 ng/mL. Our drug-dosing protocol during the loading phase produced average CsA plasma concentrations in the 10 and 20 mg/kg rabbit groups of 379 and 1105 ng/kg, respectively (Figure 1C). During the maintenance phase of treatment, the 10 mg/kg–treated rabbits had CsA plasma concentrations levels of 332, 162, and 51 ng/kg at 24, 48, and 72 hours after treatment, respectively (Figure 1C). The 20 mg/kg–treated rabbits had CsA plasma concentrations of 571, 206, and 65 ng/kg at 24, 48, and 72 hours after treatment, respectively (Figure 1C). Thus, our treatment protocols with repeated treatments after loading phases produced sustained CsA levels in our targeted therapeutic range.
CsA dosing regimen. (A) Rabbits in the 10- and 20-mg/kg CsA treatment groups were immune suppressed for 8 weeks before infection. Rabbits received daily CsA injections for the first week of treatment. After the loading phase, CsA injections were given every 3 days (maintenance phase). At 10 weeks after infection, these rabbits were euthanized and necropsied. (B) Rabbits in the delayed 20 mg/kg CsA treatment group were infected for 1 week before the start of CsA treatment. At 2 weeks after infection, the rabbits were given daily CsA injections for 1 week. After the loading phase, rabbits were put on the same maintenance schedule as the other CsA-treated groups. At 10 weeks after infection, rabbits were killed and necropsied. (C) CsA plasma concentration levels were measured during the loading phase and maintenance phase of CsA treatment. The dotted lines represent the therapeutic plasma concentration range seen in human patients.
CsA dosing regimen. (A) Rabbits in the 10- and 20-mg/kg CsA treatment groups were immune suppressed for 8 weeks before infection. Rabbits received daily CsA injections for the first week of treatment. After the loading phase, CsA injections were given every 3 days (maintenance phase). At 10 weeks after infection, these rabbits were euthanized and necropsied. (B) Rabbits in the delayed 20 mg/kg CsA treatment group were infected for 1 week before the start of CsA treatment. At 2 weeks after infection, the rabbits were given daily CsA injections for 1 week. After the loading phase, rabbits were put on the same maintenance schedule as the other CsA-treated groups. At 10 weeks after infection, rabbits were killed and necropsied. (C) CsA plasma concentration levels were measured during the loading phase and maintenance phase of CsA treatment. The dotted lines represent the therapeutic plasma concentration range seen in human patients.
CsA treatment reduced T-cell numbers but not CD4/CD8 ratios
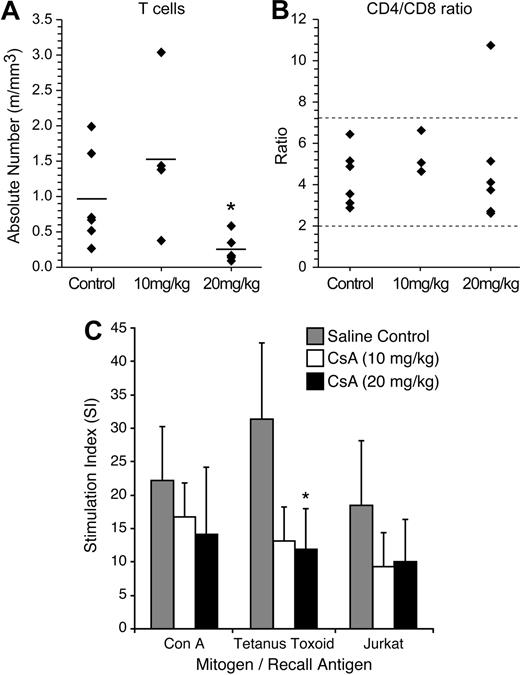
To determine the effects of CsA treatment on rabbit lymphocyte subsets (CD4, CD8, and total T cells), we performed FACS analysis on rabbit PBMC samples 2 weeks after CsA treatment (Figure 2A-B). The 20 mg/kg CsA–treated rabbits displayed a statistically significant (P = .05) decrease in the number of total T cells, 0.25 million cells/mL (m/mL), compared with saline-treated rabbits, 0.96 m/mL. The 10 mg/kg CsA–treated rabbit T-cell count (1.52 m/mL) was not statistically different from controls in absolute T cells. Although there was a decrease in T cells witnessed in the 20 mg/kg CsA–treated group, the CD4+/CD8+ T-cell ratio was not statistically different from the control group or the 10 mg/kg CsA–treated groups (Figure 2B). These data indicated that our CsA treatment was not selective for a specific T-cell fraction.
CsA treatment reduces T-cell numbers, but does not alter CD4/CD8 ratio. (A) CsA treatment reduces T-cell numbers, but does not alter CD4/CD8 ratio. Rabbits were immunophenotyped after 2 weeks of CsA treatment. Rabbit lymphocytes were isolated from PBMC and examined for the following T-cell markers: T cell, CD4, and CD8. Twenty mg/kg CsA-treated rabbits had a statistically significant (P < .01) decrease in the number of T cells after 2 weeks of CsA treatment. (B) The CD4/CD8 ratio was not skewed during CsA treatment in either the 10 or 20 mg/kg CsA treatment groups. (C) CsA treatment suppresses T-helper cell responses to protein antigens and xenogeneic cells in rabbits. A lymphocyte proliferation assay was used to examine whether rabbit lymphocytes were functionally immune suppressed after CsA treatment. Before CsA treatment, rabbits were immunized with tetanus toxoid and Jurkat T cells. Two weeks after CsA treatment, rabbits treated with 20 mg/kg displayed statistically significant (P = .006) decrease in stimulation index to tetanus toxoid. The CsA-treated rabbits displayed decreases in stimulation index in tetanus toxoid and Jurkat T cells compared with control rabbits.
CsA treatment reduces T-cell numbers, but does not alter CD4/CD8 ratio. (A) CsA treatment reduces T-cell numbers, but does not alter CD4/CD8 ratio. Rabbits were immunophenotyped after 2 weeks of CsA treatment. Rabbit lymphocytes were isolated from PBMC and examined for the following T-cell markers: T cell, CD4, and CD8. Twenty mg/kg CsA-treated rabbits had a statistically significant (P < .01) decrease in the number of T cells after 2 weeks of CsA treatment. (B) The CD4/CD8 ratio was not skewed during CsA treatment in either the 10 or 20 mg/kg CsA treatment groups. (C) CsA treatment suppresses T-helper cell responses to protein antigens and xenogeneic cells in rabbits. A lymphocyte proliferation assay was used to examine whether rabbit lymphocytes were functionally immune suppressed after CsA treatment. Before CsA treatment, rabbits were immunized with tetanus toxoid and Jurkat T cells. Two weeks after CsA treatment, rabbits treated with 20 mg/kg displayed statistically significant (P = .006) decrease in stimulation index to tetanus toxoid. The CsA-treated rabbits displayed decreases in stimulation index in tetanus toxoid and Jurkat T cells compared with control rabbits.
CsA treatment suppresses T-helper cell responses to protein antigens and xenogeneic cells in rabbits
We conducted lymphocyte proliferation assays to test whether our CsA treatment caused immune suppression in our rabbits. Before CsA treatment and HTLV-1 inoculation, rabbits were injected with tetanus toxoid and γ-irradiated Jurkat T cells. After 2 weeks of CsA treatment, rabbit lymphocytes were tested in a lymphocyte proliferation assay. In our assay, tetanus toxoid and γ-irradiated Jurkat T cells were used as recall antigens at 5 μg/mL and 2 × 10⁵ cells/mL, respectively. Con A was used as a positive control. PBMC isolated from rabbits treated with CsA had a decreased ability to proliferate in response to recall antigens (Figure 2C). Control and CsA-treated rabbit lymphocytes exhibited similar ability to proliferate in response to Con A. Both 10 and 20 mg/kg CsA–treated rabbit group PBMCs exhibited downward trends in their ability to proliferate in response to exposure to tetanus toxoid and γ-irradiated Jurkat T cells (Figure 2C). PBMC from the 20 mg/kg CsA–treated rabbits cultured in the presence of tetanus toxoid recall antigen displayed a statistically significant decrease in proliferation. These data confirmed that CsA-treated rabbits had functional impairment in immune responses compared with saline-treated control rabbits.
CsA treatment alters response to viral-associated lymphocytosis
Complete blood counts and differential leukocyte counts from blood smears were obtained from rabbits throughout the study to monitor hematologic changes associated with CsA treatment on HTLV-1 infection. Rabbits treated with 20 mg/kg CsA before infection displayed statistically significant increases in the number of leukocytes, normal lymphocytes, and reactive lymphocytes after infection. At 2 and 4 weeks after infection, rabbits treated with 20 mg/kg CsA had 12.61 and 17.66 × 10⁶ cells/mL total leukocytes, respectively, whereas control rabbits had 4.34 and 5.27 × 10⁶ cells/mL. However, these increases were only transient and returned to the level of control rabbits by 10 weeks after infection. There were no statistically significant differences at any time point in numbers of reactive lymphocytes in the CsA-delayed treated groups compared with control rabbits (data not shown). Total lymphocyte counts, heterophils, eosinophil, basophil, and monocyte counts were not statistically altered in treatment groups compared with controls.
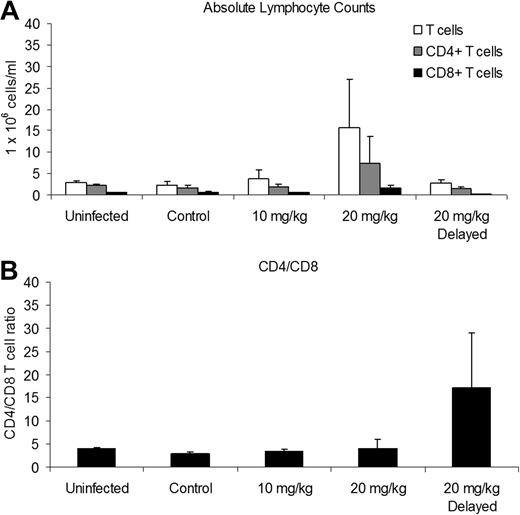
We conducted immunophenotyping of blood leukocytes at 6 weeks after infection to determine the effects of CsA treatment and HTLV-1 infection on the CD4/CD8 ratio. Rabbits treated with 20 mg/kg CsA before infection had increases in the mean (± SD) absolute number of T cells and CD4+ and CD8+ T cells, 15.61 (± 11.48), 7.25 (± 6.36), and 1.58 (± 0.67) 1 × 10⁶ cells/mL, respectively, compared with infected control rabbits, 3.70 (± 0.82), 1.95 (± 0.65), and 0.61 (± 0.23) × 106 cells/mL (Figure 3A).
CsA treatment alters absolute lymphocyte counts during infection. We used flow cytometry and an automated hematologic analyzer to determine absolute lymphocyte counts 6 weeks after infection. (A) The 20 mg/kg CsA–treated rabbits had increased absolute T cell, CD4+, and CD8+ T cells. (B) The 20 mg/kg CsA–delayed treatment rabbits had increased CD4/CD8 T-cell ratios due, in part, to a decrease in CD8+ T cells.
CsA treatment alters absolute lymphocyte counts during infection. We used flow cytometry and an automated hematologic analyzer to determine absolute lymphocyte counts 6 weeks after infection. (A) The 20 mg/kg CsA–treated rabbits had increased absolute T cell, CD4+, and CD8+ T cells. (B) The 20 mg/kg CsA–delayed treatment rabbits had increased CD4/CD8 T-cell ratios due, in part, to a decrease in CD8+ T cells.
The CD4/CD8 T-cell ratio of rabbits receiving 10 mg/kg and 20 mg/kg CsA treatment was not significantly different between uninfected and infected control rabbits (Figure 3B). However, the CD4/CD8 T-cell ratio of the rabbits receiving 20 mg/kg CsA-delayed treatment increased to 17.29 (± 11.64) compared with infected control rabbits (2.86 ± 0.43; Figure 3B). The increase in the CD4/CD8 T-cell ratio was enhanced by a decrease in CD8+ T cells, 0.12 (± 0.07) compared with infected control rabbits (0.61 ± 0.23 × 10⁶ cells/mL).
CsA treatment suppresses HTLV-1 antibody responses in a dose-dependent manner
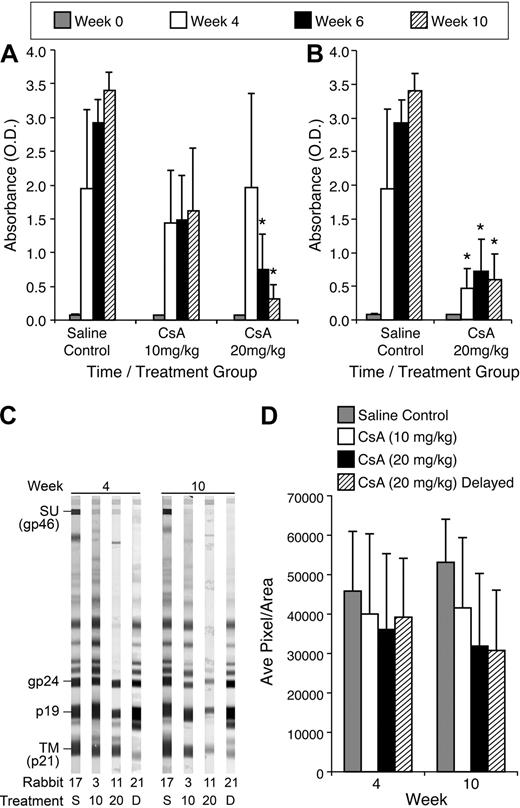
To evaluate HTLV-1–specific antibody responses from CsA-treated rabbits compared with control rabbits, we measured HTLV-1 antibody by ELISA. Rabbits treated with 20 mg/kg CsA displayed a statistically significant decrease in HTLV-1 antibody titer compared with control rabbits at 6 and 10 weeks after infection. The average optical density (O.D.) for rabbits receiving 20 mg/kg CsA before infection was 1.97, 0.75, and 0.313 at 4, 6, and 10 weeks after infection, respectively (Figure 4A). The average O.D. for control rabbits was 1.95, 2.93, and 3.40 at 4, 6, and 10 weeks after infection, respectively (Figure 4A). Rabbits receiving 10 mg/kg CsA displayed reduced HTLV-1 antibody titers, but had no statistical difference compared with untreated, but infected controls. Rabbits receiving delayed 20 mg/kg treatment of CsA also displayed significant decreases in HTLV-1 antibody titer. At 4, 6, and 10 weeks after infection, the delayed 20 mg/kg CsA rabbits had O.D. of 0.48, 0.72, and 0.59, respectively (Figure 4B).
CsA treatment suppresses HTLV-1 antibody responses in a dose-dependent manner. We used a HTLV-1 ELISA to determine the level of HTLV-1 antibodies in the plasma of rabbits after infection. (A) The 20 mg/kg CsA–treated rabbits displayed statistically significant (P < .001) decreases 6 and 10 weeks after infection. All CsA-treated rabbits displayed decreases in HTLV-1 antibodies at 4, 6, and 10 weeks after infection compared with control rabbits. (B) The 20 mg/kg CsA–delayed treatment rabbits had statistically significant decreases in HTLV-1 antibody titers 4, 6, and 10 weeks after infection compared with control rabbits (P < .001). (C) CsA treatment leads to a decreased antibody response to HTLV-1 Env SU. Western blot analysis was used to determine whether CsA treatment leads to a decrease in HTLV-1 antibodies directed against Env SU, transmembrane, and p19. (D) Densitometry was used to numerate the pixels in the bands. Rabbits treated with 20 mg/kg CsA before and after infection both had significant decreases in antibodies directed against HTLV-1 Env SU 10 weeks after infection.
CsA treatment suppresses HTLV-1 antibody responses in a dose-dependent manner. We used a HTLV-1 ELISA to determine the level of HTLV-1 antibodies in the plasma of rabbits after infection. (A) The 20 mg/kg CsA–treated rabbits displayed statistically significant (P < .001) decreases 6 and 10 weeks after infection. All CsA-treated rabbits displayed decreases in HTLV-1 antibodies at 4, 6, and 10 weeks after infection compared with control rabbits. (B) The 20 mg/kg CsA–delayed treatment rabbits had statistically significant decreases in HTLV-1 antibody titers 4, 6, and 10 weeks after infection compared with control rabbits (P < .001). (C) CsA treatment leads to a decreased antibody response to HTLV-1 Env SU. Western blot analysis was used to determine whether CsA treatment leads to a decrease in HTLV-1 antibodies directed against Env SU, transmembrane, and p19. (D) Densitometry was used to numerate the pixels in the bands. Rabbits treated with 20 mg/kg CsA before and after infection both had significant decreases in antibodies directed against HTLV-1 Env SU 10 weeks after infection.
CsA treatment reduced antibody response to HTLV-1 Env proteins, surface unit and transmembrane
Antibody responses against HTLV-1 envelope glycoprotein (gp) 46 (surface unit [SU]) and transmembrane gp 21 were analyzed by densitometry using Western blot strips, and representative rabbits are displayed for each treatment group (Figure 4C). Rabbits receiving 20 mg/kg CsA before and after infection displayed trends toward decreased antibody response to HTLV-1 SU (Figure 4D). At 10 weeks after infection, the 20 mg/kg CsA–treated groups had average pixels/area values of 31 879 and 30 772, respectively, whereas the control rabbits had 53 130. Densitometry comparisons between the 10 mg/kg CsA–treated rabbits and infected and non–CsA-treated controls revealed no significant differences in HTLV-1 SU reactivity.
Enhanced HTLV-1 p19 from ex vivo–cultured PBMC in rabbits pretreated with 10- and 20-mg/kg doses of CsA
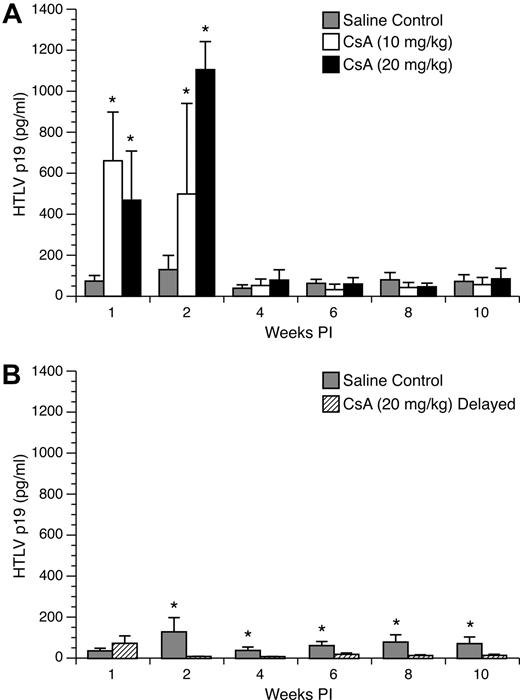
To monitor active viral replication in HTLV-1–infected rabbits treated with CsA, rabbit PBMC were cultured ex vivo for 24 hours in complete media and tested by ELISA. PBMC cultures from CsA-treated rabbits displayed a statistically significant increase in p19 production compared with lymphocytes from untreated, but infected control rabbits at 1 and 2 weeks after infection. At 1 week after infection, mean (± SD) values of p19 measured from PBMC cultures from control rabbits were 37 (± 14) pg/mL compared with 330 (± 119) and 234 (± 120) pg/mL for the 10 mg/kg and 20 mg/kg groups, respectively (Figure 5A). At 2 weeks after infection, p19 production increased from lymphocytes from control rabbits to 130 (± 69) pg/mL, whereas the 10 mg/kg and 20 mg/kg groups increased to 499 (± 442) and 1105 (± 137) pg/mL, respectively. However, this increase in p19 production was transient, and in the following weeks there was no statistically significant difference in p19 production among the groups.
Ex vivo p19 production from cultured rabbit lymphocytes. Rabbit lymphocytes were isolated from PBMC and cultured for 24 hours. p19 MA, a measure of virus expression, was measured on a HTLV-1 ELISA. (A) Rabbits treated with 10 mg/kg and 20 mg/kg CsA displayed significant increases in ex vivo p19 production compared with control rabbits at 1 and 2 weeks after infection. (B) Rabbits receiving 20 mg/kg CsA after infection had their ex vivo p19 production abolished after the start of CsA treatment.
Ex vivo p19 production from cultured rabbit lymphocytes. Rabbit lymphocytes were isolated from PBMC and cultured for 24 hours. p19 MA, a measure of virus expression, was measured on a HTLV-1 ELISA. (A) Rabbits treated with 10 mg/kg and 20 mg/kg CsA displayed significant increases in ex vivo p19 production compared with control rabbits at 1 and 2 weeks after infection. (B) Rabbits receiving 20 mg/kg CsA after infection had their ex vivo p19 production abolished after the start of CsA treatment.
PBMC cultures from delayed 20 mg/kg CsA–treated rabbits displayed a statistically significant decrease in p19 production compared with lymphocytes from untreated, but infected control rabbits at 2, 4, 6, 8, and 10 weeks after infection. One week after infection, PBMC p19 production from control and delayed 20 mg/kg CsA–treated groups was not statistically different. However, 2 weeks after infection (1 week after CsA treatment was started), rabbits who received delayed 20 mg/kg CsA treatment had no detectable p19 expression for the rest of the study (Figure 5B).
Effect of CsA treatment on proviral load in early HTLV-1 infection
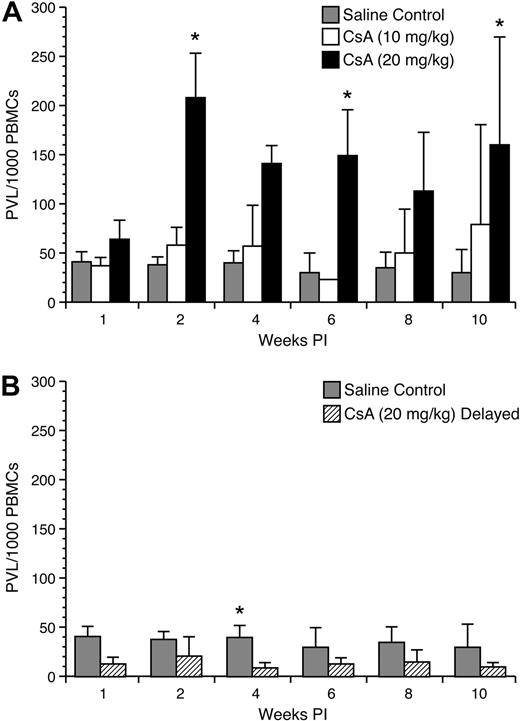
To test the influence of CsA on HTLV-1 proviral copy numbers were measured from rabbit PBMC samples. Rabbits immune suppressed with 10 mg/kg and 20 mg/kg CsA before infection displayed transient increases in proviral load at early time points after infection (Figure 6A). Rabbits receiving 10 mg/kg CsA treatment had a higher mean proviral load per 10 000 PBMCs compared with control rabbits at 2 (58 ± 18 vs 38 ± 8), 4 (57 ± 41 vs 40 ± 12), 8 (50 ± 44 vs 35 ± 15), and 10 (79 ± 101 vs 30 ± 23) weeks after infection. Rabbits receiving 20 mg/kg CsA treatment before infection had multiple weeks in which there was statistically significantly difference between their proviral loads per 10 000 PBMCs compared with control rabbits (Figure 6B). These rabbits displayed higher average proviral loads per 10 000 PBMC at 1 (64 ± 19 vs 41 ± 10), 2 (208 ± 45 vs 38 ± 8), 4 (141 ± 18 vs 40 ± 12), 6 (149 ± 46 vs 30 ± 20), 8 (113 ± 59 vs 35 ± 15), and 10 (160 ± 109 vs 30 ± 23) weeks after infection. Interestingly, rabbits receiving 20 mg/kg CsA treatment 1 week after infection displayed lower proviral loads. After the start of CsA treatment at 4 (9 ± 5 vs 40 ± 12), 6 (13 ± 6 vs 30 ± 20), 8 (15 ± 12 vs 35 ± 15), and 10 (10 ± 4 vs 30 ± 23) weeks after infection, these rabbits displayed a decrease in proviral copy number compared with control rabbits (Figure 7).
Proviral load analysis of mononuclear leukocytes. Genomic DNA was isolated from lymphocytes and used in a real-time polymerase chain reaction assay to detect proviral copy numbers. (A) Rabbits treated with 20 mg/kg CsA before infection displayed significant increases in the number of proviral copies up to 4 weeks after infection. The difference between 10 mg/kg CsA-treated rabbits and the control rabbits was not statistically significant. (B) Rabbits treated with 20 mg/kg CsA after infection displayed a decrease in the number of provirus-carrying lymphocytes after the beginning of CsA treatment.
Proviral load analysis of mononuclear leukocytes. Genomic DNA was isolated from lymphocytes and used in a real-time polymerase chain reaction assay to detect proviral copy numbers. (A) Rabbits treated with 20 mg/kg CsA before infection displayed significant increases in the number of proviral copies up to 4 weeks after infection. The difference between 10 mg/kg CsA-treated rabbits and the control rabbits was not statistically significant. (B) Rabbits treated with 20 mg/kg CsA after infection displayed a decrease in the number of provirus-carrying lymphocytes after the beginning of CsA treatment.
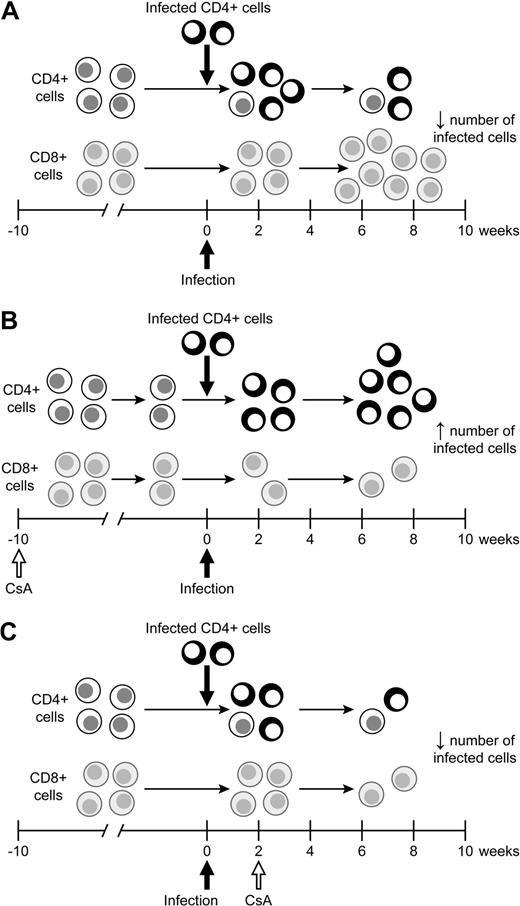
Model of the effects of CsA treatment on HTLV-1 infection. (A) During the natural course of infection, infected lymphocytes spread early during infection before a immune response is formed. After a full immune response is formed, the spread of infected lymphocytes is controlled. (B) CsA treatment before HTLV-1 infection decreases the HTLV-1–specific cell-mediated immune response, allowing for infected lymphocytes to produce more virus. The increase in virus production early leads to an increase in the proviral load in early infection. (C) CsA treatment after infection significantly reduces virus expression, in turn leading to a decrease in the number of HTLV-1–infected lymphocytes over the course of infection.
Model of the effects of CsA treatment on HTLV-1 infection. (A) During the natural course of infection, infected lymphocytes spread early during infection before a immune response is formed. After a full immune response is formed, the spread of infected lymphocytes is controlled. (B) CsA treatment before HTLV-1 infection decreases the HTLV-1–specific cell-mediated immune response, allowing for infected lymphocytes to produce more virus. The increase in virus production early leads to an increase in the proviral load in early infection. (C) CsA treatment after infection significantly reduces virus expression, in turn leading to a decrease in the number of HTLV-1–infected lymphocytes over the course of infection.
Discussion
The influence of immune suppression on the natural course of HTLV-1 infection and pathogenesis remains unclear. Despite a robust immune response against HTLV-1, the virus typically is maintained as a persistent infection throughout the lifetime of infected subjects. It is established that cytotoxic T-cell responses against HTLV-1–expressing cells are a major determinant of viral load in the infection.4,5 This balance between virus replication and host response is altered in HTLV-1–infected patients treated with immunosuppressive drugs, such as during organ or bone marrow transplantation procedures.10-13 These patients are often given drugs such as CsA to prevent organ graft rejection. In this study, we tested the effects of CsA-induced immune suppression on the early spread of HTLV-1 infection in rabbits. Our rabbit model of infection, although not testing a disease end point, allowed for a sequential examination of the role of immune suppression on early virus replication in vivo, while controlling for route of transmission. Our data indicated that CsA treatment before HTLV-1 infection enhanced early viral expression compared with untreated HTLV-1–infected rabbits, but did not alter p19 production from ex vivo cultured PBMC after 4 weeks of infection. However, long-term proviral copy numbers were increased in rabbits receiving 20 mg/kg CsA before infection. In contrast, CsA treatment 1 week after infection diminished HTLV-1 expression throughout the course of study. Thus, our data support a role for immunologic control during early virus exposure and is a significant determinant of HTLV-1 spread and establishment of proviral copy numbers in systemic circulation. Our results have important implications for therapeutic intervention strategies and the development of HTLV-1–associated diseases.
Much of what is known about the effects of immune suppression on HTLV-1 replication in vivo is derived from clinical case reports in patients. In these cases, immune suppression of HTLV-1–infected asymptomatic carrier has been associated with development of either ATL or HAM/TSP at an accelerated rate compared with the natural course of either disease.22-24 During the natural course of infection, approximately 5% of HTLV-1–infected patients develop ATL or HAM/TSP decades after being infected. This problem has been difficult to study due to a lack of a suitable animal model. Using a rat model of HTLV-1, Hanabuchi et al25 determined that cell-mediated immune responses exert control over development of explanted tumors. Development of rat models for clinical ATL has required the use of immunodeficient rats. Ohashi et al26 demonstrated that an “ATL-like lymphoproliferative disease” could be established in adult nude (nu/nu) rats after inoculation of some, but not all, HTLV-1–immortalized cell lines. This led to studies that examined methods of protection against tumor development, including adoptive transfer of T cells27 and Tax-specific peptide vaccines.28 A protective effect was achieved with each of these systems. Most recently, a protective effect against tumor formation in nude rats was achieved with Tax-specific small interfering RNAs.29 Inoculation of HTLV-1–infected nonleukemic cell lines will form tumors in severe combined immunodeficiency mice only when natural killer (NK) cell activity has been suppressed by sublethal irradiation or by treatment of animals with antiserum that transiently abrogates NK activity (anti-asialo GM1).30 Murine NK cells directly mediate cytolysis of cells harboring active HTLV-1 gene expression, suggesting that the absence of viral gene expression in ATL cells contributes to the ability of these cells to evade immune surveillance in humans.31
Our proviral load data indicated that CsA-induced immune suppression before infection resulted in a statistically significant increase in the number of proviral copies up to 2 months after infection. During this same time period, CsA immune-suppressed rabbits treated before infection also had statistically significant increases in their ex vivo p19 production. When taken together, these 2 datasets suggest immune regulatory controls are operative in the first weeks after infection, which can limit early virus replication and expression. These controls may involve the innate immune system, including NK cells, which have been demonstrated to limit engraftment of ATL cells in mouse models.30 In contrast, a recent study indicated that NK cells are unable to kill HTLV-1–infected primary CD4+ T cells, in part due to a decreased ability of NK cells to adhere to HTLV-1–infected cells because of HTLV-1 p12(I)-mediated down-modulation of intercellular adhesion molecules 1 and 2.32
It is also likely that CsA treatment limited the onset of the acquired immune response to HTLV-1 infection, as indicated by our serologic data from rabbits. We also demonstrated that CsA functionally impaired the ability of rabbits to immunologically respond to recall antigens such as tetanus toxoid and Jurkat T cells. HTLV-1–specific cytotoxic T cells appear to be responsible for killing 10 to 30 infected T cells per day.4 This strong anti-HTLV-1 response selects against infected CD4+ T cells that express viral proteins.4,33 Thus, our data are consistent with the tenet that HTLV-1 most likely maintains a persistent infection by being able to limit virus replication to low levels and by promoting clonal expansion of infected lymphocytes (reviewed in Mortreux et al34 ). Uninfected rabbits treated with CsA had normal CD4+/CD8+ ratios, whereas infected rabbits treated with 20 mg/kg CsA before infection had increased CD4/CD8 T-cell ratios, which were enhanced by a decrease in CD8+ T cells, compared with infected control rabbits. In rabbits pretreated with CsA, the delay in their ability to control virus replication may also reflect a delay in onset of an effective CTL response in these animals. Future studies that measure CTL responses in immune-suppressed rabbits are needed to provide data to support this conclusion.
Other animal models of HTLV-1 infection, in particular the bovine leukemia virus (BLV) model in sheep and HTLV-1 infection of squirrel monkeys, support the role of immunologic control in viral spread.35,36 BLV, a member of the deltaretrovirus family, replicates like HTLV-1 in 2 phases (reviewed in Florins et al37 ). The first phase of infection is reverse transcriptase–driven, whereas the second phase of BLV spread is characterized by lymphocyte mitosis, which maintains the proviral load. In this phase, the retrovirus relies on lymphocyte division to maintain the provirus in the host and decreases viral protein expression to avoid the cell-mediated immune response. In our system, it is conceivable that the decrease in proviral load after 1 month of infection in the rabbits receiving 10 mg/kg CsA treatment is a result of inhibition of HTLV-1 reverse transcriptase–driven viral replication, as suggested by our ex vivo PBMC culture p19 data, which was limited for up to 1 month after infection in CsA-pretreated rabbits. Ozaki et al38 have reported that CsA inhibits Tax expression in ATL cell lines. Whereas this may influence HTLV-1 replication in culture, it is an unlikely explanation for our results. In contrast, in our CsA-pretreated rabbits, we had an enhanced ability to detect virus expression during the early phase of infection. Thus, the role of immunologic control is more likely operative in vivo during CsA treatment.
Interestingly, rabbits receiving 20 mg/kg CsA treatment 1 week after infection displayed a completely different infection profile compared with rabbits immune suppressed with 20 mg/kg CsA before infection. Rabbits receiving 20 mg/kg CsA treatment after infection had statistically significant decreases in proviral copy numbers in PBMC samples and very limited ability to express p19 MA from ex vivo culture PBMC, despite having higher CD4+/CD8+ ratios at 6 weeks after infection. These are the first data to indicate that treatment with CsA soon after virus exposure (1 week after infection) affects a critical phase of HTLV-1 spread in vivo. Thus, it appears that a strategy of HTLV-1 to establish infection is to infect activated T cells rapidly to allow for viral spread in the host before the onset of an active immune response. Our CsA treatment at 1 week after exposure disrupted viral spread, possibly by inhibiting viral-induced activation of target cells. This tenet is consistent with our studies of HTLV-1 molecular clones that fail to establish infection when lacking the ability to express key accessory proteins involved in T-cell activation such as p12.39
Our study is the first one to show that the timing of CsA treatment is instrumental in determining HTLV-1 spread after virus exposure by intravenous routes. This model mimics conditions observed in human transplant patients. Our treatment groups of 10 and 20 mg/kg have been previously documented in rabbit models of lung and heart transplant models,40,41 and we achieved therapeutic ranges in our treated rabbits that are described in multiple human transplant studies.42-46 Allogenic bone marrow transplantation, with CsA as an immune-suppressive regimen, is considered a viable treatment for some forms of HTLV-1 ATL/adult T-cell lymphoma.7,9,47 In our model, rabbits immune suppressed with CsA before infection are representative of HTLV-1–negative transplant patients who receive HTLV-1–contaminated transplant products (organs or bone marrow).23,48,49 Our delayed 20 mg/kg CsA treatment group was designed to represent HTLV-1–infected patients who undergo allogenic bone marrow transplantation.7-9,47,50 Finally, low-dose CsA has been used clinically in HTLV-1–infected patients with HAM/TSP to reduce neurologic signs from lymphocyte-mediated inflammation (G. Taylor, oral communications, International Retrovirology Meeting: HTLV, Tokyo, Japan, May 25, 2007). It will be important for future studies using the rabbit model to test the influence of CsA or other immunosuppressive drug treatments on chronically infected animals.
Collectively, our data indicate that immune suppression with CsA in HTLV-1 infection disrupts the critical balance between viral spread and host immune control mechanisms. Our data indicate that the use of immunosuppressive drugs such as CsA in HTLV-1–infected subjects should be approached with caution, especially during organ or bone marrow transplantation. In these scenarios, virus expression may be enhanced, leading to earlier onset of disease. Conversely, blocking lymphocyte activation in target cells during the early phase of HTLV-1 spread provides the opportunity for blocking the infection after exposure and offers hope for therapeutic invention. In future studies, it will be important to also test early viral expression parameters in the immune suppression in animals exposed by mucosal routes of infection. In addition, future studies are needed to address multiple therapeutic protocols using combinational drug treatments to achieve immune suppression.
The publication costs of this article were defrayed in part by page charge payment. Therefore, and solely to indicate this fact, this article is hereby marked “advertisement” in accordance with 18 USC section 1734.
Acknowledgments
We thank Drs P. Green, L. Ratner, and K. Boris-Lawrie for comments, and T. Vojt for figures and manuscript preparation.
This work was supported by National Institutes of Health Career Development Award K01 RR 023965 (B.Z.) and National Cancer Institute Program Grant P01CA100730 (M.D.L.).
National Institutes of Health
Authorship
Contribution: RA.H.H. performed experimental design, executed experiments, and wrote the manuscript; E.W., A.J.P., C.P., and B.Z. executed experiments, collected data, and assisted in manuscript edits and manuscript preparation; L.Y. provided biostatistical design and analysis and assisted in manuscript edits and manuscript preparation; and M.D.L. provided funding, laboratory support, and experimental design, and helped write the manuscript.
Conflict-of-interest disclosure: The authors declare no competing financial interests.
Correspondence: Michael D. Lairmore, Ohio State University, Department of Veterinary Biosciences, Goss Laboratory, 1925 Coffey Rd, Columbus, OH 43210-1093; e-mail: Lairmore.1@osu.edu.

This feature is available to Subscribers Only
Sign In or Create an Account Close Modal