

Abstract
In chronic-phase chronic myeloid leukemia (CML) patients, the lack of a major cytogenetic response (< 36% Ph+ metaphases) to imatinib within 12 months indicates failure and mandates a change of therapy. To identify biomarkers predictive of imatinib failure, we performed gene expression array profiling of CD34+ cells from 2 independent cohorts of imatinib-naive chronic-phase CML patients. The learning set consisted of retrospectively selected patients with a complete cytogenetic response or more than 65% Ph+ metaphases within 12 months of imatinib therapy. Based on analysis of variance P less than .1 and fold difference 1.5 or more, we identified 885 probe sets with differential expression between responders and nonresponders, from which we extracted a 75-probe set minimal signature (classifier) that separated the 2 groups. On application to a prospectively accrued validation set, the classifier correctly predicted 88% of responders and 83% of nonresponders. Bioinformatics analysis and comparison with published studies revealed overlap of classifier genes with CML progression signatures and implicated β-catenin in their regulation, suggesting that chronic-phase CML patients destined to fail imatinib have more advanced disease than evident by morphologic criteria. Our classifier may allow directing more aggressive therapy upfront to the patients most likely to benefit while sparing good-risk patients from unnecessary toxicity.
Introduction
Imatinib is an effective therapy for the majority of patients with chronic-phase chronic myeloid leukemia (CML). However, approximately 20% to 30% of patients fail imatinib and require alternative treatments.1,2 The cytogenetic response at 12 months is a powerful prognosticator of outcome. In a large trial of patients treated with standard-dose imatinib (400 mg daily), the projected rates of event-free survival were 97% and 93%, respectively, for patients who had attained a complete cytogenetic response (CCyR, 0% Philadelphia chromosome-positive [Ph+] metaphases) or major cytogenetic response (MCyR, < 36% Ph+ metaphases), but only 81% in patients with less than MCyR at 12 months.1 In view of the high risk of progression, an expert panel convened by the European Leukemia Net has concluded that lack of MCyR at 12 months (herein referred to as primary cytogenetic resistance) defines imatinib failure and warrants a change in the therapeutic strategy.3
More intensive therapy upfront has been proposed to improve the rates of MCyR.4 Because most patients will do well on standard therapy, it would be desirable to direct early treatment intensification to high-risk patients. The best clinical predictor of primary cytogenetic resistance is the Sokal risk score.5 In the International Randomized Interferon versus STI571 (IRIS) study, the projected rate of CCyR at 48 months was only 69% of patients with a high Sokal risk compared with 91% with low risk and 84% with intermediate risk.6 However, for clinical decisions, a more reliable prognosticator is needed. Based on the promising results of gene expression profiling for response prediction in various hematologic malignancies,7-11 we had previously attempted to predict MCyR by microarray analysis of unselected blood or bone marrow white cells collected before therapy but found no significant differences between responders and nonresponders.12 This led us to hypothesize that detecting a signature associated with primary cytogenetic resistance might require analyzing a more primitive cell compartment. We therefore performed gene expression profiling on CD34+ cells collected before imatinib therapy from 2 independent groups of chronic-phase CML patients, an initial training set of late chronic-phase patients, and a prospectively accrued validation set of newly diagnosed chronic-phase patients. Here we report the identification of a gene classifier of CD34+ CML cells that predicts MCyR with high accuracy.
Methods
Patients
The training set was retrospectively selected from CML patients treated at Oregon Health & Science University between 1998 and 2004. Most of the patients had failed prior interferon-α–based therapy and were treated on phase 2 studies of imatinib before its regulatory approval. Eligibility criteria were a diagnosis of CML in chronic phase (based on the criteria of the IRIS trial), availability of bone marrow mononuclear cells (MNCs) stored immediately before initiating imatinib therapy, and availability of at least 1 year of follow-up, including karyotyping. Responders were defined as those patients with at least a partial cytogenetic response within 12 months of therapy and nonresponders as all other patients. Because this response definition is inherently imprecise given the routine sampling of only 20 metaphases and may therefore misclassify responses, the training set focused on patients with CCyR during their first year of imatinib therapy as opposed to patients who had not achieved even a minor cytogenetic response (ie, remained at least 66% Ph+) during that time, thereby reducing noise by enriching the training set for the extremes of the response spectrum. Of 51 samples initially processed, 36 were included in the final analysis, whereas the remainder was excluded because they failed to meet the minimum quality requirements for microarray analysis (see “RNA extraction and gene expression profiling”). The second group of patients (validation set) consisted of 42 consecutive newly diagnosed chronic-phase patients treated with imatinib at the University of Newcastle (United Kingdom) or University of Leipzig (Germany). In 23 of these patients, the microarray analysis was successful. The majority of these patients were followed with metaphase karyotyping; however, response was assessed by fluorescence in situ hybridization in 7 of 17 responders and 2 of 6 nonresponders. In these patients, CD34+ cells were selected from peripheral blood collected at diagnosis. The study was approved by the institutional review board of all participating institutions, and all subjects provided written informed consent in accordance with the Declaration of Helsinki.
Isolation of CD34+ cells
In the case of the training set, MNCs were purified from bone marrow by density gradient centrifugation and cryopreserved in liquid nitrogen. Immediately before CD34+ cell selection, the cells were thawed at 37°C and washed in Dulbecco phosphate-buffered saline containing 0.1% human albumin (Baxter Healthcare Corporation), 1% recombinant DNase (Pulmozyme; Genentech), and 2.5mM MgCl2. The samples were enriched for viable cells using the Dead Cell Removal Kit (Miltenyi Biotec). Next, the cells were resuspended in Hank's balanced salt solution with 0.5% fetal bovine serum, 2% N-2-hydroxyethylpiperazine-N′-2-ethanesulfonic acid, and 1% recombinant human DNase (Genentech), stained with CD34-fluorescein isothiocyanate (FITC) and CD45-peridinin chlorophyll protein (PerCP)–Cy5.5 monoclonal antibodies (BD Biosciences), and placed in Hanks balanced salt solution containing 0.5% fetal bovine serum, 2% N-2-hydroxyethylpiperazine-N′-2-ethanesulfonic acid, and 1% recombinant human DNase. For the identification of dead cells, propidium iodide (Roche Diagnostics) was added to the cell solution immediately before sorting.
A BD FACSAria (BD Biosciences) was used to sort CD34+ cells. Gates on forward scatter (FSC) and side scatter, followed by FSC-width (FSC-W) and FSC-height (FSC-H), were used to exclude dead cells and debris. Next, gates were set on propidium iodide-negative cells to ensure that only viable cells were selected. Finally, on the CD34-FITC and CD45-PerCP-Cy5.5 histogram, CD45-PerCP-Cy5.5 dim cells that brightly coexpressed CD34-FITC were selected. The procedure was regarded as a success if greater than 1000 CD34+ cells were isolated, with a purity of greater than 80% CD34+ cells by flow cytometry. An example of the sorting strategy is shown in supplemental Figure 1 (available on the Blood website; see the Supplemental Materials link at the top of the online article). After sorting, CD34+ cells were placed in PicoPure extraction buffer (Arcturus) and stored at −80°C until processed further. Small aliquots of CD34+ cells were also stored for fluorescence in situ hybridization (FISH) to assess the proportion of BCR-ABL+ cells. In the case of the validation set, MNCs were isolated from peripheral blood using density gradient centrifugation. CD34+ cells were isolated from the MNC using MiniMACS columns (Miltenyi Biotec), following the instructions of the manufacturer.
RNA extraction and gene expression profiling
RNA extraction was performed with the PicoPure RNA Isolation Kit (Arcturus) once all cell sorting had been completed. Samples were quantified using the NanoDrop ND-1000 UV-Vis spectrophotometer (NanoDrop Technologies), and the quality of the RNA was assessed using the Agilent 2100 Bioanalyzer (Agilent Technologies). Only samples with electropherograms showing a size distribution pattern predictive of acceptable microarray assay performance were processed further. Details of the quality assessment procedure will be reported elsewhere (K.A.V., H. Paik, C. Runyon, B. Tompkins, L. Crossman, M.W.N.D., C.A.H. Factors influencing the optimization and standardization of the Affymetrix GeneChip expression assay small sample amplification protocol in the microarray core laboratory (poster). Annual Meeting of the Association of Biomolecular Resource Facilities, February 2005). To generate sufficient cRNA target for microarray hybridization, we used the GeneChip Eukaryotic Small Sample Target Labeling Assay Version ll (Affymetrix), with inputs from 5 to 20 ng of total RNA. Control experiments in the microarray core laboratory demonstrated high-quality microarray data from inputs as low as 5 ng (C.A.H., personal communication). After successful amplification, 10 μg of labeled target cRNA was hybridized to HG-U133 Plus 2.0 GeneChip arrays (Affymetrix). Arrays were scanned using a laser confocal scanner (Agilent Technologies), and the image processing and expression analysis were performed using Affymetrix GCOS, Version 1.2 software. For quality assurance/quality control purposes, the parameters α1 and α2 were set to 0.05 and 0.065 (Affymetrix defaults), respectively. These parameters set the point at which a probe set was called present (P), marginal (M), or absent (A). Minimal quality control parameters for inclusion in the study included P more than 30%, average signal in keeping with the average signal of other samples within that hybridization group (ie, the group of samples hybridized as a batch), and a GAPDH 3′/5′ ratio of less than or equal to 3.62. Overall, the process of CD34+ cell selection, RNA extraction, and array hybridization was successful in 36 of 51 patients (71%). The average present call rate in this group was 41.5% (range, 38.8%-47.1%). FISH for BCR-ABL was successful in 28 of the 36 samples. The median percentage of BCR-ABL+ CD34+ cells was found to be 98.5% (range, 33%-100%). The 23 samples of the validation set were processed in an identical fashion approximately 18 months after the training set. For consistency, similar amounts of input RNA were used.
Standard statistical methods
Differences in the distribution of patient demographics/treatment history were examined by categorical data analysis in the training set using the SPSS software package.
Microarray data analysis
Low-level analysis of the Affymetrix data was conducted using the Robust Multiarray Average (RMA) algorithm.13 Only Perfect Match intensities were used. Parameters for RMA included model-based background correction, quantile normalization, and median polish. Transcript-by-transcript (ie, unique Affymetrix Probe set IDs) analysis of variance to determine differential expression between NR and R was performed on the training set (N = 36). All P values were false discovery rate adjusted. With respect to feature, selection was based on effect size (fold change [FC] ≥ 1.5) and statistical significance (P < .1) to minimize false negatives. Data were further filtered based on threshold expression level and variability (based on coefficient of variation). Class prediction was performed using the nearest shrunken centroids algorithm.14 Testing of the classifier was performed on an independent, blinded validation set (N = 23). The raw (cel) and normalized data were deposited in National Center for Biotechnology Information gene ontology (GO) database (GSE14671).
Structural analysis of the classifier
With regard to downstream analysis of the classifier, overrepresented GO and pathway annotations were identified in the classifier transcripts using categorical data analysis (with adjustment for the nested multiple comparisons). Known protein-protein interactions were examined for classifier members as well as with other genes using the Metacore database. In addition to examining functional enrichment, potential sub-networks (or “small networks”) in the classifier were examined using known and curated protein-protein interactions from the MetaCore database. These sub-networks were ranked based on statistical significance and the number of known biologic pathways found in the sub-network. The P values are based on a hypergeometric distribution in which the P value essentially represents the probability of particular mapping arising by chance, given the numbers of genes in the set of all genes on maps/networks/processes, genes on a particular map/network/process, and genes in the experiment. This is formally defined as:

where N = total number of nodes in MetaCore database, R = number of the network's objects corresponding to the genes and proteins in your list, n = total number of nodes in each small network generated from your list, and r = number of nodes with data in each small network generated from your list.15
Meta-analysis
CEL files for the Yong et al paper21 were provided by the authors. The data were analyzed similarly to that of the training set (RMA normalization, 1-way analysis of variance). Reported fold changes and P values for the Zheng et al dataset16 were downloaded from the journal website. Overlap was calculated based on the number of shared putative differentially expressed genes. Simulations in the statistical computing environment R were performed to determine the number of overlapping features (0) expected to be shared among 2 candidate lists of different lengths (n1, n2) both sampled from the same array (with N features). Statistical significance was determined by comparing the observed value with the distribution generated from 10 000 simulations performed for a given configuration (n1, n2, N). Standard analysis tools were applied to patient characteristics. Low-level analysis of the Affymetrix data was conducted using the RMA algorithm.13 Transcript-by-transcript analysis of variance to determine differential expression between nonresponders and responders was performed on the training set. Testing of the classifier was performed on the independent, blinded validation set. With regard to downstream analysis of the classifier, overrepresented GO and pathway annotations were identified in the classifier transcripts using categorical data analysis. Known protein-protein interactions were examined for classifier members as well as with other genes using the Metacore database.
Results
Baseline characteristics of the training set
Overall, the process of CD34+ cell selection, RNA extraction, and array hybridization was successful in 36 of 51 patients (71%), among them 24 nonresponders and 12 responders. Nineteen samples failed at one of the quality control steps during sample processing. FISH for BCR-ABL was successful in 28 of 36 patients (78%) and revealed between a small but statistically significant difference between nonresponders and responders (median of 100% vs 98.5%, P = .01). Compared with responders, nonresponders tended to be older (P = .048) and had a longer interval between diagnosis and imatinib start (P = .037), but there were no other significant differences (Table 1).
Clinical characteristics of the training set
| Characteristic | Value | P |
|---|---|---|
| Male sex, no. (%) | ||
| Responders | 15 (63) | 1.00 |
| Nonresponders | 7 (58) | |
| Median age at diagnosis, y (range) | ||
| Responders | 51 (28-76) | .048 |
| Nonresponders | 61 (24-71) | |
| Hemoglobin, g/dL | ||
| Responders | 13.1 (10.0-16.3) | .575 |
| Nonresponders | 12.5 (10.3-15.8) | |
| White cell count, ×103/L | ||
| Responders | 12.0 (2.5-70.8) | .373 |
| Nonresponders | 17.8 (4.7-116) | |
| Platelet count, ×103/L | ||
| Responders | 265.5 (19-935) | .098 |
| Nonresponders | 350 (99-1372) | |
| Peripheral blood basophil count, % | ||
| Responders | 4 (0-31) | .938 |
| Nonresponders | 6 (0-16) | |
| Peripheral blood eosinophil count, % | ||
| Responders | 1 (0-8) | .441 |
| Nonresponders | 2 (0-3) | |
| Peripheral blood blast count, % | ||
| Responders | 0 (0-11) | .657 |
| Nonresponders | 0 (0-5) | |
| Bone marrow blast count, % | ||
| Responders | 1 (0-13) | .234 |
| Nonresponders | 3 (0-18) | |
| Spleen size, cm below costal margin | ||
| Responders | 0 (0-11) | .806 |
| Nonresponders | 0 (0-10) | |
| Chronic phase with CE* | ||
| Responders | 6 (26) | .874 |
| Nonresponders | 3 (27) | |
| Deletion of derived chromosome 9, no. (%) | ||
| Responders | 2 (8) | .717 |
| Nonresponders | 1 (8) | |
| Prior hydroxyurea therapy | ||
| Responders | 20 (83) | .180 |
| Nonresponders | 12 (100) | |
| Prior interferon-α therapy | ||
| Responders | 19 (79) | .113 |
| Nonresponders | 12 (100) | |
| Other prior therapy | ||
| Responders | 7 (29) | .092 |
| Nonresponders | 7 (58) | |
| Initial imatinib dose 600 mg daily, no. (%)† | ||
| Responders | 10 (43) | .255 |
| Nonresponders | 3 (25) | |
| Time from diagnosis to imatinib therapy, d | ||
| Responders | 928 | .037 |
| Nonresponders | 1812 |
CE indicates clonal cytogenetic evolution.
Two patients (1 responder and 1 nonresponder) were subsequently found to fulfill the criteria for accelerated phase (platelet count < 100/nL unrelated to therapy, and basophils in the blood > 20%).
Patients with CE were classified as in accelerated phase in the phase 2 imatinib studies (but not in the IRIS study) and therefore treated with an initial dose of 600 mg imatinib daily.
Construction of the response classifier
To determine whether the gene expression profiles of CD34+ cells from prospective cytogenetic responders and nonresponders are different, we performed unsupervised hierarchical cluster analysis. We found partial and statistically significant separation between responders and nonresponders (P = .024; Figure 1). Univariate analysis of the training set identified 885 differentially expressed transcripts based on minimal effect size (FC > 1.5 and P < .1; supplemental Table 1). The prediction analysis for microarray algorithm was then applied to the training set, and classification accuracy was determined via cross-validation. Cross-validation was used to choose an optimum gene number (threshold), which minimized classification errors and resulted in a 75-transcript predictor (Table 2). Fifty of these transcripts were up-regulated and 25 were down-regulated in nonresponders versus responders.

Unsupervised cluster analysis was performed on the training set (N = 36). Patients who subsequently achieved CCyR partially separated from patients with more than 65% Ph+ metaphases after 12 months of imatinib therapy.
Unsupervised cluster analysis was performed on the training set (N = 36). Patients who subsequently achieved CCyR partially separated from patients with more than 65% Ph+ metaphases after 12 months of imatinib therapy.
Probe sets (transcripts) of the minimal response classifier
| Probe set | Gene symbol | Training set fold change | Training P | Test set fold change | β-Catenin target by SACO |
|---|---|---|---|---|---|
| 225688_s_at | PHLDB2 | 4.197 | .009 | 1.646 | Yes |
| 205848_at | GAS2 | 3.400 | .021 | 2.115 | No |
| 219454_at | EGFL6 | 3.302 | .010 | 1.853 | No |
| 238206_at | — | 2.829 | .011 | 2.290 | No |
| 205612_at | MMRN1 | 2.412 | .012 | 1.862 | Yes |
| 229963_at | NGFRAP1L1 | 2.410 | .038 | 1.802 | No |
| 235342_at | SPOCK3 | 2.337 | .042 | 2.515 | Yes |
| 226003_at | KIF21A | 2.287 | .034 | 1.672 | No |
| 230791_at | — | 2.224 | .021 | 1.551 | No |
| 205609_at | ANGPT1 | 2.129 | .028 | 1.732 | No |
| 223503_at | TMEM163 | 2.098 | .010 | 1.594 | Yes |
| 222885_at | EMCN | 2.095 | .021 | 1.765 | Yes |
| 227314_at | ITGA2 | 2.086 | .004 | 1.489 | Yes |
| 226425_at | CLIP4 | 2.084 | .005 | 1.474 | Yes |
| 205637_s_at | SH3GL3 | 2.013 | .041 | 1.972 | Yes |
| 1562403_a_at | SLC8A3 | 1.979 | .003 | 1.725 | Yes |
| 228396_at | — | 1.940 | .055 | 2.240 | No |
| 228027_at | GPRASP2 | 1.938 | .044 | 1.664 | No |
| 202112_at | VWF | 1.927 | .078 | 3.179 | Yes |
| 1554007_at | — | 1.918 | .011 | 1.562 | No |
| 223669_at | HEMGN | 1.881 | .034 | 1.483 | Yes |
| 229654_at | ZNF44 | 1.875 | .001 | 1.458 | Yes |
| 204069_at | MEIS1 | 1.871 | .003 | 1.360 | Yes |
| 205518_s_at | CMAH | 1.842 | .005 | 1.553 | No |
| 221802_s_at | KIAA1598 | 1.840 | .073 | 2.099 | Yes |
| 1556136_at | RP11–145H9.1 | 1.837 | .011 | 1.607 | Yes |
| 209488_s_at | RBPMS | 1.836 | .061 | 1.855 | Yes |
| 228195_at | MGC13057 | 1.820 | .023 | 1.702 | Yes |
| 213029_at | NFIB | 1.806 | .014 | 1.865 | Yes |
| 203404_at | ARMCX2 | 1.792 | .045 | 1.467 | No |
| 226189_at | ITGB8 | 1.779 | .014 | 1.390 | Yes |
| 209290_s_at | NFIB | 1.746 | .091 | 2.390 | Yes |
| 1552626_a_at | TMEM163 | 1.742 | .015 | 1.442 | Yes |
| 230698_at | — | 1.741 | .064 | 1.678 | No |
| 213306_at | MPDZ | 1.737 | .075 | 1.704 | No |
| 230518_at | EVA1 | 1.711 | .009 | 1.478 | No |
| 207836_s_at | RBPMS | 1.708 | .064 | 1.507 | Yes |
| 210102_at | LOH11CR2A | 1.702 | .034 | 1.487 | Yes |
| 227417_at | MOSC2 | 1.691 | .082 | 1.519 | Yes |
| 204523_at | ZNF140 | 1.688 | .003 | 1.543 | No |
| 230291_s_at | NFIB | 1.672 | .070 | 1.994 | Yes |
| 209459_s_at | ABAT | 1.657 | .036 | 1.504 | Yes |
| 228805_at | C5orf25 | 1.637 | .008 | 1.564 | No |
| 227875_at | KLHL13 | 1.632 | .063 | 1.594 | Yes |
| 217109_at | MUC4 | 1.630 | .084 | 1.482 | Yes |
| 203786_s_at | TPD52L1 | 1.627 | .062 | 1.954 | Yes |
| 205079_s_at | MPDZ | 1.627 | .086 | 1.367 | No |
| 201150_s_at | TIMP3 | 1.616 | .055 | 1.826 | Yes |
| 235227_at | — | 1.609 | .009 | 1.736 | No |
| 242919_at | ZNF253 | 1.602 | .020 | 1.476 | No |
| 212501_at | CEBPB | 0.598 | .037 | 0.459 | No |
| 219505_at | CECR1 | 0.587 | .058 | 0.425 | Yes |
| 202208_s_at | ARL4C | 0.580 | .007 | 0.554 | No |
| 222496_s_at | FLJ20273 | 0.579 | .048 | 0.516 | Yes |
| 202912_at | ADM | 0.549 | .095 | 0.381 | Yes |
| 242397_at | — | 0.549 | .001 | 0.658 | No |
| 205896_at | SLC22A4 | 0.541 | .004 | 0.579 | Yes |
| 1569263_at | — | 0.537 | .010 | 0.445 | No |
| 203234_at | UPP1 | 0.535 | .015 | 0.478 | Yes |
| 200872_at | S100A10 | 0.531 | .004 | 0.611 | Yes |
| 218589_at | P2RY5 | 0.515 | .092 | 0.532 | No |
| 201422_at | IFI30 | 0.494 | .037 | 0.440 | No |
| 221840_at | PTPRE | 0.491 | .025 | 0.386 | Yes |
| 221698_s_at | CLEC7A | 0.480 | .071 | 0.434 | No |
| 211429_s_at | SERPINA1 | 0.446 | .036 | 0.335 | Yes |
| 205653_at | CTSG | 0.445 | .027 | 0.421 | No |
| 202833_s_at | SERPINA1 | 0.441 | .062 | 0.270 | Yes |
| 230748_at | SLC16A6 | 0.439 | .092 | 0.514 | Yes |
| 222670_s_at | MAFB | 0.432 | .020 | 0.567 | No |
| 203948_s_at | MPO | 0.423 | .052 | 0.551 | Yes |
| 202207_at | ARL4C | 0.423 | .072 | 0.319 | No |
| 218454_at | FLJ22662 | 0.405 | .041 | 0.324 | No |
| 204971_at | CSTA | 0.397 | .042 | 0.464 | No |
| 210254_at | MS4A3 | 0.334 | .024 | 0.376 | No |
| 205237_at | FCN1 | 0.324 | .021 | 0.333 | No |
SACO indicates sequential analysis of chromatin occupancy; and —, not available.
Validation of the response classifier in an independent test sample
For validation, we prospectively collected CD34+ cells from 42 newly diagnosed chronic-phase patients before starting imatinib. Twenty-three samples (55%) passed all the quality control steps and were included in the analysis. Seventeen of these patients (74%) achieved CCyR within 12 months (Table 3), in keeping with the results of the IRIS study.17 Microarray analysis was carried out using the same protocol as for the training set. As with the training set, we first performed unsupervised cluster analysis using the 75-probe set classifier. Responders were readily separated from nonresponders (Figure 2). Next, we applied the prediction algorithm to the validation set. Correct predictions were made in 15 of 17 responders and 5 of 6 nonresponders, for an estimated accuracy rate of 86.9% (Table 3).


Unsupervised cluster analysis of the validation set (N = 23), using the minimal list of 75 probe sets derived from the training set. Nonresponders and responders are separated. Sokal scores are indicated for comparison.
Unsupervised cluster analysis of the validation set (N = 23), using the minimal list of 75 probe sets derived from the training set. Nonresponders and responders are separated. Sokal scores are indicated for comparison.
Comparison with Sokal scores
Patients with a high Sokal score (> 1.2) have a lower probability of achieving CCyR. We therefore examined the relation between the Sokal score of the patients in the validation set and their classification by gene array. All 10 patients with a low Sokal score (≤ 0.8), 7 of 11 patients with an intermediate Sokal score (> 0.8; ≤ 1.2), and 0 of 2 patients with a high Sokal score (> 1.2) were classified as responders (Table 3). To compare the ability of the Sokal score and the classifier to predict cytogenetic response, we assumed that patients with a high Sokal risk would be nonresponders, whereas patients with a low or intermediate risk would be responders. For 16 of the 23 subjects, both Sokal score and classifier correctly predicted response. In 2 patients, classifier and Sokal score made identical but incorrect predictions: patient V21 (Sokal score 1.5) was misclassified as a nonresponder and patient V5 (Sokal score 0.6) was misclassified as a responder. Risk prediction for the remaining 5 subjects was discordant between classifier and Sokal score. The classifier correctly identified 4 patents as nonresponders (V3, V15, V16, and V20) whose Sokal scores (1.1, 1.2, 0.7, and 1.0, respectively) predicted response, whereas 1 responder (V12, Sokal risk 0.9) was misclassified as a nonresponder. Thus, the classifier correctly identified 5 of 6 nonresponders, compared with 1 of 6 based on Sokal criteria.
Functional structure of the classifier
To gain insight into mechanisms underlying primary cytogenetic resistance and develop an understanding of structure and regulation of the classifier genes, we applied bioinformatics tools to identify potential regulatory networks, focusing on the minimal classifier.
GO analysis revealed overrepresentation of several functional groups (Table 4). Genes related to ligand/receptor binding are significantly overrepresented (false discovery rate adjusted P < .003), including S100A10, ADM, CLEC7A, CECR1, FCN1, and ANGPT1. Five of these transcripts were down-regulated and 4 (VWF, ANGPT1, EGFL6, and MUC4) were up-regulated in nonresponders compared with responders. A second group with significant overrepresentation is transcripts involved in cell adhesion (P < .001). All 6 transcripts in this group (MMRN1, ITGA2, VWF, ITGB8, EVA1, and MUC4) were up-regulated in nonresponders. A third cluster of transcripts with significant overrepresentation (P < .02) is related to transcriptional regulation. Seven of these transcripts were up-regulated (ZNF44, MEIS1, NFIB [3 different transcripts], ZNF140, and ZNF253) and 2 down-regulated (CEBPB and MAFB) in nonresponders.
Functional Gene Ontology enrichment in classifier genes
| Classification | Description | Genes | P |
|---|---|---|---|
| MF | Receptor binding | CECR1, FCN1, ADM, ANGPT1, S100A10, VWF, CLEC7A, MUC4, EGFL6 | .003 |
| MF | Collagen binding | VWF, ITGA2 | .037 |
| BP | Cell adhesion | MMRN1, ITGA2, VWF, ITGB8, EVA1, MUC4 | .001 |
| BP | Transcriptional regulation | ZNF44, MEIS1, NFIB, CEBPB, MAFB, ZNF140, ZNF253 | .020 |
MF indicates molecular function; and BP, biologic process.
Pathway analysis
To identify regulatory networks, we examined potential protein-protein interactions among the members of the classifier, using the MetaCore database. Analysis of protein-protein interaction data identified a highly significant interaction sub-network (P < 4.85−36), which included 2 ANGPT1 signaling-related pathways (both part of MetaCore Curated Map 532). The key classifier node that linked both of these pathways was ANGPT1, which had direct interactions with other key angiogenesis proteins in the sub-network, such as TIE2 (Figure 3). GO analysis within the ANGPT1 sub-network showed a highly significant overrepresentation (P < 4.20−07) of proteins associated with transmembrane receptor protein tyrosine kinase signaling (GO, 0007169). This annotation represents the series of molecular signals generated as a consequence of a transmembrane receptor tyrosine kinase binding their cognate ligands. The majority of the members with this GO annotation were also members of the ANGPT1-related pathways (Figure 3). These data suggest that activation of tyrosine kinases through receptor binding and increased angiogenesis may contribute to primary cytogenetic resistance.

The Metacore database was used to analyze protein-protein interactions among the members of the classifier and identified a highly significant interaction sub-network (P < 4.85−36), which included 2 ANGPT1 signaling-related pathways (both part of MetaCore Curated Map 532). The key classifier node that linked both of these pathways was ANGPT1. Red circles represent genes up-regulated in nonresponders.
The Metacore database was used to analyze protein-protein interactions among the members of the classifier and identified a highly significant interaction sub-network (P < 4.85−36), which included 2 ANGPT1 signaling-related pathways (both part of MetaCore Curated Map 532). The key classifier node that linked both of these pathways was ANGPT1. Red circles represent genes up-regulated in nonresponders.
Involvement of β-catenin in the regulation of classifier genes
The rate of MCyR is highest in the chronic phase and lowest in blast crisis.18 Because activation of Wnt/β-catenin signaling in granulocyte/macrophage progenitor cells has been reported in cells from patients with blast crisis,19 we reasoned that genes associated with failure to achieve MCyR may be regulated by β-catenin, reflecting an advanced-disease stage that is not yet visible morphologically. To test this hypothesis, we used a library of β-catenin targets previously identified in our laboratory by serial analysis of chromatin occupation in a colon cancer cell line.20 We found a significant enrichment of potential β-catenin targets in the classifier list compared with the background distribution on the array (54.6% vs 40.7% on array, P = .01). Specifically, 62% of the up-regulated genes are β-catenin targets with TCF motifs either in the promoter or within the gene boundaries, suggesting that β-catenin activation in nonresponders may be an important driver of the gene expression signature associated with primary cytogenetic resistance.
Comparison with published signatures of CD34+ CML cells
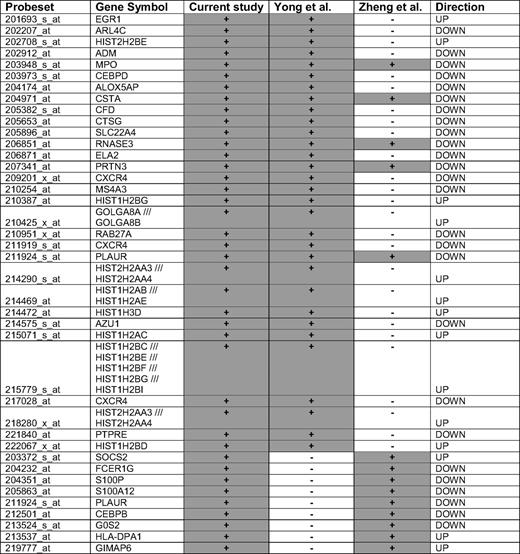
Two studies have reported expression signatures of CD34+ cells in relation to disease phase and duration of chronic phase in patients treated with nonimatinib therapy, respectively.16,21 To test whether primary cytogenetic resistance is partially a reflection of advanced disease, we analyzed the 885 response-related genes for overlap with the published lists. For both the Zheng et al16 (14 concordant transcripts, Figure 4A) and Yong et al21 (31 concordant transcripts, Figure 4B) data, there was a highly significant overlap with our list of 885 transcripts. Five genes (CSTA, RNASE3, PRTN3, PLAUR, and MPO, all down-regulated in nonresponders) overlapped between the 3 datasets (Table 5).

Meta-analysis to assess overlap between the 885 probe sets differentially expressed between responders and nonresponders in the training set, and 2 previously published datasets. The histograms represent the results of 10 000 simulations to determine the probability of seeing a concordance equal to or greater than what we observed. (A) Comparison with a gene profile of blastic versus chronic phase reported by Zheng et al.16 (B) Comparison with a gene profile of patients with short versus long duration of chronic phase on treatment with nonimatinib therapy reported by Yong et al.21
Meta-analysis to assess overlap between the 885 probe sets differentially expressed between responders and nonresponders in the training set, and 2 previously published datasets. The histograms represent the results of 10 000 simulations to determine the probability of seeing a concordance equal to or greater than what we observed. (A) Comparison with a gene profile of blastic versus chronic phase reported by Zheng et al.16 (B) Comparison with a gene profile of patients with short versus long duration of chronic phase on treatment with nonimatinib therapy reported by Yong et al.21
Discussion
CML patients with primary cytogenetic resistance, defined as the failure to achieve MCyR after 12 months on imatinib, have a high risk of subsequent disease progression.1 The etiology of primary cytogenetic resistance is poorly understood. BCR-ABL kinase domain mutations are uncommon, suggesting that the mechanisms are different from those of acquired resistance.22 Lack of compliance with the medication may also play a role and is impossible to exclude without unannounced drug level testing. Nonetheless, the strong predictive value of MCyR at 12 months has stimulated research to identify biomarkers to predict cytogenetic response upfront. Several studies have used expression arrays on pretherapeutic samples to identify signatures associated with cytogenetic response.12,23-26 These studies differ in the source of the RNA (whole blood, total white cells, MNCs) as well as the array and bioinformatics platforms used. Although all but one study reported the identification of a gene classifier predicting cytogenetic response, there is no overlap between the gene lists. Without independent control groups for validation, the reproducibility of these findings remains to be determined. In our own experience, applying stringent analysis criteria and an independent validation set, we found that the gene expression profiles of unselected white cells from responders and nonresponders were very similar.12 This is consistent with the observation that almost all chronic-phase patients achieve a complete hematologic response, suggesting that the bulk of the (differentiated) leukemia cells are sensitive to imatinib, irrespective of the subsequent cytogenetic response that occurs over the course of months. We therefore decided to analyze CD34+ cells as a more primitive cell population.
In a first set of experiments, we optimized the purification of CD34+ cells from cryopreserved MNCs as well as the subsequent steps of RNA extraction, amplification, and hybridization, using several stringent quality control steps. Whereas the numbers of CD34+ cells separated were usually small (on average 104, representing only 0.1% of the MNCs cryopreserved initially), their purity and viability were high and more than 70% of samples were successfully hybridized to microarrays. To increase the likelihood of detecting a resistance signature, we polarized the training sample by selecting patients from the extremes of the cytogenetic response spectrum seen with imatinib. As a first indication of a difference between responders and nonresponders, unsupervised hierachical clustering showed partial separation of the 2 groups, in contrast to our previous observation with unseparated white cells.12 Using the criteria of analysis of variance P value of less than .1 and fold difference 1.5 or more, we found differential expression of 885 probe sets, from which we extracted a minimal list of 75 transcripts that optimally separated responders and nonresponders. On unsupervised clustering, this minimal probe set completely separated responders and nonresponders in a prospectively accrued validation cohort of newly diagnosed patients treated with imatinib. Moreover, the classifier correctly predicted MCyR at 12 months in 20 of 23 patients. Importantly, 5 of 6 nonresponders were identified correctly, whereas only 1 of 6 would have been predicted based on high Sokal score (P = .11), suggesting that the gene classifier may be useful for identification of prospective nonresponders irrespective of their Sokal risk. The fact that the minimal classifier predicted response in 2 diverse groups of patients (the training set of late chronic phase and the validation set of newly diagnosed patients) and although bone marrow was used in the training and blood in the validation set suggests that the gene list identified biologic factors that govern the response to imatinib. In addition, this bioinformatics analysis revealed that classifier genes may contribute to primary cytogenetic resistance by affecting diverse cellular functions. Genes associated with adhesion were consistently up-regulated in nonresponders, suggesting that these cells may have an increased ability to interact with the bone marrow microenvironment to derive BCR-ABL–independent survival signals, consistent with recent reports that microenvironmental factors contribute to CML cell survival in the presence of BCR-ABL inhibitors.27 Up-regulation of ANGPT1, the ligand of Tie2, in nonresponders points to activated angiogenesis and is consistent with the observation that high microvessel density is an adverse prognostic feature in CML.28 Indeed, pathway analysis using MetaCore suggests that ANGPT1 may be a critical node in a network that involves protein tyrosine kinase signaling from transmembrane receptors. Last, there are 3 transmembrane carriers in the classifier, 2 of which (SCL22A4, also known as OCTN and SLC16A6) are expressed at lower and 1 (SCL8A3) are expressed at higher levels in nonresponders. Given that low activity or expression of OCT1, a member of the same family of carriers as SCL22A4 (also known as OCTN1), predicts a lower likelihood of achieving a major cytogenetic or major molecular response,29-32 we have performed functional studies to assess whether OCTN1 may be a carrier of imatinib. However, we have not found evidence for this (supplemental Figure 3). The potential role of the other 2 carriers remains to be determined. On the other hand, expression of OCT1 was below background in our study. The reason for our failure to detect an association between OCT1 expression in CD34+ cells and response is not immediately obvious, given that we and others previously described a correlation between high OCT1 levels in MNCs and subsequent MCyR.30,31 One possibility is that the probe set on the microarray fails to detect splice variants specific to CD34+ cells. In addition, it has become clear that the role of drug transporters for imatinib response is complex. For example, certain MDR1 polymorphisms are correlated with cytogenetic response to imatinib, although inhibition of P-glycoprotein in CD34+ CML cells does not sensitize them to the drug.33,34
A comparison with published data revealed that a subset of the genes contained in the minimal list have previously been associated with prognosis and disease stage in CML. For example, low expression of myeloperoxidase and cathepsin G, both reduced in nonresponders, was previously shown to predict for a short duration of chronic phase in patients treated with conventional nonimatinib therapy.21 Down-regulation of CEBPB and up-regulation of GAS2 and ANGPT1 have been shown in CML blast crisis compared with chronic35,36 ; the identical regulation pattern is seen in nonresponders versus responders. These observations suggested that a subset of the genes associated with primary cytogenetic resistance may indeed reflect more advanced disease. We therefore performed meta-analysis using 2 previously published datasets on CD34+ CML cells.16,21 We found highly significant overlap with genes differentially expressed between patients with a short and long chronic phase on conventional nonimatinib therapy21 as well as a signature of blastic versus chronic phase.16 Thus, disease progression-related genes constitute an important component of the resistance signature. Because activation and nuclear translocation of β-catenin in granulocyte-macrophage progenitor cells have been shown to occur on progression from chronic phase to blast crisis,19 we compared the representation of β-catenin binding sequences between the classifier genes and the remaining array. Using a map of physical β-catenin targets,20 we found significant enrichment of β-catenin binding sites in the classifier genes. Preliminary studies in our laboratory have confirmed β-catenin binding for several of the predicted target genes (G.Y. and M.W.N.D., unpublished observations, 2009). Our data are consistent with a recent microarray study that found evidence for Wnt/β-catenin activation in advanced CML versus chronic phase, and reported that the profiles of second chronic phase bear much resemblance to the profiles of advanced CML.37 Thus, the emerging picture is that gene expression profiling allows for a more precise diagnosis of disease phase than morphologic criteria. Given the correlation between disease phase and cytogenetic response,38-40 it is perhaps not surprising that gene expression profiling is a better predictor of response than morphology, at least in the chronic phase. Conversely, it will be interesting to determine whether patients with advanced CML who achieve CCyR have expression profiles that resemble chronic phase. Although it remains to be determined how precisely the genes identified in our analysis contribute to cytogenetic resistance, one may speculate that they reflect the evolution of the disease toward BCR-ABL independence.41 Clearly, additional factors, such as drug transport proteins, probably play a role as well.31,32 Altogether, the meta-analysis suggests that chronic patients destined to primary cytogenetic resistance have more advanced disease than suggested by morphologic criteria.
In conclusion, we have identified a gene expression profile that predicts MCyR with a high degree of accuracy. To our knowledge, this is the first prospectively validated gene expression classifier of cytogenetic response to imatinib. The ability of the classifier to identify high-risk patients more accurately than the Sokal score may allow targeting more intensive therapy to the patients most likely to benefit.
The online version of this article contains a data supplement.
The publication costs of this article were defrayed in part by page charge payment. Therefore, and solely to indicate this fact, this article is hereby marked “advertisement” in accordance with 18 USC section 1734.
Acknowledgments
This work was supported in part by the National Heart, Lung, and Blood Institute (grant HL082978-01, M.W.N.D.; Consortium grant HL72321, C.A.H.), the Leukemia & Lymphoma Society (M.W.N.D.), and Oregon Health & Science University Microarray Program for National Heart, Lung, and Blood Institute Investigators (C.A.H.). M.W.N.D. is a Scholar in Clinical Research of the Leukemia & Lymphoma Society.
National Institutes of Health
Authorship
Contribution: S.K.M. and L.C.P. performed research and helped in writing the paper; M.M.L., K.V., S.G.W., G.Y., B.W., and C.A.H. performed research; Y.T. and R.P. helped with statistical analysis design; B.J.D. and S.G.O. performed patient care; J.L.S., M.M., and J.V.M. performed research; T.L. performed patient care; and M.W.N.D. designed the study and wrote the paper.
Conflict-of-interest disclosure: Oregon Health & Science University and B.J.D. have a financial interest in MolecularMD. Technology used in this research has been licensed to MolecularMD. This potential conflict of interest has been reviewed and managed by the Oregon Health & Science University Conflict of Interest in Research Committee and the Integrity Program Oversight Council. Oregon Health & Science University has clinical trial contracts with Novartis and Bristol-Myers Squibb to pay for patient costs, nurse and data manager salaries, and institutional overhead. B.J.D. does not derive salary nor does his laboratory receive funds from these contracts. Y.T. is employed by Lilly Singapore Center for Drug Discovery and Affymetrix Inc. R.P. is employed by Affymetrix Inc. M.W.N.D. is a consultant for Novartis and Bristol-Myers Squibb and was supported by Genzyme and Cytopia. The remaining authors declare no competing financial interests.
Correspondence: Michael W. Deininger, Oregon Health & Science University Knight Cancer Institute, 3181 SW Sam Jackson Park Rd, L592, Portland, OR 97239; e-mail: deininge@ohsu.edu.

This feature is available to Subscribers Only
Sign In or Create an Account Close Modal