

Scientists have traditionally studied complex biologic systems by reducing them to simple building blocks. Genome sequencing, high-throughput screening, and proteomics have, however, generated large datasets, revealing a high level of complexity in components and interactions. Systems biology embraces this complexity with a combination of mathematical, engineering, and computational tools for constructing and validating models of biologic phenomena. The validity of mathematical modeling in hematopoiesis was established early by the pioneering work of Till and McCulloch. In reviewing more recent papers, we highlight deterministic, stochastic, statistical, and network-based models that have been used to better understand a range of topics in hematopoiesis, including blood cell production, the periodicity of cyclical neutropenia, stem cell production in response to cytokine administration, and the emergence of imatinib resistance in chronic myeloid leukemia. Future advances require technologic improvements in computing power, imaging, and proteomics as well as greater collaboration between experimentalists and modelers. Altogether, systems biology will improve our understanding of normal and abnormal hematopoiesis, better define stem cells and their daughter cells, and potentially lead to more effective therapies.
Introduction
Despite advances made in identifying genes, epigenetic modifiers, lipids, proteins, and their posttranslational processing, much remains unknown about the precise roles these components play in health and disease. That biologic processes are complex and dynamic has been clearly established, albeit underappreciated.1 One obstacle to a more complete understanding is that reductionism dominates biologists' thinking. Reductionism states that a problem can be solved by decomposing it into building blocks and studying them one at a time.2 Large datasets of genes, lipids, metabolites, and proteins have made it impossible for one to intuit, reinforcing the appeal of reductionism. Yet, by breaking down a system one may lose properties that emerge only by virtue of the system's complexity. Systems biology approaches embrace this complexity, using engineering principles and computational methods to build and validate models using experimental data (Table 1).3 Using these and other approaches, systems biology seeks to explain and predict the complex properties underlying normal and abnormal physiology.
Framework for systems biology
| Framework |
|---|
|
| Framework |
|---|
|
Ideker et al.3
Biologic systems are multiscalar, functioning at the molecular, cellular, tissue, and organismismal levels. To perform their specialized functions, highly differentiated blood cells are continuously produced by stem cells. A combination of more than a dozen growth and stromal factors drive cells to divide asymmetrically, undergo differentiation, and carry out their end-cell functions. More than 10 000 genes are expressed in a B-cell lymphocyte.4 A simple erythrocyte, enucleated and without mitochondria, contains more than 750 proteins, ignoring posttranslational modifications.5 With at least a dozen types of highly specialized cells and platelets circulating in a liquid phase consisting of 1000 proteins,6 blood and its elements comprise a complex system. Inherently dynamic, the system must respond quickly to a variety of infectious, inflammatory, and metabolic conditions yet still preserve overall stability. While hematologists diagnose and treat patients with hemolytic anemias, phagocytic deficiencies, hypercoagulability, lymphoproliferative diseases, and myelodysplastic syndromes, it is astonishing that such high-level quality control of blood and its elements exists and that blood diseases are not more common.
We will introduce key concepts, terms, and models of systems biology (for a glossary, see Appendix at the end of the article) and discuss how systems biology is enhancing our understanding of the pathophysiology and treatment of blood disorders. More in-depth coverage may be found in the few textbooks of systems biology and bioinformatics that have appeared, none solely devoted to medical topics.7,,–10
Types of mathematical models
Many methods of modeling are available to more completely describe and predict biologic processes. Deterministic models describe the state of a system over time in the absence of random phenomena; such models always generate the same output for a given input.11 By contrast, stochastic models are used to understand the effects of randomness and noise on system output.12 Statistical models do not require in-depth knowledge of system structure and use existing data to estimate the functional relationship between system input and output. Network models describe the direction and magnitude of interactions that exist between the various components in a system.13
Deterministic models usually consist of 1 or more differential equations, with each equation describing the change in a system state variable over time, as it depends on other system variables and rates. If the state variable of interest is the number of cells in the population, a differential equation modeling the change in the population over time would consist of the difference between rates of cell production and rates of cell loss:

where NX is the number of cells of type X.
Each equation describes the rate of change in the number of cells of given type and maturity in the system by including terms for the rates of cell production, death, and differentiation. Once the equations are established they are solved either analytically or numerically to determine the population's functional dependence on time. In models describing physiologic conditions the equations tend toward a steady-state solution representing system homeostasis; that is, after sufficient time has elapsed, positive and negative contributions to cell number balance and the population attains a constant level (eg, dNX/dt = 0 in equation 1). For disease-state cell populations, other types of behavior such as oscillations, uncontrolled proliferation, or extinction are frequently modeled.
Stochastic models are used to examine the effects of intrinsic and extrinsic randomness on a system. Intrinsic randomness arises from interactions of a finite (“small”) number of discrete components, for example, binding of a given gene's promoters (2 copies per diploid genome) by transcription factor molecules (also a limited number). Extrinsic randomness arises either from variability (genetic and phenotypic) among cells or from environmental fluctuations. The most common type of stochastic model is a Markov process, in which the future state of the system depends only on its current state and is independent of its past states. Monte Carlo simulations are an empirical method to investigate dynamics of a stochastic system, by generating repeated random trajectories and computing frequencies that estimate probability distributions.
Statistical models are sometimes confused with stochastic models. Whereas stochastic models reflect the structure of the biologic system, statistical models are data-driven. Statistical models can be used even when no knowledge about a system's structure exists and can generate predictions, which may be only statistically validated. However, some statistical models such as Bayesian networks may provide insights concerning the structure. Bayesian network models are built from graphs in which the states of and relationships between network elements are probabilistic. While graph theoretical models can be circular, Bayesian networks have a definite, distinct set of termini. These models have a wide range of uses. For example, a Bayesian network model could be used to predict the probabilities of certain cellular mutations based on abnormalities in protein expression levels (assuming, of course, that there is a relationship between the two). Their structure and necessary constants have to be estimated based on data. Although popular, Bayesian networks suffer from the possible reversal of causality.14
Network models have recently gained popularity in the social, physical, and biologic sciences from the widespread application of graph theory, an area of mathematics that investigates the relationships between the objects of a group (an example is shown in Figure 1).16 Graph theory lends itself to visual representations making it an appealing tool for biologists investigating phenomena ranging from the interactions between populations in an ecosystem to the interactions between molecular species involved in a signaling pathway. At its simplest, a graph is a map of all known system components or system states and their possible interactions or transitions. Circles (nodes) represent components and states, and lines and arrows (branches or edges) represent relationships between nodes. Graphs help portray topologic structures such as loops (Figure 2). Complex dynamics can arise from relatively few interacting components,17 and network maps are widely used to help visualize the interactions. Building upon existing graph theoretical notation, an international group has developed Systems Biology Graphical Notation to standardize the visual representations used to describe biologic interaction networks.18

Graph of protein-protein interaction. (A) The network of the 1548 proteins of the yeast proteome and their interactions.15 Proteins with different functions are represented by different colors and include lipid metabolism (yellow), cell structure (green), membrane fusion(blue), chromatin structure(gray), and cytokinesis (red). (B) Because of node and edge density, a subset of the network is magnified to reveal the complexity of components and interactions. (Figure from Uetz et al15 reprinted with permission from Nature.)
Graph of protein-protein interaction. (A) The network of the 1548 proteins of the yeast proteome and their interactions.15 Proteins with different functions are represented by different colors and include lipid metabolism (yellow), cell structure (green), membrane fusion(blue), chromatin structure(gray), and cytokinesis (red). (B) Because of node and edge density, a subset of the network is magnified to reveal the complexity of components and interactions. (Figure from Uetz et al15 reprinted with permission from Nature.)

Feedback and feedforward loops in biologic systems. (A) Positive feedback loops result when (x) leads to the production of (y), which up-regulates the level of (x). (B) Negative feedback loops result when (x) leads to the production of (y) which down-regulates the level of (x). (C) Feed-forward loops are often found in biochemical or genetic regulatory networks. An example involves a general (x) and a specific (y) gene activator. The general activator sends an activation signal to the target gene (z) and the specific activator (y). If the signal is sustained, (y) becomes activated, permitting it to reinforce an activation signal for (z), completing the gene activation process. Once the signal from (x) stops, (z) ceases to be activated. The 2-step activation process is ideal for noisy systems where random fluctuations in the signal from (x) are less likely to cause activation of the gene (z) because of the signaling delay via (y).
Feedback and feedforward loops in biologic systems. (A) Positive feedback loops result when (x) leads to the production of (y), which up-regulates the level of (x). (B) Negative feedback loops result when (x) leads to the production of (y) which down-regulates the level of (x). (C) Feed-forward loops are often found in biochemical or genetic regulatory networks. An example involves a general (x) and a specific (y) gene activator. The general activator sends an activation signal to the target gene (z) and the specific activator (y). If the signal is sustained, (y) becomes activated, permitting it to reinforce an activation signal for (z), completing the gene activation process. Once the signal from (x) stops, (z) ceases to be activated. The 2-step activation process is ideal for noisy systems where random fluctuations in the signal from (x) are less likely to cause activation of the gene (z) because of the signaling delay via (y).
Systems properties in hematopoiesis
Because of the physical facility in sampling blood or bone marrow repetitively and quantitatively, the blood system is well-suited for modeling and validation. Hematopoiesis and the functioning of specialized blood cells involve complex processes that can be examined at the level of genes,19 signal transduction proteins,20 or the population distribution of diverse cell types.21 Both deterministic and stochastic processes contribute. By viewing hematopoiesis (cell proliferation and differentiation) as a dynamic system and disease as perturbations of the system, one can learn more about both disease and physiologic states.
Proliferation and loss are fundamental properties of hematopoietic stem cells and their progeny. Population dynamics offers a quantitative approach in studying them. Asymmetric division results in a stem cell dividing into either another stem cell or a more committed cell, while symmetric division yields either 2 stem cells or 2 differentiated daughter cells. These processes can be combined in a series of short steps.22,,–25 Models built around these division (a)symmetries usually result in exponential cell growth, but such growth cannot be realistically sustained in vitro due to spatial and nutrient limitations. Models based on heterogeneous population account for cell proliferation and loss due to death or differentiation. A recent model for hematopoietic reconstitution following bone marrow transplantation posits 3 possibilities: (1) regulated proliferation with fixed self-renewal, (2) regulated stem cell renewal with fixed proliferation, and (3) regulated proliferation and self-renewal rates are variable.26 This model predicts that cytokine-dependent self-renewal rate of hematopoietic stem cells is the most essential in hematopoiesis. Arino and Kimmel considered a configuration in which the erythropoietin (long-range) feedback competes with the stem-cell (local) feedback, the purpose of which is to preserve the stem-cell pool. This system may exhibit normal homeostasis, oscillations, or permanent reduction of red cells supply, corresponding to chronic anemia.27
Differentiation is the other fundamental property of hematopoietic progenitor cells and requires critical processes of cell-fate decision-making. Decision making occurs as a result of biochemical signaling and gene regulatory networks within the cell.28,29 Ultimately, transcription factors determine cellular differentiation and specialization.30 The relative contributions of instructive and permissive programming in hematopoiesis have long been debated.23,31,,,,,,,,,,–42 To describe hematopoietic stem cell renewal and differentiation, deterministic and stochastic models have been constructed (Figure 3A). James Till, a biophysicist, and Ernest McCulloch, a physician, pioneered the study of hematopoiesis in the early 1960s through their development of a quantitative spleen colony assay, establishment of a hematopoietic stem cell, and data analysis that yielded a stochastic model of hematopoiesis.43,44 In their stochastic model,22 cells have 2 possible fates: (1) differentiate and leave the proliferative compartment or (2) undergo symmetric division forming 2 colony-forming cells. Each fate was assigned a probability. Drawing random numbers to determine the fate of each cell, Till and McCulloch calculated the diversity of stem cell populations after the course of several generations. Figure 3B shows the results of 2 different 6-generation simulations. The first simulation ends with 2 colony-forming cells and 5 differentiated cells whereas the second simulation ends with 10 colony-forming cells and 1 differentiated cell. The results appear entirely random between individual simulations but compiling the results of many simulations shows that some outcomes are more likely than others. Hence, colony generation appears as a well-defined process even though individual cell-fate decisions are random. Regulation acts at the population, not cellular, level and the population of stem cells can be affected by influencing processes that define the effective probabilities of birth and death. Forty years later, the Albert Lasker Award for Basic Medical Research was given to Till and McCulloch. Their mathematical model continues to serve as the paradigm for hematopoiesis.

Deterministic and stochastic processes in hematopoiesis. (A) In the deterministic model, hematopoietic growth factors such as Epo, G-CSF, macrophage colony-stimulating factor (M-CSF) instruct differentiation of blood stem cells. (B) In the stochastic model, these growth factors as well as others such as interleukin-3 (IL-3) or stem cell factor (SCF) promote survival, allowing stem cells to differentiate. (C) Results of 6-generation stochastic cell-fate simulations. A pluripotent stem cell can either divide into 2 stem cells or differentiate, losing its proliferative capacity. Simulations were run using a random number generator. The probability of birth was 60%, death 40%, the decision for each cell was performed by picking a random number 0 to 9 with 7 of these numbers (0-5) resulting in symmetric division and 3 (6-9) resulting in stem cell loss due to differentiation. Starting with 1 cell and drawing random numbers for each stem cell present in each generation leads to very different final populations, illustrating the randomness a stochastic model can incorporate. (Figure modified from Till et al22 with permission from Dr Till.)
Deterministic and stochastic processes in hematopoiesis. (A) In the deterministic model, hematopoietic growth factors such as Epo, G-CSF, macrophage colony-stimulating factor (M-CSF) instruct differentiation of blood stem cells. (B) In the stochastic model, these growth factors as well as others such as interleukin-3 (IL-3) or stem cell factor (SCF) promote survival, allowing stem cells to differentiate. (C) Results of 6-generation stochastic cell-fate simulations. A pluripotent stem cell can either divide into 2 stem cells or differentiate, losing its proliferative capacity. Simulations were run using a random number generator. The probability of birth was 60%, death 40%, the decision for each cell was performed by picking a random number 0 to 9 with 7 of these numbers (0-5) resulting in symmetric division and 3 (6-9) resulting in stem cell loss due to differentiation. Starting with 1 cell and drawing random numbers for each stem cell present in each generation leads to very different final populations, illustrating the randomness a stochastic model can incorporate. (Figure modified from Till et al22 with permission from Dr Till.)
The discoveries of lineage-specific cytokines and transcription factors as master switches have reduced the appeal of stochastic models of hematopoiesis. Continuous imaging of single cells, such as granulocyte-macrophage progenitors, supports instructive roles for cytokines such as macrophage colony-stimulating factor and granulocyte colony-stimulating factor (G-CSF).45 Using a stochastic approach, Abkowitz and coworkers used Monte Carlo simulations of branching process46 models alongside data from murine, feline, and nonhuman primate models of early hematopoiesis.38,47,,,,,–53 In this approach, telomere shortening is used as a cellular clock to measure the rate at which hematopoietic stem cells divide.51 This group's results suggest that the number of hematopoietic stem cells across different mammalian species is approximately evolutionarily conserved, a claim that has implications for our current understanding of human hematopoietic stem cell concentrations.54 Ultimately, the utility of stochastic as opposed to deterministic models depends on the level at which hematopoiesis is observed. For large cell numbers, such as the number of committed precursors in normal hematopoiesis, an averaged deterministic approach may be sufficient to capture the behavior of interest. However, tracking rare events such as malignant transformations may require a stochastic model that allows for the occurrence of random events (also referred to as stochastic) with a certain probability.55
Signaling and gene regulatory networks
A cell uses complex intracellular signaling and gene regulatory networks to integrate the multiplicity of cues in its environment and to ultimately make a specific decision. In particular, gene regulatory networks have provided great insights into lineage commitment of hematopoietic progenitors. Huang and associates observed that neutrophil differentiation of HL60 cells was a multistep process in a high-dimension system.56 In a follow-up paper, they showed that single cells of a bipotential cell line were heterogeneous and possessed a differentiation potential that correlated with high-level expression of PU.1 in Sca1high cells and GATA-1 in Sca1low cells. These studies provided evidence of stochastic noise in lineage decisions.41 On the other hand, Laslo and coworkers have used both experimental and computational approaches to examine how transcriptional priming can affect macrophage versus neutrophil fate specification in myeloid progenitors.57 Consistent with previously published work on the relative contributions played by PU.1 and CEBP/α in directing macrophage versus neutrophil differentiation, their deterministic model consists of several ordinary differential equations (ODEs), each describing changes in protein concentration as a function of gene repression and activation. Solutions to the equations indicate either the monostable or bistable production of macrophages and neutrophils, with the population composition dependent upon relative synthesis rates of several transcription factors. For rates resulting in bistable states, cell fate is a stochastic process. Enver and colleagues also used a combined computational/experimental approach to study the bifurcation dynamics in commitment of progenitors to either the erythroid/megakaryocytic lineage or the myelomonocytic lineage.42 These gene regulatory networks interface with the cell's external environment through signaling networks, and links between cell-extrinsic and cell-intrinsic cues can provide important insights into the external regulation of commitment decisions.40,58 A critical area for future study in systems biology of hematopoiesis is the elucidation of molecular mechanisms and signaling topologies that link extracellular cues with gene regulatory networks that ultimately drive cell-fate decisions. Zandstra and colleagues have expanded the classical systems biology approach of intracellular signaling to incorporate intercellular communication. Through integration of computational modeling and quantitative experimentation, they demonstrated that feedback signaling not only can regulate cell fates in homeostasis but also can play a role in leukemic transformation.29
Stress and disease as systemic perturbations
Hematopoiesis must be dynamically regulated to meet environmental stimuli such as infection, hypoxia, or bleeding and to ensure survival of the organism. Inflammation induced by infectious agents involves a network of cytokines, released locally and systemically.59,60 Neutrophils and macrophages provide a frontline of host defense, quickly recruited by soluble mediators released by both host and foreign agents (such as bacterial lipopolysaccharides). The bone marrow must also respond rapidly by increasing neutrophil production and their exit.61 Control processes at the gene level also involve negative regulation of inflammation.62,63 Hypoxia induces the transcription factor hypoxia-inducible factor-1, which rapidly induces a 3-log increase in levels of erythropoietin (Epo).64 During stress, the Epo receptor signaling down-regulates erythroblast Fas and FasL, increasing erythropoietic rate by affecting apoptosis.65
When hematopoietic cells misinterpret environmental cues or defects arise internally, normal homeostasis is lost and blood counts can markedly change or fluctuate. Cyclic neutropenia (CN) and a few anemias are characterized by periodic oscillations in blood cell counts.66,67 Mathematical modeling of dynamics of these disorders was used to illuminate their pathophysiology, although the biologic feedback generating the periodic, quasi-periodic, or chaotic basis observed (quality of the data does not allow to distinguish among these 3 possibilities) remains obscure.67,68 Some models of cyclic neutropenia suggest that the abnormality lies not in the feedback loop but in an elevated neutrophil apoptotic rate that perturbs the normal regulation of stem cell dynamics.69 These models are all deterministic, yet they differ in the number of quantities tracked by separate equations, the number of parameters included, and the types of equations used, for example, ordinary, partial, or delay differential equations.
Lasota and Wazewska-Czyzewska developed the first mathematical model of erythroid production.70 They suggested that decreasing the rate of erythroid precursor maturation increases the steady-state level of nonproliferating erythroid cells. A patient would quickly recover red blood cell levels following treatment-induced anemia. Since erythroid precursor maturation rate increases with Epo levels, which are negatively correlated with blood oxygen content, the model suggests that by increasing a patient's blood oxygen level one can accelerate the rate of erythrocyte recovery following chemotherapeutic insult or radiation therapy. This conclusion was successfully validated in patients.71
A collaborator of theirs, Mackey has been modeling cyclical hematologic diseases.72 One of his models of erythropoiesis incorporates apoptosis and the effect of cell maturation on population dynamics.73 The generalized model divides cells into 2 populations, precursors and mature cells, with precursors maturing at a certain velocity dependent upon Epo concentration, and mature cells dying at a constant rate. The age-structured erythrocyte population is determined by a set of 5 partial differential equations with accompanying boundary conditions. Focusing on system behavior at long times allowed Mahaffy to turn the generalized equations into threshold-delay differential equations.74 Stability analysis was performed on the system of equations, and simulations were run to test the model's agreement with experimental measurements. One of the simulations examines the erythrocyte population's response to a blood donation of 5% by volume. In that case, the concentration of Epo increases rapidly in response to blood loss and the erythrocyte population is restored to its normal level after 18 days, close to the accepted range of 3 to 6 weeks.75 The model was also tested to determine whether it could reproduce the oscillatory effect of induced autoimmune hemolytic anemia on the erythrocyte count of a rabbit (Figure 4). While the magnitude and period of the oscillation peaks vary over time for the experimental data, the model provides an imperfect but strong means for estimating erythrocyte maturation and destruction rate. The model has been modified and applied to cyclic neutropenia and thrombocytopenia, with the former validated in neutropenia found in gray collies.76

Cyclical hematopoiesis. A deterministic model for cyclic erythropoiesis was constructed from experimental data derived from a rabbit with auto-immune hemolytic anemia. The model describes periodic changes in Epo levels as a result of feedback loop with erythrocyte mass. The solid lines represent model predictions and the dashed line represents experimentally obtained erythrocyte counts. (Reprinted from Mahaffy et al73 with permission from Elsevier.)
Cyclical hematopoiesis. A deterministic model for cyclic erythropoiesis was constructed from experimental data derived from a rabbit with auto-immune hemolytic anemia. The model describes periodic changes in Epo levels as a result of feedback loop with erythrocyte mass. The solid lines represent model predictions and the dashed line represents experimentally obtained erythrocyte counts. (Reprinted from Mahaffy et al73 with permission from Elsevier.)
Population-based models have been developed to expand our understanding of leukemogenesis. In 1975, Rubinow and Lebowitz published some of the first papers on mathematical modeling of neutrophil production in man and applications to acute myeloblastic leukemia.77,–79 Based on partial and delay differential equations, Adimy and Crauste developed an age-structured model of hematopoiesis and applied it to chronic myeloid leukemia (CML).80 The equations describe the rates of change of the densities of the populations of proliferating and nonproliferating cells, and their dependence on the concentration of intercellular growth factors, one that influences apoptosis and another that affects stem cell proliferative capacity. The population densities are functions of both time and age, where age is the time a particular cell spends in either the proliferative or nonproliferative compartment. A feedback loop is involved in stem cell proliferation that, when destabilized, leads to oscillations in stem cell population density.
In an effort to bridge the gap between theoretical modelers and experimentalists, Bessonov et al built software based around a basic model of hematopoiesis and leukemogenesis in the bone marrow.81 The software allows the user to adjust many parameters including the bone marrow's fixed stem cell density, the possible cell types and their order of differentiation, probabilities of differentiation, differentiation rates, and proliferation rates. Bessonov et al tried varying parameters at random and reviewed the resulting scenarios: (1) the leukemic cells were too few or proliferated too slowly and were washed out of the marrow by the normal cells, (2) the leukemic cells proliferated rapidly and took over the bone marrow, or (3) the rate permitted the bone marrow's leukemic stem cell population to oscillate with a period dependent upon the relative parameter values. Interestingly, the oscillations approximated those seen in CML and CN patients.
Clinical applications
Modeling may be applied to improving drug therapeutics and predicting drug resistance (and trying to prevent it). G-CSF is the most important cytokine to promote the production of neutrophils82,83 and has been used clinically to ameliorate chemotherapy-associated neutropenia or congenital neutropenias and mobilize peripheral stem cells. Mathematical models have been developed to describe the dynamics of G-CSF administration with the dual purpose of predicting an elevation in neutrophils in response to particular administration schedules and gaining insight into the function of hematopoiesis in general. Obeyesekere et al constructed a population dynamics model of hematopoiesis that considered peripheral blood cells and the interactions between differentiated stem cells; their simulations showed good agreement with clinical data and made valuable predictions regarding the treatment of neutropenia and thrombocytopenia.84 The model treats the bone marrow and the peripheral blood as 2 separate compartments and distinguishes between 4 cell types: bone marrow stem cells, CD34+ cells, white blood cells, and platelets (Figure 5). Based on parameters that are clinically measureable, the model consists of 5 differential equations, each describing the rate of change of 1 of the 4 cell types, with the fifth describing the G-CSF production/clearance rate. Three feedback loops were postulated. Parameter values were chosen based upon known properties of hematopoiesis. The equations were solved numerically and simulations of clinically relevant scenarios were run to ensure that the model's output agreed with experimental data, thus validating it and opening it for use as a predictive tool. The first test of the model was to ensure that it accurately represented blood cell recovery rates. For the case of CD34+ cell donation by a healthy person, the model agrees with experimental results for all cell types except platelets. The model accurately describes the effect of G-CSF saturation, where more than a certain number of injections of G-CSF have no immediate or long-term affect on neutrophil count. The model also predicts that injections of CD34+ stem cells can be used following chemotherapeutic assault to hasten recovery and significantly reduce the symptoms associated with neutropenia and thrombocytopenia. However, levels are not constant but actually oscillate about a constant level depending on a series of factors.85 By experimentally characterizing these oscillations and explicitly including them, future models might provide a better fit to clinical data.

Population dynamics model for G-CSF mobilized peripheral stem cells. (A) A compartment model for stem cell mobilization. This model describes the G-CSF concentration (G) in the microenvironment and 4 different populations of cells in the bone marrow and peripheral blood: stem cells (S), peripheral blood cells (B), white blood cells (W), and platelets (P). Other parameters that the model incorporates are as follows: aG, aP: the production rates of G-CSF and platelets. aS(G), aw(G): The production rates of stem cells and white blood cells as functions of G-CSF concentration. f1, f2, f3: Rates at which stem cells, white blood cells, and platelet concentrations down-regulate the stem cell production rate. f4: Rate at which white blood cell concentration down-regulates G-CSF production. dG, dB, dW, dP: The rates of destruction of G-CSF, peripheral blood progenitor cells, white blood cells, and platelets. TL: The population of progenitor cells in the bone marrow. TSB: The population of stem cells passing from the blood to the bone marrow. TBS: The population of stem cells passing from the bone marrow to the blood r(G). (B) Stimulation of G-CSF treatment every day over a 9-day period shows a rapid increase in white blood cell count (solid line) with each treatment (dotted line). After 5 days, further treatments have no effect on total white blood cell count. Once treatment has stopped (day 10), white blood cell counts slowly decline, returning to pretreatment levels. (Figure from Obeyesekere et al84 reprinted with permission from Wiley-Blackwell.)
Population dynamics model for G-CSF mobilized peripheral stem cells. (A) A compartment model for stem cell mobilization. This model describes the G-CSF concentration (G) in the microenvironment and 4 different populations of cells in the bone marrow and peripheral blood: stem cells (S), peripheral blood cells (B), white blood cells (W), and platelets (P). Other parameters that the model incorporates are as follows: aG, aP: the production rates of G-CSF and platelets. aS(G), aw(G): The production rates of stem cells and white blood cells as functions of G-CSF concentration. f1, f2, f3: Rates at which stem cells, white blood cells, and platelet concentrations down-regulate the stem cell production rate. f4: Rate at which white blood cell concentration down-regulates G-CSF production. dG, dB, dW, dP: The rates of destruction of G-CSF, peripheral blood progenitor cells, white blood cells, and platelets. TL: The population of progenitor cells in the bone marrow. TSB: The population of stem cells passing from the blood to the bone marrow. TBS: The population of stem cells passing from the bone marrow to the blood r(G). (B) Stimulation of G-CSF treatment every day over a 9-day period shows a rapid increase in white blood cell count (solid line) with each treatment (dotted line). After 5 days, further treatments have no effect on total white blood cell count. Once treatment has stopped (day 10), white blood cell counts slowly decline, returning to pretreatment levels. (Figure from Obeyesekere et al84 reprinted with permission from Wiley-Blackwell.)
Shochat also developed a model describing the effects of different G-CSF administration schedules on neutrophil dynamics.86 Similar to Obeyesekere's, Shochat's model uses 6 easily obtainable parameters, making it clinically valuable. The model consists of 2 differential equations, each describing the rate of change of granulocyte count and neutrophil count, along with several constraint equations that encode known physiologic properties of G-CSF/neutrophil dynamics. One of these constraint equations encodes the observation that the rate of G-CSF production, under basal conditions, is independent of G-CSF levels and represents a smooth function that decreases slowly as the blood neutrophil count decreases. Another encodes the fact that blood neutrophil levels increase with G-CSF levels. The equations are studied and solved and it is mathematically proven that, given the equations and associated physiologically defined constraints, there is exactly 1 structurally stable solution. Thus, small changes to the input parameters result in small changes in the output values, for example, a small change in the blood's G-CSF concentration changes the neutrophil production rate by a small amount.
The functional forms of the model's 4 rate factors—the rate of G-CSF production in the blood, the rate of neutrophil production, G-CSF clearance, and neutrophil death rates—are selected such that the functions obey the various constraints set out with the main model equations. If the functions are kept simple it is possible to tie predictions of the model to their biologic origins. Shochat chose the Michaelis-Menten approximation to determine kinetic rate terms and searched the literature for values for the model parameters and used numerical methods to estimate the remaining unknown values. An example of how this model can be applied can be found in elevated neutrophil counts in patients with CML. Two parameters can be tweaked to increase the neutrophil count: neutrophil death rate and the minimum neutrophil birth rate. By decreasing the former, significantly increasing the latter or a combination of the 2, one can reproduce the neutrophil counts measured in CML patients. This model suggests that a potential treatment for CML could target either of these rates. Imatinib accomplishes this by targeting BCR-ABL, which decreases a leukemic cell's ability to resist apoptosis, thereby increasing the death rate.87
The mathematical form of Shochat's model also suggests that when trying to increase neutrophil counts, it is far more efficient to decrease the clearance rate of G-CSF than to increase dosage size or dosage frequency. A PEGylated form of G-CSF has been synthesized to reduce its degradation rate. Sarkar and Lauffenburger formulated a mathematical model describing G-CSF/G-CSF receptor dynamics at the cell level, including the role of endocytic trafficking and ligand depletion, and integrated this into a larger pharmacokinetic/pharmacodynamic model. The model predicted that a G-CSF analog that effectively eliminates clearance (eg, PEGylated G-CSF) would have a significantly longer half-life in vivo and improve peripheral neutrophil counts. This type of model, which correlates the molecular and pharmacologic properties of a drug, may aid in the design of other protein therapeutics.88
A third deterministic model of granulopoiesis incorporates 3 intracellular secondary messengers that mediate the effect G-CSF has on cell replication and maturation rates.89 Transcription factors act at this step so the incorporation of secondary messengers is not without merit.42 The model consists of a combination of several ordinary differential equations that track the population dynamics of G-CSF, neutrophils, and free and bound G-CSF receptors, and partial differential equations that incorporate the age structure of the population due to active cell cycling. The model is unique in that it was the first to consider the effect microenvironment feedback has on the fate of G1 cells. Experiments involving radiolabeling of granulocytes and different G-CSF administration schedules validated the model. Simulations were in excellent agreement, accurately predicting a steady-state G-CSF receptor-to-neutrophil ratio of 2200, and an apoptotic rate of 57%.69 In addition, the model suggests that the secondary messenger is directly involved with an increasing G-CSF clearance rate associated with frequent G-CSF injections.
For a given chemotherapy drug, there is always at least a small population of cancer cells that will exhibit drug resistance and whose growth is kept in check by the more populous, nonresistant cells.90,91 In killing the nonresistant cells, therapy removes a selection pressure and allows resistant clones to proliferate. Adaptive therapy is aimed at more heterogeneous cancers for which both the rate of cell mutation and thus treatment failure are high. Gatenby reasons that by maintaining a small population of cancerous cells one can indirectly suppress the overgrowth of less-fit treatment-resistant cells and thereby improve a patient's survival outlook. Both mathematical and experimental mouse models confirm this hypothesis.90
CML provides an excellent model to study drug resistance. Imatinib blocks the tyrosine-kinase activity of BCR-ABL, resulting in the reduction of leukemic progenitor and differentiated leukemic cell counts beyond limits of detection. Michor et al developed a deterministic model of hematopoiesis in CML to examine the response of leukemic stem cells to treatment with imatinib and the dynamics of resistance emergence in its presence.92 The model considers the change in number of normal stem cells, progenitors, differentiated, and terminally differentiated cells, and their leukemic, resistant, and nonresistant counterparts. They concluded that the rate and degree of CML progenitor rebound following cessation of imatinib treatment indicates that imatinib does not reduce the number of leukemic stem cells but acts by eliminating progenitors. Further work also suggests that the decrease in leukemic cell burden is biphasic, with a rapid decline in the first few months of treatment followed by a slower decline over the next 6 months.
Future challenges
The success of systems analysis of hematopoiesis will depend upon technologic breakthroughs and collaborations between the biologic and physical sciences that yield accurate predictions and emergent properties. With each discipline using a different language, this is easier said than done. Changes in undergraduate, graduate, and medical curricula must be implemented to train a new generation of biomedical researchers fluent in quantitative or engineering disciplines.93,–95 Systems biology requires a balance between models sufficiently complex to describe a system and yet simple enough to be clinically useful. Understanding large quantities of data well enough to validate a model is especially challenging. The development of Systems Biology Markup Language (SBML) has made it easier to develop biology-oriented software packages, such as COPASI, Simmune, MetaCore, and Cytoscape, which aid model building and data analysis.18,96,,–99 Since 2001 the number of such packages developed for systems biology has grown from 5 to more than 170. With computational power becoming ever greater and cheaper, the number and diversity of such software packages will only increase, bringing within their scope models that may not be impossible to validate with current technology. At present, most models of hematopoiesis are built at a single scale, for example, cellular or molecular. The future lies in building models that span multiple scales, incorporating more of the connections that exist between them and thereby being able to account for some of the complexity that arises from the connections. Among the fundamental questions in normal and leukemic hematopoiesis that systems biology will address are: integration of signaling pathways, circuits, and networks that determine cell fate, multiscale modeling of stem cell plasticity, synthesis of genetic and epigenetic data, global analysis of phosphoproteins, dynamics of hematopoiesis in the bone marrow microenvironment presented in 3-dimensional imaging, and cellular engineering to expand selective blood cell compartments for therapy. The complexity or density of experimental data will demand a systems approach.
Acknowledgments
This work was supported by National Institutes of Health grants RO1HL080052, RO1CA108922, and RO1GM086885, and the J. P. McCarthy Foundation (S.J.C.).
National Institutes of Health
Authorship
Contribution: Z.L.W., C.A.S., M.K., and S.J.C. each contributed to the writing of the manuscript.
Conflict-of-interest disclosure: The authors declare no competing financial interests.
Correspondence: Seth J. Corey, Lurie 5-107, Northwestern University Feinberg School of Medicine, 303 E. Superior St, Chicago, IL 60611; e-mail: s-corey@northwestern.edu.
Appendix: Glossary
- Analytical solution:
A solution to an equation or set of equations that can be explicitly written in terms of known functions and constants (ie, in “closed form”).
- Bayesian network:
A statistical model in a form of a tree based on existing data that correlates values of given input parameters with probabilities of certain outputs.
- Bistability:
A property of 1 or more equations for which 2 stable solutions exist. The existence of multiple stable solutions is known as multistability.
- “Black box” model:
A model that aims to determine the functional relationship between known system input and output when the specifics of the system structure are unknown. “Black box” models are often built from existing data using some form of regression analysis.
- Boolean network:
A directed graph where nodes can take 2 possible states (1 or 0) and edges represent causal relationships between nodes. The state of a given node depends on the states of its input nodes through a logic (boolean) function that specifies the causal relationship between nodes. Boolean networks are often used to model genetic regulatory networks in which nodes are genes that can be active or inactive depending on the states of the genes (or gene products) that regulate them.
- Deterministic model:
A model in which future states are fully determined by the past and present states, frequently built using differential equations.
- Edge:
A line or arrow between 2 nodes in a graph that indicates a relationship between elements in the system.
- Emergent properties:
Properties of a system that arise from the interactions among its components that cannot be deduced from their individual behavior.
- Empirical model:
A nonmechanistic model that shows good agreement with existing experimental data and can be used to predict outcomes in separate but similar datasets.
- Feedback loop:
A loop structure in which the output signal B produced by an element upon receiving an input signal A is also an input signal to the element generating signal A producing a down-regulation/up-regulation of signal A.
- Feed-forward loop:
A loop structure in which 2 signals generated by a system element converge on an element downstream from this origin. Feed-forward control can either speed up a system's dynamics or destabilize it.
- Graph:
A collection of nodes and edges that indicate relationships between nodes. Edges can be directed or undirected. Graphs (or networks) are a useful representation of a system in which each node corresponds to a functional element of the system (eg, state of a molecule, protein, or gene) and an edge represents the relevant interactions between functional units (eg, conformational changes, physical interactions, or regulatory interactions). Graph and network are often used interchangeably in systems biology literature and have acquired essentially the same meaning.
- Hysteresis:
A property that arises from the existence of multiple stable states/solutions in which the system can get trapped depending on its previous history.
- In silico:
A term used in reference to systems created, solved, or simulated using a computer.
- Loop:
A structure in a graph or network that is characterized by a cyclical relationship among system elements.
- Mechanistic model:
A model that describes the physical processes that give rise to observed properties of the system. Variables and parameters of the system correspond to physical quantities and rates that can be measured empirically.
- Michaelis-Menten kinetics:
- A mechanistic description of the rate of product formation in an enzymatic reaction that is based on the law of mass action but assumes that the concentration of the enzyme-substrate complex intermediate is essentially invariant during the timescale of interest. The enzyme and substrate bind to form a complex at a rate k1, dissociate back into reactants at a rate k−1 and turn from a complex to products and enzyme at a rate k2.The Michaelis-Menten equation describes the rate of the reaction and is written as,
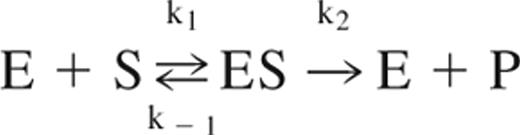 where v0 is the initial reaction rate, vmax is the maximum reaction rate, and KM=(k−1 + k2)/k1, the rate of complex dissociation and product production relative to the rate of complex formation.
- Monte Carlo simulation:
A widespread method used to obtain observable quantities that depend on random variables whose probability distributions are known. MC methods can be used to introduce stochasticity into a model but are also used to sample the parameter space of deterministic models.
- Network:
See definition of Graph.
- Neural network:
A computational framework used to make predictions of an output quantity given some inputs. In a neural network the internal elements (or neurons) are connected to each other with different weights such that the correlation between predicted and known outputs for a specific training set of input signals is high. Neurons and weights do not represent any real process happening in the system thus neural networks are useful when internal relationships between model components are unknown.
- Node:
Element of a graph or network that is used to represent a functional entity or interacting unit within a system (eg, a protein or transcription factor in a signaling network, a molecular species in a chemical reaction).
- Noise:
Randomness that is an inherent part of a system.
- Numerical solution:
Computationally determined solution to an equation or system of equations, typically necessary when an analytical solution is intractable. A numerical solution is approximation of the closed-form solution, but it can be calculated to any desired level of precision, given enough time and computational power.
- Principal component analysis (PCA):
Statistical analysis technique aimed at determining which parameters of a model have the largest impact on model output. PCA can be used to examine the effect of varying multiple parameters at once on one or more functions of output parameters. PCA is useful when trying to identify a minimal set of transformed variables, or principal components, that can account for most of the variability in a dataset.
- Regression analysis:
A method used to determine the functional relationship between a system's output and one or more input parameters. Linear regression models are the most common form of regression analysis. In such models the function is assumed to be a linear combination of the input parameters. Various methods exist to determine this function, the earliest being the method of least squares.
- Sensitivity analysis:
A tool used during the model-making process to determine the quantity of variation in the observable quantities that can be attributed to variation in each input parameter.
- State space:
The collection of all possible states a system can be in. For example, one's location on earth is described by 3 parameters: longitude, latitude, and altitude. This is one's spatial state. Spatial state space is the collection of all possible combinations of longitude, latitude, and altitude. Extending this to N parameters, one can imagine the space as an N-dimensional grid where each vertex represents a different parameter combination and thus a different spatial state.
- Steady-state solution:
The solution to a kinetic equation or set of equations that is obtained by setting all time derivatives to zero, a justifiable assumption for equilibrated systems.
- Stochastic model:
A model that incorporates random fluctuations in model parameters or model structure.
