

Abstract
Minor histocompatibility antigens (mHags) are molecular targets of allo-immunity associated with hematopoietic stem cell transplantation (HSCT) and involved in graft-versus-host disease, but they also have beneficial antitumor activity. mHags are typically defined by host SNPs that are not shared by the donor and are immunologically recognized by cytotoxic T cells isolated from post-HSCT patients. However, the number of molecularly identified mHags is still too small to allow prospective studies of their clinical importance in transplantation medicine, mostly due to the lack of an efficient method for isolation. Here we show that when combined with conventional immunologic assays, the large data set from the International HapMap Project can be directly used for genetic mapping of novel mHags. Based on the immunologically determined mHag status in HapMap panels, a target mHag locus can be uniquely mapped through whole genome association scanning taking advantage of the unprecedented resolution and power obtained with more than 3 000 000 markers. The feasibility of our approach could be supported by extensive simulations and further confirmed by actually isolating 2 novel mHags as well as 1 previously identified example. The HapMap data set represents an invaluable resource for investigating human variation, with obvious applications in genetic mapping of clinically relevant human traits.
Introduction
The antitumor activity of allogeneic hematopoietic stem cell transplantation (HSCT), which is a curative treatment for many patients with hematologic malignancies, is mediated in part by immune responses that are elicited as a consequence of incompatibility in genetic polymorphisms between the donor and the recipient.1,2 Analysis of patients treated for posttransplantation relapse with donor lymphocytes has shown tumor regression to be correlated with expansion of cytotoxic T lymphocytes (CTLs) specific for hematopoiesis-restricted minor histocompatibility antigens (mHags).3,4 mHags are peptides, presented by major histocompatibility complex (MHC) molecules, derived from intracellular proteins that differ between donor and recipient due mostly to single nucleotide polymorphisms (SNPs) or copy number variations (CNVs).1,2,5 Identification and characterization of mHags that are specifically expressed in hematopoietic but not in other normal tissues could contribute to graft-versus-leukemia/lymphoma (GVL) effects, while minimizing unfavorable graft-versus-host disease, one of the most serious complications of allo-HSCT.1,2 Unfortunately, however, efforts to prospectively target mHags to invoke T cell–mediated selective GVL effects have been hampered by the scarcity of eligible mHags, largely due to the lack of efficient methods for mapping the relevant genetic loci. Several methods have been developed to identify mHags, including peptide elution from MHC,6,7 cDNA expression cloning,8,9 and linkage analysis.3,10 We have recently reported a novel genetic method that combines whole genome association scanning with conventional chromium release cytotoxicity assays (CRAs). With this approach the genetic loci of the mHag gene recognized by a given CTL clone can be precisely identified using SNP array analysis of pooled DNA generated from immortalized lymphoblastoid cell lines (LCLs) that are immunophenotyped into mHag+ and mHag– groups by CRA.11 The mapping resolution has now been improved from several Mb for conventional linkage analysis to an average haplotype block size of less than 100 kb,12 usually containing a handful of candidate genes. Nevertheless, it still requires laborious DNA pooling and scanning of SNP arrays with professional expertise for individual CTLs.11 To circumvent these drawbacks, we have sought to take advantage of publicly available HapMap resources. Here, we describe a powerful approach for rapidly identifying mHAg loci using a large genotyping data set and LCLs from the International HapMap Project for genome-wide association analysis.13-15
Methods
Cell lines and CTL clones
The HapMap LCL samples were purchased from the Coriell Institute (Camden, NJ). All LCLs were maintained in RPMI1640 supplemented with 10% fetal calf serum, 2 mM l-glutamine, and 1 mM sodium pyruvate. Because the recognition of a mHag requires presentation on a particular type of HLA molecule, the LCLs were stably transduced with a retroviral vector encoding the restriction HLA cDNA for a given CTL clone when necessary.16
CTL lines were generated from recipient peripheral blood mononuclear cells obtained after transplantation by stimulation with those harvested before HSCT after irradiation (33 Gy), and thereafter stimulated weekly in RPMI 1640 supplemented with 10% pooled human serum and 2 mM l-glutamine. Recombinant human inerleukin-2 was added on days 1 and 5 after the second and third stimulations. CTL clones were isolated by standard limiting dilution and expanded as previously described.10,17 HLA restriction was determined by conventional CRAs against a panel of LCLs sharing HLA alleles with the CTLs. All clinical samples were collected based on a protocol approved by the Institutional Review Board Committee at Aichi Cancer Center and the University of Tokyoand after written informed consent was obtained in accordance with the Declaration of Helsinki.
Immunophenotyping of HapMap LCLs and high-density genome-wide scanning of mHag loci
Case (mHag+) - control (mHag−) LCL panels were generated by screening corresponding restriction HLA-transduced CHB and JPT HapMap LCL panels with each CTL clone using CRAs. Briefly, target cells were labeled with 0.1 mCi of 51Cr for 2 hours, and 103 target cells per well were mixed with CTL at a predetermined E/T ratio in a standard 4-hour CRA. All assays were performed at least in duplicate. The percent specific lysis was calculated by ((Experimental cpm - Spontaneous cpm) / (Maximum cpm - Spontaneous cpm)) × 100. After normalization by dividing their percent specific lysis values by that of positive control LCL (typically recipient-derived LCL corresponding to individual CTL clones), the mHag status of each HapMap LCL was defined as positive, negative, or undetermined.
To identify mHag loci, we performed association tests for all the Phase II HapMap SNPs, by calculating χ2 test statistics based on 2 × 2 contingency tables with regard to the mHag status as measured by CRA and the HapMap genotypes (presence or absence of a particular allele) at each locus. χ2 were calculated for the 2 possible mHag alleles at each locus and the larger value was adopted for each SNP. While different test statistics may be used showing different performance, the χ2 statistic is most convenient for the purpose of power estimation as described below. The maximum value of the χ2 statistics was evaluated against the thresholds empirically calculated from 100 000 random permutations within a given LCL set. The program was written in C++ and will run on a unix clone. It will be freely distributed on request. Computation of the statistics was performed within several seconds on a Macintosh equipped with 2 × quadcore 3.2 GHz Zeon processors (Apple, Cupertino, CA), although 100 000 permutations took several hours on average.
Evaluation of the power of association tests using HapMap samples
The genotyping data of the Phase II HapMap14 were obtained from the International HapMap Project website (http://www.hapmap.org/genotypes/latest_ncbi_build35), among which we used the nonredundant data sets (excluding SNPs on the Y chromosome) from 60 CEU (Utah residents with ancestry from northern and western Europe) parents, 60 YRI (Yoruba in Ibadan, Nigeria) parents, and the combined set of 45 JPT (Japanese in Tokyo, Japan) and 45 CHB (Han Chinese in Beijing, China) unrelated people. They contained 3 901 416 (2 624 947 polymorphic), 3 843 537 (295 293 polymorphic), and 3 933 720 (2 516 310 polymorphic) SNPs for CEU, YRI, and JPT + CHB, respectively.
To evaluate the power, we first assumed that the Phase II HapMap SNP set contains the target SNP of the relevant mHag or its complete proxies, and that the immunologic assays can completely discriminate i mHag+ and j mHag− HapMap LCLs. Under this ideal condition, the test statistic, or χ2, for these SNPs takes a definite value, f(i,j) = i+j, which was compared with the maximum χ2 value, or its distribution, under the null hypothesis, that is, no SNPs within the Phase II HapMap set should be associated with the mHag locus. Unfortunately, the latter distribution cannot be calculated in an explicit analytical form but needs to be empirically determined based on HapMap data, because Phase II HapMap SNPs are mutually interdependent due to extensive linkage disequilibrium within human populations. For this purpose, we simulated 10 000 case-control panels by randomly choosing i mHag+ and j mHag− HapMap LCLs for various combinations of (i,j) and calculated the maximum χ2 values (χ2max) for each panel to identify those (i,j) combinations, in which f(i,j) exceeds the upper 1 percentile point of the simulated 10 000 maximum values, g(i,j)P = .01.
When proxies are not complete (ie, r2 < 1), the expected values will be decayed by the factor of r2, and further reduced due to the probabilities of false positive (fP) and negative (fN) assays, and expressed as f̂(i,j) = (i + j) × r̂2 through an apparent r2 (r̂2) as provided in formula 1.1 Under given probabilities of assay errors and maximum LD strength between markers and the mHag allele, we can expect to identify target mHag loci for those (i,j) sets that satisfy f̂(i,j) >g(i,j)P = .01.
Empirical estimation of distributions of r2
The maximum r2 value (r2max) between a given mHag allele and one or more Phase II HapMap SNPs was estimated based on the observed HapMap data set. Each Phase II HapMap SNP was assumed to represent a target mHag allele, and the (r2max) was calculated, taking into account all the Phase II HapMap SNPs less than 500 kb apart from the target SNP.
Confirmatory genotyping
Genotyping was carried out either by TaqMan MGB technology (Applied Biosystems, Foster City, CA) with primers and probes for HA-1 mHag according to the manufacturer's protocol using an ABI 7900HT with the aid of SDS version 2.2 software (Applied Biosystems) or by direct sequencing of amplified cDNA for the SLC1A5 gene. cDNA was reverse transcribed from total RNA extracted from LCLs, and polymerase chain reaction (PCR) was conducted with cDNA with the corresponding primers. Amplified DNA samples were sequenced using BigDye Terminator version 3.1 (Applied Biosystems). The presence or absence (deletion) of the UGT2B17 gene was confirmed by genomic PCR with 2 primer sets for exons 1 and 6 as described previously18 using DNA isolated from LCLs of interest.
Epitope mapping
A series of deletion mutant cDNAs were designed and cloned into pcDNA3.1/V5-His TOPO plasmid (Invitrogen, Carlsbad, CA). Thereafter, 293T cells that had been transduced with restricting HLA class I cDNA for individual CTL clones were transfected with each of the deletion mutants and cocultured with the CTL clone overnight to induce interferon (IFN)-γ release, which was then evaluated by enzyme-linked immunosorbent assay (ELISA) as previously described.9
For SLC1A5, expression plasmids encoding full-length cDNA and the exon 1 of recipient and donor origin were first constructed because only the SNP in the exon 1 was found to be concordant with susceptibility to CTL-3B6. Next, amino (N)- and (carboxyl) C-terminus–truncated minigenes encoding polypeptides around the polymorphic amino acid defined by the SNP were amplified by PCR from SLC1A5 exon 1 cDNA as template and cloned into the above plasmid. The constructs all encoded a Kozak sequence and initiator methionine (CCACC-ATG) and for C-terminus deletions a stop codon (TAG).
For UGT2B17, a series of C-terminus deletion mutants with approximately 200 bp spacing was first constructed as above. For further mapping, N-terminus deletion mutants were added to the region that was deduced to be potentially encoding the CTL-1B2 epitope. For prediction of a CTL epitope, the HLA Peptide Binding Predictions algorithm on the BioInformatics & Molecular Analysis Section (BIMAS) website (http://www.bimas.cit.nih.gov/molbio/hla_bind/)19 was used because HLA-A*0206 has a similar binding motif to that of A*0201.
Epitope reconstitution assay
The candidate mHag epitopes and allelic counterpart peptides (in case of SLC1A5) were synthesized by standard Fmoc chemistry. 51Cr-labeled mHag− donor LCL were incubated with graded concentrations of the peptides and then used as targets in standard CRAs.
Results and discussion
Statistical approach and estimation of potential overfitting
We reasoned that the mHag locus recognized by a given CTL clone could be defined by grouping LCLs from a HapMap panel into mHag+ and mHag− subpanels according to their susceptibility to lysis by the CTL clone and then performing an association scan using the highly qualified HapMap data set containing more than 3 000 000 SNP markers. The relevant genetic trait here is expected to show near-complete penetrance, and the major concern with this approach arises from the risk of overfitting observed phenotypes to one or more incidental SNPs with this large number of HapMap SNPs under the relatively limited size of freedom due to small numbers of independent HapMap samples (90 for JPT + CHB and 60 for CEU and YRI, when not including their offspring).13
To address this problem, we first estimated the maximum sizes of the test statistics (here, χ2 values) under the null hypothesis (ie, no associated SNPs within the HapMap set) by simulating 10 000 case-control HapMap panels under different experimental conditions, and compared them with the expected size of test statistic values from the marker SNPs associated with the target SNP, assuming different linkage disequilibrium (LD), or r2 values in between. As shown in Figure 1, the possibility of overfitting became progressively reduced as the number of LCLs increased, which would allow for identification of the target locus in a broad range of r2 values, except for those mHags having very low minor allele frequencies (MAF) below approximately 0.05. According to our estimation using the Phase II HapMap data (see “Methods”), the majority (> 90%) of common target SNPs (MAF > ∼ 0.05) could be captured by one or more HapMap SNPs with more than 0.8 of r2 (Figure S1, available on the Blood website; see the Supplemental Materials link at the top of the online article), ensuring a high probability of detecting an association (Figure 1 left panels). The simulation of pseudo-Phase II sets generated from the ENCODE regions provided a similar estimation.13 False positive and negative immunophenotyping results could also complicate the detection, reducing the expected test statistics through the “apparent” r2 values (r̂2), as defined by
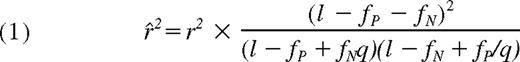
where fP, fN, and q represent false typing probabilities with positive and negative LCL panels, and the ratio of the positive to the negative LCL number, respectively. However, the high precision of cytotoxicity assays (fP ∼ < 0.1, fN ∼= 0) limits this drawback from the second term to within acceptable levels and allows for sensitive mHag locus mapping with practical sample sizes (Figure 1 middle and right panels), suggesting the robustness of our novel approach.

Numbers of positive and negative LCLs required for successful mHag mapping. The target locus was assumed to be uniquely identified, if the expected χ2 value for the target SNP (f̂(i,j), see Document S1) exceeded the upper 1 percentile point of the maximum χ2 values in 10 000 simulated case-control panels (g(i,j)P=.01). Combinations of the numbers of mHag+ (vertical coordinates) and mHag− (horizontal coordinates) samples satisfying the above condition are shown in color gradients corresponding to different max r2 values between the target SNP and one or more nearby Phase II HapMap SNPs (r2max), ranging from 0.4 to 1.0. Calculations were made for 3 HapMap population panels, CHB + JPT (top), YRI (middle), and CEU (bottom) and for different false positive and negative rates, fP = fN = 0 (left), fP = 0.1,fN ≅ 0 (middle), and fP = 0.1,fN = 0.05 (right), considering the very low false negative assays for CRAs.
Numbers of positive and negative LCLs required for successful mHag mapping. The target locus was assumed to be uniquely identified, if the expected χ2 value for the target SNP (f̂(i,j), see Document S1) exceeded the upper 1 percentile point of the maximum χ2 values in 10 000 simulated case-control panels (g(i,j)P=.01). Combinations of the numbers of mHag+ (vertical coordinates) and mHag− (horizontal coordinates) samples satisfying the above condition are shown in color gradients corresponding to different max r2 values between the target SNP and one or more nearby Phase II HapMap SNPs (r2max), ranging from 0.4 to 1.0. Calculations were made for 3 HapMap population panels, CHB + JPT (top), YRI (middle), and CEU (bottom) and for different false positive and negative rates, fP = fN = 0 (left), fP = 0.1,fN ≅ 0 (middle), and fP = 0.1,fN = 0.05 (right), considering the very low false negative assays for CRAs.
Evaluation of the detection power for known mHags
Based on these considerations, we then assessed whether this approach could be used to correctly pinpoint known mHag loci (Table S1). Because the relevant mHag alleles are common SNPs and directly genotyped in the Phase II HapMap set, or if not, located within a well-defined LD block recognized in this set (Figure S2), their loci would be expected to be uniquely determined with an acceptable number of samples, as predicted from Figure 1. To test this experimentally, we first mapped the locus for HA-1H mHag7 by evaluating recognition of the HLA-A*0206–transduced HapMap cell panel with HLA-A*0206–restricted CTL-4B1.20 After screening 58 well-growing LCLs from the JPT + CHB panel with CRAs using CTL-4B1 (Figure S3A; Tables S2,S3), we obtained 37 mHag+ and 21 mHag− LCLs, which were tested for association at 3 933 720 SNP loci. The SNP (rs1801284) encoding the mHag is located within a HapMap LD block on chromosome 19q13.3, but is not directly genotyped within this data set. The genome-wide scan clearly indicated a unique association with the HA-1H locus within the HMHA1 gene, showing a peak χ2 statistic of 52.8 (not reached in 100 000 permutations) at rs10421359 (Figures 2A,3A; Tables S2,S3).

Genome-wide scanning to identify chromosome location of mHag. χ2 values were plotted against positions on each chromosome for each of 3 mHags recognized by CTL-4B1 (A), CTL-3B6 (B), and CTL-1B2 (C). Chromosomes are displayed in alternating colors. Threshold χ2 values corresponding to the genome-wide P = 10−3 (dark blue) and 10−2 (light blue), as empirically determined from 100 000 random permutations, are indicated by broken lines, while the theoretically possible maximum values are shown with red broken lines. The highest χ2 value in each experiment is indicated by a red arrow.
Genome-wide scanning to identify chromosome location of mHag. χ2 values were plotted against positions on each chromosome for each of 3 mHags recognized by CTL-4B1 (A), CTL-3B6 (B), and CTL-1B2 (C). Chromosomes are displayed in alternating colors. Threshold χ2 values corresponding to the genome-wide P = 10−3 (dark blue) and 10−2 (light blue), as empirically determined from 100 000 random permutations, are indicated by broken lines, while the theoretically possible maximum values are shown with red broken lines. The highest χ2 value in each experiment is indicated by a red arrow.

Regions of mHag loci identified by HapMap scanning. LD structures around the SNPs showing peak statistical values (in JPT + CHB) are presented for each mHag locus identified with (A) CTL-4B1, (B) CTL-3B6, and (C) CTL-1B2. Regional χ2 plots are also provided on the top of each panel. LD plots in pairwise D's with recombination rates along the segment were drawn with HaploView software version 4.0 (http://www.broad.mit.edu/mpg/haploview/). The size and location of each LD block containing a mHag locus are indicated within the panels. Significant SNPs (blue letters), as well as other representative SNPs, are shown in relation to known genes. The positions of the SNPs showing the highest statistic values (red letters) are indicated by red arrowheads.
Regions of mHag loci identified by HapMap scanning. LD structures around the SNPs showing peak statistical values (in JPT + CHB) are presented for each mHag locus identified with (A) CTL-4B1, (B) CTL-3B6, and (C) CTL-1B2. Regional χ2 plots are also provided on the top of each panel. LD plots in pairwise D's with recombination rates along the segment were drawn with HaploView software version 4.0 (http://www.broad.mit.edu/mpg/haploview/). The size and location of each LD block containing a mHag locus are indicated within the panels. Significant SNPs (blue letters), as well as other representative SNPs, are shown in relation to known genes. The positions of the SNPs showing the highest statistic values (red letters) are indicated by red arrowheads.
Identification of novel mHags
We next applied this method to mapping novel mHags recognized by CTL clone 3B6, which is HLA-B*4002–restricted; and CTL clone 1B2, which is HLA-A*0206–restricted. Both clones had been isolated from peripheral blood samples of post-HSCT different patients. In preliminary CRAs with the JPT + CHB panel, allele frequencies of target mHags for CTL-3B6 and CTL-1B2 in this panel were estimated as approximately 25% and approximately 45%, respectively (data not shown). After screening 72 JPT + CHB LCLs with CTL-3B6, 36 mHag+ and 14 mHag− LCLs were obtained, leaving 22 LCLs undetermined based on empirically determined thresholds (> 51% for mHag + LCLs and < 11% for mHag-LCLs; Figure S3B, Tables S2,S4). As shown in Figure 2B, the χ2 statistics calculated from the immunophenotyping data produced discrete peaks in the LCL sets. The peak in chromosome 19q13.3 for the CTL-3B6 set showed the theoretically maximum χ2 value of 50 (not reached in 100 000 permutations) at rs3027952, which was mapped within a small LD block of approximately 182 kb, or more narrowly within its 35 kb sub-block containing a single gene, SLC1A5, as a candidate mHag gene (Figure 3B). In fact, when expressed in 293T cells with HLA-B*4002 transgene, recipient-derived, but not donor-derived, SLC1A5 cDNA was able to stimulate IFN-γ secretion from CTL-3B6 (Figure 4A), indicating that SLC1A5 actually encodes the target mHag recognized by CTL-3B6. Conventional epitope mapping using a series of deletion mutants of SLC1A5 cDNA finally identified an undecameric peptide, AEATANGGLAL, as the minimal epitope (Figure 4A). The donor-type AEPTANGGLAL induced IFN-γ with a 2-log lower efficiency, suggesting that AEPTANGGLAL may not be transported efficiently into the ER because endogenous expression of a minigene encoding AEPTANGGLAL was not recognized by CTL-3B1 (Figure 4B). Unfortunately, although the peak statistic value showed the theoretically maximum value for this data set, it did not conform to the relevant SNP for this mHag (rs3027956) due to high genotyping errors of the HapMap data at this particular SNP. However, the result of our resequencing showed complete concordance with the presence of the rs3027956 SNP and recognition in the cytotoxicity assay (Table S4).

Epitope mapping. (A) Determination of the SLC1A5 epitope by deletion mapping. Plasmids encoding recipient full-length SLC1A5, exon 1 of recipient and donor, exon 1 with various N- and C-terminus deletions around the amino acid encoded by SNP rs51983014, and minigenes encoding AEATANGGLAL and its allelic counterpart AEPTANGGLAL were constructed and transfected into HLA-B*4002–transduced 293T cells. Interferon (IFN)-γ was assessed by ELISA (right column) after coculture of CTL-3B1 with 293T transfectants. (B) Epitope reconstitution assay with synthetic undecameric peptides, AEATANGGLAL and AEPTANGGLAL. (C) Structure of the UGT2B17 gene and screening of UGT2B17 cDNA and deletion mutants. HLA-A*0206–transduced 293T cells were transfected with each plasmid and cocultured with CTL-2B1. IFN-γ production from CTL-1B2 (right column) indicated that the epitope was likely encoded by nucleotides 1448-1586, including 30 nucleotides from position 1566 that could potentially encode part of the epitope. (D) Epitope prediction using the HLA Peptide Binding Predictions algorithm.19 Because HLA-A*0201 and -A*0206 have similar peptide binding motifs,30 the algorithm for HLA-A*0201 was used to predict candidate epitopes recognized by CTL-1B2. Values in parentheses indicate the predicted half-time of dissociation. (E) Epitope reconstitution assays with graded concentrations of synthetic nonameric peptides shown in panel D.
Epitope mapping. (A) Determination of the SLC1A5 epitope by deletion mapping. Plasmids encoding recipient full-length SLC1A5, exon 1 of recipient and donor, exon 1 with various N- and C-terminus deletions around the amino acid encoded by SNP rs51983014, and minigenes encoding AEATANGGLAL and its allelic counterpart AEPTANGGLAL were constructed and transfected into HLA-B*4002–transduced 293T cells. Interferon (IFN)-γ was assessed by ELISA (right column) after coculture of CTL-3B1 with 293T transfectants. (B) Epitope reconstitution assay with synthetic undecameric peptides, AEATANGGLAL and AEPTANGGLAL. (C) Structure of the UGT2B17 gene and screening of UGT2B17 cDNA and deletion mutants. HLA-A*0206–transduced 293T cells were transfected with each plasmid and cocultured with CTL-2B1. IFN-γ production from CTL-1B2 (right column) indicated that the epitope was likely encoded by nucleotides 1448-1586, including 30 nucleotides from position 1566 that could potentially encode part of the epitope. (D) Epitope prediction using the HLA Peptide Binding Predictions algorithm.19 Because HLA-A*0201 and -A*0206 have similar peptide binding motifs,30 the algorithm for HLA-A*0201 was used to predict candidate epitopes recognized by CTL-1B2. Values in parentheses indicate the predicted half-time of dissociation. (E) Epitope reconstitution assays with graded concentrations of synthetic nonameric peptides shown in panel D.
Similarly, 13 mHag+ and 32 mHag− LCLs were identified from the screening of 45 JPT LCLs from the same panel using CTL-1B2 (Figure S3C; Tables S2,S5). The χ2 statistics calculated from the immunophenotyping data produced bimodal discrete peaks with this LCL set. The target locus for the mHag recognized by CTL-1B2 was identified at a peak (max χ2 = 44, not reached in 100 000 permutations) within a 598-kb block on chromosome 4q13.1, coinciding with the locus for a previously reported mHag, UGT2B1718 (Figures 2C, 3C). In fact, our epitope mapping using UGT2B17 cDNA deletion mutants (Figure 4C), prediction of candidate epitopes by HLA-binding algorithms19 (Figure 4D) and epitope reconstitution assays (Figure 4E), successfully identified a novel nonameric peptide, CVATMIFMI. Of particular note, this mHag was not defined by a SNP but by a CNV (ie, a null allele18 ) that is in complete LD with the SNPs showing the maximum χ2 value (Table S5). Transplanted T cells from donors lacking both UGT2B17 alleles are sensitized in recipients possessing at least 1 copy of this gene.18 Although LD between SNPs and CNVs has been reported to be less prominent,21 this is an example where a CNV trait could be captured by a SNP-based genome-wide association study.
The recent generation of the HapMap has had a profound impact on human genetics.13,15 In the field of medical genetics, the HapMap is a central resource for the development of theories and methods that have made well-powered, genome-wide association studies of common human diseases a reality.22-28 The HapMap samples provide not only an invaluable reference for genetic variations within human populations, but highly qualified genotypes that enable gene-wide scanning. Here, we have demonstrated how effectively HapMap resources can be used for genetic mapping of clinically relevant human traits. No imputations and tagging strategies are required25,28 and the potential loss of statistical power due to very limited sample sizes is circumvented by accurate immunologic detection of the traits.
Using publicly available HapMap resources, high-throughput identification of mHag genes is possible without highly specialized equipment or expensive microarrays. Except for clinically irrelevant mHags with very low allele frequencies (eg, MAF < 5%), the target of a given CTL can be sensitively mapped within a mean LD block size, typically containing just a few candidate genes. The methodology described here will facilitate construction of a large panel of human mHags including those presented by MHC class II molecules, and promote our understanding of human allo-immunity and development of targeted allo-immune therapies for hematologic malignancies.1,2 The HapMap scan approach may be useful for exploring other genetic traits or molecular targets (eg, differential responses to some stress or drugs), if they can be discriminated accurately through appropriate biologic assays. In this context, the recent report that we may reprogram the fate of terminally differentiated human cells29 is encouraging, indicating possible exploration of genotypes that are relevant to cell types other than immortalized B cells.
An Inside Blood analysis of this article appears at the front of this issue.
The online version of this article contains a data supplement.
The publication costs of this article were defrayed in part by page charge payment. Therefore, and solely to indicate this fact, this article is hereby marked “advertisement” in accordance with 18 USC section 1734.
Acknowledgments
We thank Drs P. Martin and W. Ho for critically reading the manuscript; and Ms Keiko Nishida, Dr Ayako Demachi-Okamura, Dr Yukiko Watanabe, Ms Hiromi Tamaki, and the staff members of the transplant centers for their generous cooperation and technical expertise.
This study was supported in part by a grant for Scientific Research on Priority Areas (B01; no.17016089) from the Ministry of Education, Culture, Science, Sports, and Technology, Japan; grants for Research on the Human Genome, Tissue Engineering Food Biotechnology and the Second and Third Team Comprehensive 10-year Strategy for Cancer Control (no. 26) from the Ministry of Health, Labor, and Welfare, Japan; and a grant-in-aid from Core Research for Evolutional Science and Technology (CREST) of Japan.
Authorship
Contribution: M.K. performed most of immunologic experiments and analyzed data and wrote the manuscript; Y.N. performed the majority of genetic analyses and analyzed the data; H.T., T.K., M.Y., S.M. and K.Tsujimura performed research; K.Taura contributed to the computational simulation; Y.I., Taro T., K.M., Y.K. and Y.M. collected clinical data and specimens; T.I., H.T., S.R.R., Toshitada T. and K.K. contributed to data analysis and interpretation, and writing of the article; and Y.A. and S.O. supervised the entire project, designed and coordinated most of the experiments in this study, and contributed to manuscript preparation.
Conflict-of-interest disclosure: The authors declare no competing financial interests.
Correspondence: Seishi Ogawa, MD, PhD, Department of Hematology and Oncology, Department of Regeneration Medicine for Hematopoiesis, The 21st Century COE Program, Graduate School of Medicine, University of Tokyo, 7-3-1, Hongo, Bunkyo-ku, Tokyo 113-8655, Japan; e-mail: sogawa-tky@umin.ac.jp; or Yoshiki Akatsuka, MD, PhD, Division of Immunology, Aichi Cancer Center Research Institute, 1-1 Kanokoden, Chikusa-ku, Nagoya 464-8681, Japan; e-mail: yakatsuk@aichi-cc.jp.

This feature is available to Subscribers Only
Sign In or Create an Account Close Modal