Abstract
Introduction: One of the hallmarks of human cancer is genomic instability, most often prevalent as chromosomal instability (CIN). CIN is defined by an elevated frequency of the occurrence of novel chromosomal aberrations and therefore, in contrast to aneuploidy, represents a rate rather than a state of genomic aberration. CIN has not only been implicated in the generation of aneuploidy, but also has been shown to play a pivotal role in both early malignant transformation and tumor progression. However, data on the presence and the extent of CIN in a defined population of primary malignant cells in different stages of disease are lacking. Myelodysplastic syndromes (MDS) are clonal stem-cell disorders characterized by ineffective hematopoiesis in one or more hematopoietic lineages and a high propensity for transformation into acute myeloid leukemia (AML). Furthermore, recurrent chromosomal aberrations are shared by both MDS and AML. Given their premalignant state, their frequent progression to AML, and their origin in an easy accessible stem-cell compartment, we considered MDS as a suitable model to study the role of CIN in tumor initiation and progression.
Methods: We isolated CD34-positive cells from 18 patients with MDS, 30 patients with AML, 9 healthy controls, and 8 control patients with malignancies not involving the bone marrow. Patient samples were first objected to Ficoll density separation. Next, the CD34-positive cells were magnetically sorted (MACS) using CD34-microbeads. Purity of the sorted cells was controlled by flow cytometry (FACS) and constantly was greater 85%. Fluorescence in situ hybridization (FISH) was then performed, hybridizing centromeric probes for chromosomes 1, 6, 7, and 8, and subtelomeric probes for chromosomes 6 and 8 to the CD34-positive cells. Finally, the cell-to-cell variability of the chromosome content as well as the extent of structural instability was quantified by determining the modal signal number for each FISH probe and the median percentage of cells differing thereof.
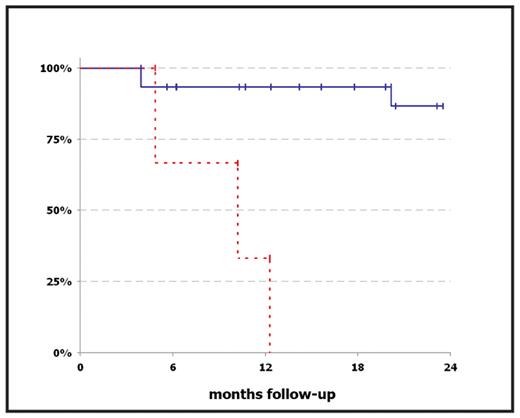
Results: In this study, we were able to identify a group of patients with numerical CIN values that were elevated more than two standard deviations relative to the mean of healthy control subjects (5.8% + 3.0%). This group of patients with elevated CIN values had a worse outcome as compared to the patients with normal CIN values: All three patients in the ‘high CIN’ group reached the endpoint, defined as progression to AML (two patients) or death (one patient), within 4.9, 10.2, and 12.3 months after sample collection, respectively, whereas among the remaining 15 patients with normal CIN values there was only one case of death (3.9 months after sample collection) and one patient with progression to AML (20.1 months after sample collection) at a median follow-up of 14.2 months (Figure 1). Furthermore, we were able to demonstrate an increase of CIN preceding the transformation to AML in one patient with MDS RAEB-2 over the course of five months. Eventually, our results neither did indicate a role for structural CIN in MDS disease progression, nor did they show a difference between clinically defined subgroups, indicating that CIN may represent a novel prognostic marker independent of the conventional classification criteria for MDS.
Conclusion: Our data indicate a possible role for numerical CIN in the progression of MDS to AML. Moreover, a CD34-positive cell-specific increase of CIN might be a predictor for the subsequent disease progression to AML. Therefore, the quantification of CIN in hematopoietic progenitor cells might be valuable for identifying patients with high-risk MDS more reliably.
Kaplan-Meier-Plot comparing the outcome of MDS patients with elevated CIN values (red dashed line) and normal CIN values (blue solid line). After a median follow-up of 14.2 months, all but two patients in the “low CIN” group had stable disease, whereas all three patients with elevated CIN values reached the endpoint, defined as progression to AML or death.
Kaplan-Meier-Plot comparing the outcome of MDS patients with elevated CIN values (red dashed line) and normal CIN values (blue solid line). After a median follow-up of 14.2 months, all but two patients in the “low CIN” group had stable disease, whereas all three patients with elevated CIN values reached the endpoint, defined as progression to AML or death.
Disclosures: No relevant conflicts of interest to declare.
Author notes
Corresponding author


This feature is available to Subscribers Only
Sign In or Create an Account Close Modal