Abstract
Achievement of complete remission (CR), with <5% blasts in bone marrow (BM), and peripheral blood platelet count >100K/ml remains the gold standard achievement of chemotherapy for AML. A significant fraction of patients proceed to HSCT with <5% blasts but without ever achieving platelet counts >100K/ml (CRp). It is possible that with new AML therapies, the proportion of patients in such a situation will increase. We hypothesized that achievement of CRp has a worse prognostic connotation than ‘classically’ defined CR, and sought to investigate this hypothesis in a cohort of AML patients transplanted between 7/1995 to 12/2007 at our institution (N=427).
Methods: Patients were eligible for this analysis if they were in the following disease status at transplantation: compete remission (CR); first CR (CR1; <5% BM blasts and platelet count >100K/ml); second CR (CR2); first CRp (CRp1): patients that had <5% BM blasts but no platelet recovery following induction chemotherapy; primary induction failure (PIF): no CR with induction therapy (>5% and no platelet recovery); CRp2: patients that after first relapse achieved <5% BM blasts with salvage chemotherapy, but no platelet recovery; refractory: patients in first relapse that did not respond to salvage therapy (rel). A minimum of 30 days from the last day of chemotherapy to start of conditioning regimen elapsed for patients to be scored as CRp. Diagnosis were AML (n=376) or high-risk MDS (n=51). Conditioning included TBI-based (2%; n=8), oral/IV busulfan based-ablative regimens (61%; n=261), fludarabine/melphalan-based reduced intensity conditioning regimens (RIC) (36%; n=153), or other (1%; n=5). Fifty-eight percent of patients received matched sibling transplants (n=248), while 42% (n=179) received unrelated donor (UD) HSCT. Tacrolimus and methotrexate were used for graft-versus-host disease (GVHD) prophylaxis. ATG was administered to those who received grafts from UD.
Results: Median age was 50 years (range 6–74); 51% of patients were 50 years or older (n=218); 55% were male (n=236). Disease status at HSCT was CR1 in 38% (n=164), CR2 in 24% (n=102), CRp1 in 11% (n=48), CRp2 in 7% (n=30); PIF 11% (n=47), and rel1 8% (n=36). Cytogenetics data were available for 90% (n=386) of patients. The proportion of poor-risk cytogenetics was comparable in patients who were in CR1 (39%) and CRp1 (44%), p=0.3, and in patients who were in CR2 (15%) and CRp2 (24%) p=0.2. Source of stem cells was BM in 41% of patients (n=174) and peripheral blood in 59% of patients (n=253). Ninety-six percent of patients engrafted. Fifty-one percent of patients have died (n=219); actuarial survival at 36-months was 49% for all patients. Thirty-one percent of patients (n=134) have progressed. Median follow-up among survivors is 42 months (range 3–131months).
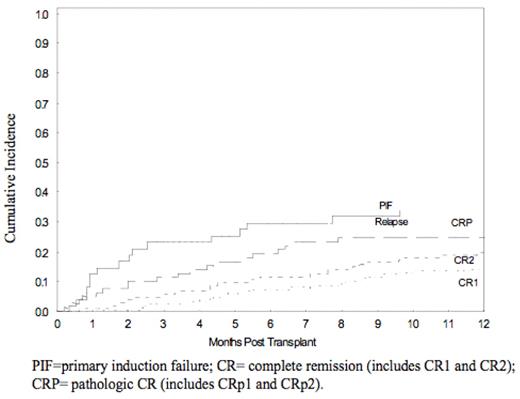
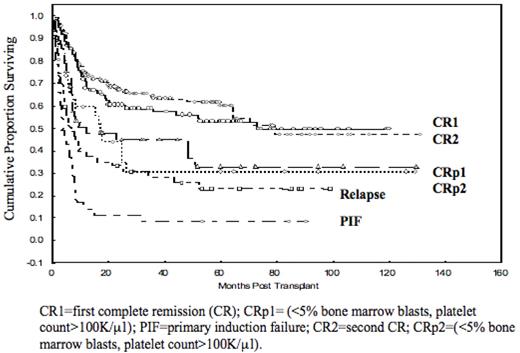
Non-relapse mortality (NRM) (figure 1), overall survival (OS) (figure 2), and hazard ratios for OS and NRM at 1-year (Table) favored patients who were transplanted in CR1 (vs. patients in CRp1 or PIF), or in CR2 (vs. CRp2 or rel1).
Conclusion: In this cohort of patient with AML and MDS, patients in CR (CR1 or CR2) demonstrated significantly better OS and NRM compared to patients who underwent HSCT in CRp (CRp1 or CRp2). CRp conferred an intermediate prognostic status, better than refractory disease, but significantly worse than ‘classic’ CR. Our results suggest that achieving a CR prior to HSCT should remain the gold standard for patient in AML or MDS receiving allogeneic HSCT.
Table. Hazard Ratios (HR) for non-relapse mortality (NRM) and overall survival (OS) at 1 year.
| . | NRM . | OS . |
|---|---|---|
| CR=complete remission; CRp=pathologic CR; PIF=primary induction failure. | ||
| CR1 (n=164) | Reference | Reference |
| CR2 (n=102) | 1.4 (p=0.3) | 1.3 (p=0.3) |
| CRp1 (n=48) | 2.4 (p=0.01) | 2.4 (p=0.001) |
| CRp2 (n=30) | 1.7 (p=0.2) | 1.9 (p=0.05) |
| PIF (n=47) | 3.7 (p=0.001) | 3.6 (p=0.001) |
| First relapse (n=36) | 4.6 (p=0.001) | 6.7 (p=0.001) |
NRM by Pre-Transplant Remission Status
OS by Pre-Transplant Remission Status
Disclosures: No relevant conflicts of interest to declare.
Author notes
Corresponding author


This feature is available to Subscribers Only
Sign In or Create an Account Close Modal