Abstract
Polycythemia is often associated with erythropoietin (EPO) overexpression and defective oxygen sensing. In normal cells, intracellular oxygen concentrations are directly sensed by prolyl hydroxylase domain (PHD)–containing proteins, which tag hypoxia-inducible factor (HIF) α subunits for polyubiquitination and proteasomal degradation by oxygen-dependent prolyl hydroxylation. Here we show that different PHD isoforms differentially regulate HIF-α stability in the adult liver and kidney and suppress Epo expression and erythropoiesis through distinct mechanisms. Although Phd1−/− or Phd3−/− mice had no apparent defects, double knockout of Phd1 and Phd3 led to moderate erythrocytosis. HIF-2α, which is known to activate Epo expression, accumulated in the liver. In adult mice deficient for PHD2, the prototypic Epo transcriptional activator HIF-1α accumulated in both the kidney and liver. Elevated HIF-1α levels were associated with dramatically increased concentrations of both Epo mRNA in the kidney and Epo protein in the serum, which led to severe erythrocytosis. In contrast, heterozygous mutation of Phd2 had no detectable effects on blood homeostasis. These findings suggest that PHD1/3 double deficiency leads to erythrocytosis partly by activating the hepatic HIF-2α/Epo pathway, whereas PHD2 deficiency leads to erythrocytosis by activating the renal Epo pathway.
Introduction
Erythropoiesis in response to hypoxia is a highly regulated adaptive process that maintains oxygen homeostasis in vivo, and its deregulation can lead to pathologic consequences. A large number of studies have shown that hypoxia-induced polycythemia in human and animals is associated with erythropoietin (Epo) up-regulation,1-9 possibly due to the accumulation of hypoxia-inducible factors (HIFs).10-12
HIFs are heterodimeric transcription factors consisting of one of the 3 oxygen-sensitive α subunits and a common and stable β subunit.13-15 As a fundamental mechanism for sensing oxygen concentration, the stability of α subunits is regulated through the hydroxylation of specific prolyl residues in oxygen-dependent degradation domains by prolyl hydroxylase domain (PHD) containing proteins, which are enzymes belonging to the 2-oxoglutarate/iron dependent dioxygenase superfamily.16-20 Hydroxylated HIF-α subunits are recognized by von Hippel-Lindau (VHL) protein for polyubiquitination and proteasomal degradation.17,21-23
Given the importance of PHDs in regulating HIF-α abundance, they are expected to play critical roles in processes such as erythropoiesis, angiogenesis, and metabolism, which are essential for animals to adapt to hypoxic environment or cope with localized tissue hypoxia due to obstructed circulation. Although there is only a single HIF-specific prolyl hydroxylase in Caenorhabditis elegans or Drosophila melanogaster, human and other mammals have at least 3 PHD isoforms, referred to as PHD1/EGLN2/HPH3, PHD2/EGLN1/HPH2, and PHD3/EGLN3/HPH1.16,17,24 As prolyl-specific hydroxylases, all 3 isoforms efficiently hydroxylate HIF-α subunits under normoxia.16,17,25 In addition, forced overexpression of each PHD isoform could all suppress HIF-dependent transcriptional activity.26
However, differences do exist among different PHDs in terms of their expression profiles,25,27 subcellular localization patterns,28 and differential activities toward HIF-1α or HIF-2α.29 Therefore, it is likely that different PHD isoforms may have distinct functions in mediating hypoxia responses. For instance, in many cell lines cultured under normoxia, PHD2 is the main isoform causing HIF-α degradation, partly because it is most abundantly expressed.30 Under hypoxia, however, a negative feedback regulatory mechanism is activated to up-regulate Phd2 and Phd3 transcription.31 Because PHD3 is present at very low levels under normoxia, hypoxia-induced expression is particularly prominent for this isoform. In short, because of differential regulation for different PHD isoforms, it is important to address whether individual PHD isoforms play specific roles in regulating various pathophysiologic processes in vivo.
Although we have previously shown that PHD2 is the most critical isoform in both mouse embryos and the adult vascular system,32,33 essential PHD isoforms controlling blood homeostasis have not been identified. Heterozygosity of a point mutation in the human PHD2 gene (P317R, which reduces hydroxylase activity) has been reported to correlate with the etiology of polycythemia.12 However, contributions by other PHD isoforms remain unknown. To dissect the roles of different isoforms in polycythemia-related pathologic conditions, we analyzed blood phenotypes in mice carrying the following mutations: Phd1−/−, Phd3−/−, Phd1−/−/Phd3−/− (Phd1/3 double knockout, or Phd1/3 DKO), and Phd2 somatic mutation in most adult tissues. Our data demonstrate that blood homeostasis in adult mice is mostly maintained by PHD2 but further modulated by combined actions of PHD1 and PHD3.
Methods
Breeding and genotyping of mice
All animal procedures were approved by Institutional Animal Care and Use Committees at the University of Connecticut Health Center and University of Pennsylvania in compliance with Animal Welfare Assurance. The generation of targeted alleles for Phd1, Phd2, and Phd3 loci and methods for genotype determination have been described previously.32,33 Because adult Phd1−/− or Phd3−/− knockout mice were viable, they were used directly for phenotype and molecular analyses. On the other hand, because of in utero death of Phd2−/− embryos, adult mice carrying the Phd2 somatic mutation were generated by Cre-mediated recombination. Two Rosa26CreERT2 mouse lines were used in this study (described in Takeda et al33 and Seibler et al34 , respectively). In both mouse lines, CreERT2 cDNA inserted into the Rosa26 locus is ubiquitously and constitutively expressed, and the latent recombinase function of the CreERT2 protein is activated by tamoxifen-induced conformational changes.33,34
Hematologic and serologic analyses
Peripheral blood samples were collected from adult mice via inferior vena cava immediately after they were euthanized. Blood samples were immediately mixed with EDTA (ethylenediaminetetraacetic acid) and complete blood counts were measured with Advia 2120 (Bayer, Pittsburgh, PA) in the clinical laboratory at the Hartford Hospital (Hartford, CT). Serum Epo levels were determined by enzyme-linked immunosorbent assays (ELISA) using Quantikine Mouse/Rat Epo Immunoassay kit (MEP00; R&D Systems, Minneapolis, MN). To obtain serum, blood samples were left to clot for 2 hours at room temperature followed by centrifugation for 15 minutes at 1000g. Serum samples were stored at −80°C until use.
RT-PCR and quantitative real-time RT-PCR analyses
Total RNA samples were prepared using TRIzol reagent (Invitrogen, Carlsbad, CA) according to manufacturer's protocol. Reverse transcriptase-polymerase chain reaction (RT-PCR) or quantitative real-time RT-PCR (Q-PCR) analyses were performed as reported previously.32 Q-PCR was performed using the SYBR green PCR master mix (Applied Biosciences, Foster City, CA) and the ABI PRISM 7900HT Sequence Detection System (Applied Biosciences). Epo Q-PCR data were presented as relative values to Hprt Q-PCR signals. Q-PCR Primers for Epo were 5′-TAGCCTCACTTCACTGCTTCG-3′ and 5′-GCTTGCAGAAAGTATCCACTGT-3′; Hprt primers were 5′-TCAGTCAACGGGGGACATAAA-3′ and 5′-GGGGCTGTACTGCTTAACCAG-3′.
Western blotting analysis
For Western blotting, total lysates or nuclear protein extracts from various tissues were prepared as reported previously.33 The following antibodies were used: anti-HIF-1α and anti-HIF-2α (NB100-449 and NB100-122; Novus Biologicals [Littleton, CO]); anti-PHD1 and anti-PHD3 (NB100-310 and NB100-303; Novus Biologicals); anti-actin (sc-1616; Santa Cruz Biotechnology, Santa Cruz, CA). Anti-mouse PHD2 antibody was produced as reported previously.32
Flow cytometry
Monoclonal antibodies (mAbs) used in flow cytometry have been described previously,35,36 including anti-B lineage cell mAb, anti-CD45R (B220) (RA3-6B2); anti–monocyte:macrophage mAb, anti-CD11b (M1/70); anti-granulocyte mAb, anti–Ly-6C/G (RB6-8C5); anti–T-cell-lineage antibodies, mAbs anti-CD4 (GK1.5) and anti-CD8 (53.6.7); anti–erythroid progenitor monoclonal antibody (Ter119); anti–NK cell antibodies, NK1.1 (PK136); and anti–progenitor cells: Sca1 (E13.161.7), anti–c-Kit/CD117 (2B8). All these antibodies were obtained directly conjugated to fluorochromes from commercial vendors including BD Pharmingen (San Diego, CA), e-Biosciences (San Diego, CA), and Invitrogen.
Labeling of cells for cytofluorometric analysis was performed by standard staining procedures wherein directly conjugated or unconjugated primary antibodies plus second-step reagents were sequentially added to cell preparations. All antibodies were optimized in terms of their concentration and titration. All staining reactions were done on ice, to prevent quenching of signals. Dead cells were identified by their ability to incorporate propidium iodide. Flow cytometry analysis was performed in a FACSCalibur multicolor analyzer (BD Biosciences, San Jose, CA).
Methylcellulose cultures
Cell suspensions were prepared from bone marrow, spleen, and liver in Iscove-modified Dulbecco medium (Invitrogen) supplemented with 2% fetal bovine serum. Aliquots were then plated in methylcellulose media with recombinant cytokines for colony assays of murine cells (Methocult GF3434; Stem Cell Technologies, Vancouver, BC). The media used contained stem cell factor, interleukin (IL)-3, IL-6 and erythropoietin and allowed us to evaluate the activity of early myeloerythroid progenitors. The plating was done according to the instructions of the manufacturer, using between 2 × 10⁴ and 105 cells per 35-mm tissue culture dish. Cultures were placed in a humidified chamber and incubated at 37°C with 5% CO2. The total numbers of colonies (colony-forming units in culture) were counted between days 10 and 14 after plating.
Statistical analysis
Statistical analyses were performed by Student t test. Data are shown as means plus or minus SEM; P less than .05 was considered to be statistically significant.
Results
In previous studies, we generated mice carrying targeted disruptions in genes encoding PHD1, -2, and -3.32,33 Here, we used these mice to evaluate roles of different PHD isoforms on blood homeostasis. Because Phd1−/− and Phd3−/− mice were viable and fertile, we crossed them to obtain Phd1+/−/Phd3+/− mice, which were further intercrossed to give rise to Phd1−/−/Phd3−/− (Phd1/3 DKO) mice along with progenies of various other expected genotypes, among which wild-type littermates were further intercrossed to obtain control mice. Although further crosses between Phd1/3 DKO mice resulted in generally small litter sizes (typically 3 to 4 pups per litter), we have not observed increased postnatal lethality of live born progenies (∼12 months as of manuscript completion). Whether the reduction in litter sizes was due to embryonic death or reduced fertilization remains to be examined.
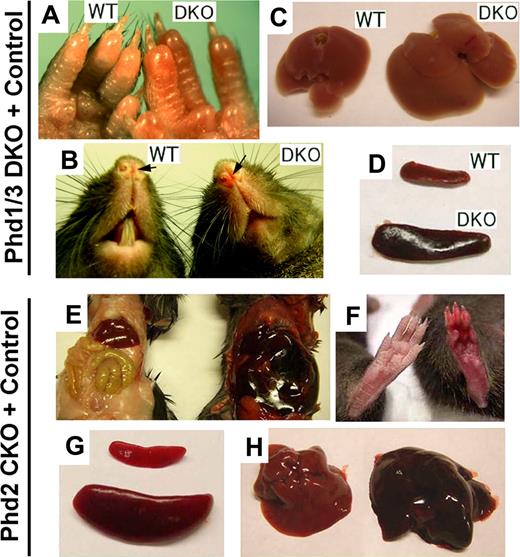
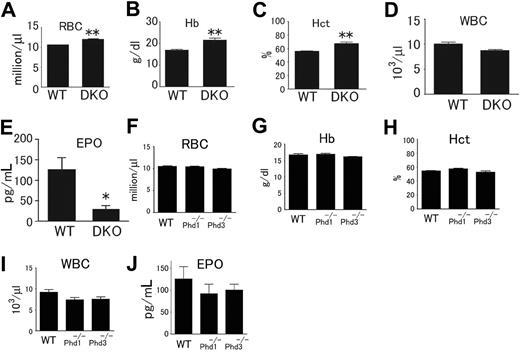
In this study, we focused on blood phenotypes in adult mice. At 6 weeks or later after birth, Phd1/3 DKO mice had significantly reddened paws (Figure 1A) and snouts (Figure 1B), especially in the area just under the nostrils. These mice also displayed enlarged livers (Figure 1C: wild-type, 1.4 ± 0.13 g; DKO, 2.2 ± 0.2 g; n = 6, P < .001) and splenomegaly (Figure 1D: wild-type, 95 ± 6 mg; DKO, 204 ± 14 mg; n = 6, P < .005). These morphologic changes were consistent with elevated erythropoietic activities. Indeed, peripheral blood samples from these mice had significantly increased numbers of red blood cells (RBCs), along with higher hemoglobin concentrations (Figure 2A,B). Hematocrit values increased to .67 (Figure 2C), which is significantly higher than wild-type average of approximately .53. However, the number of white blood cells (WBC) did not display statistically significant changes (Figure 2D). We were surprised to find that despite increased erythropoietic activities, serum Epo levels were reduced (Figure 2E). In contrast to significant blood defects in Phd1/3 DKO mice, Phd1−/− and Phd3−/− mice had no apparent hematologic abnormalities (Figure 2F to J).
Erythemic appearances in Phd1/3 DKO and Phd2 CKO mice. (A-D) Erythemic external appearance (reddish paw and snout, A and B, respectively), and enlarged liver (C) and spleen (D) in Phd1/3 DKO mice. WT, wild-type; DKO, Phd1/3 double knockout mice. (E-H) Phd2 CKO mice and Phd2f/f control mice. Abdomens (E) and paws (F) at approximately 6 weeks after tamoxifen treatment of both CKO and Phd2f/f mice. Note the necrotic intestine and red paw in Phd2 CKO mice. Left, Phd2f/f; right, Phd2 CKO. (C) Spleens. Top, Phd2f/f; bottom, Phd2 CKO. (D) Livers. Left, Phd2f/f, right, Phd2 CKO. Images were taken with a CoolSNAP charge-coupled device digital camera (Photometrics-Roger Scientific, Tucson, AZ) attached to a Leica MZFLIII stereomicroscope (Leica Microsystems, Heerbrugg, Switzerland). A single objective lens (Leica Plan 1.0, 10× magnification, Leica Microsystems) was used to obtain the images. Openlab (Improvision, Lexington, MA) was used for initial image acquisition, and Photoshop 7.0 (Adobe Systems, San Jose, CA) was used for subsequent processing.
Erythemic appearances in Phd1/3 DKO and Phd2 CKO mice. (A-D) Erythemic external appearance (reddish paw and snout, A and B, respectively), and enlarged liver (C) and spleen (D) in Phd1/3 DKO mice. WT, wild-type; DKO, Phd1/3 double knockout mice. (E-H) Phd2 CKO mice and Phd2f/f control mice. Abdomens (E) and paws (F) at approximately 6 weeks after tamoxifen treatment of both CKO and Phd2f/f mice. Note the necrotic intestine and red paw in Phd2 CKO mice. Left, Phd2f/f; right, Phd2 CKO. (C) Spleens. Top, Phd2f/f; bottom, Phd2 CKO. (D) Livers. Left, Phd2f/f, right, Phd2 CKO. Images were taken with a CoolSNAP charge-coupled device digital camera (Photometrics-Roger Scientific, Tucson, AZ) attached to a Leica MZFLIII stereomicroscope (Leica Microsystems, Heerbrugg, Switzerland). A single objective lens (Leica Plan 1.0, 10× magnification, Leica Microsystems) was used to obtain the images. Openlab (Improvision, Lexington, MA) was used for initial image acquisition, and Photoshop 7.0 (Adobe Systems, San Jose, CA) was used for subsequent processing.
Hematologic parameters of peripheral blood from Phd1−/−, Phd3−/−, and Phd1/3 DKO mice. (A-E) Phd1/3 DKO and wild-type control mice. RBC indicates red blood cells; Hb, hemoglobin; Hct, hemtocrit; and WBC, white blood cells. n = 6. (E) ELISA for serum Epo levels. n = 4. **P < .01; *P < .05. (F-J) Normal blood properties in Phd1−/− or Phd3−/− mice. (A-I) Hematologic parameters of peripheral blood indicated in figures from wild-type (WT), Phd1−/−, or Phd3−/− mice. P > .05 for all pairs of comparisons. n = 6. (J) ELISA for serum Epo levels in WT, Phd1−/−, or Phd3−/− mice. n = 6. Error bars represent SEM.
Hematologic parameters of peripheral blood from Phd1−/−, Phd3−/−, and Phd1/3 DKO mice. (A-E) Phd1/3 DKO and wild-type control mice. RBC indicates red blood cells; Hb, hemoglobin; Hct, hemtocrit; and WBC, white blood cells. n = 6. (E) ELISA for serum Epo levels. n = 4. **P < .01; *P < .05. (F-J) Normal blood properties in Phd1−/− or Phd3−/− mice. (A-I) Hematologic parameters of peripheral blood indicated in figures from wild-type (WT), Phd1−/−, or Phd3−/− mice. P > .05 for all pairs of comparisons. n = 6. (J) ELISA for serum Epo levels in WT, Phd1−/−, or Phd3−/− mice. n = 6. Error bars represent SEM.
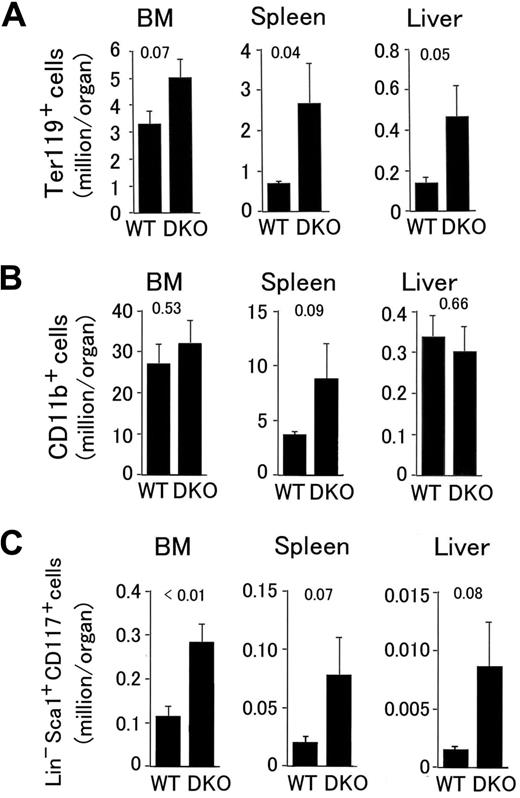
Next, we analyzed the distribution of various hematopoietic markers by flow cytometry. In Phd1/3 DKO spleens and livers, erythroid progenitors (Ter119+) increased to 4.3- and 3.6-fold of normal values, respectively, and a strong trend of increase also existed in the bone marrow (BM; Figure 3A). The number of splenic myeloid cells (CD11b+) also trended upward (Figure 3B), and the number of BM-derived cells displaying surface markers characteristic of hematopoietic stem cells (Lin− Sca-1+ CD117+; referred to as HSC from here on) increased to 2.4-fold of normal values (Figure 3C). Furthermore, strong upward trends were also observed for cells with HSC markers in Phd1/3 DKO livers and spleens (Figure 3C). Although methylcellulose colony formation assay did not confirm increased hematopoietic activity (colonies per 105 cells: wild-type BM, 440 ± 50; DKO BM, 530 ± 55; n = 6, P = .33), the existence of increased BM-derived Ter119+ and Lin− Sca-1+ CD117+ cells nonetheless suggests altered bone marrow properties in Phd1/3 DKO mice.
Flow cytometry analyses of hematopoietic progenitors in Phd1/3 DKO mice. (A) Erythroid (Ter119+); (B) myeloid (CD11b+); (C) HSC (Lin− Sca-1+ CD117+). Bone marrow (BM), spleen, and liver samples were analyzed. Total cell numbers in each organ are shown; n = 6 to 7. P values are indicated above the bars. Error bars represent SEM.
Flow cytometry analyses of hematopoietic progenitors in Phd1/3 DKO mice. (A) Erythroid (Ter119+); (B) myeloid (CD11b+); (C) HSC (Lin− Sca-1+ CD117+). Bone marrow (BM), spleen, and liver samples were analyzed. Total cell numbers in each organ are shown; n = 6 to 7. P values are indicated above the bars. Error bars represent SEM.
To evaluate the role of PHD2 in hematopoiesis, we generated Phd2 conditional knockout (CKO) mice by tamoxifen-induced deletion of floxed (f) exon 2 in Phd2f/f/Rosa26+/CreERT2 mice (Figure S1A, available on the Blood website; see the Supplemental Materials link at the top of the online article) and examined blood phenotypes 6 weeks later. In these mice, erythemic appearances in various tissues were even more apparent than in Phd1/3 DKO mice (Figure 1E and F). Spleens in Phd2 CKO mice were significantly enlarged relative to those in Phd2f/f mice (Phd2f/f, 108 ± 19 mg; Phd2 CKO, 528 ± 69 mg; n = 6, P < .01; Figure 1G). The Phd2f/f control mice were also treated with tamoxifen in parallel to Phd2 CKO mice to rule out potential pharmacologic contributions by the drug. In addition, the liver was also larger and more strongly colored than normal (Figure 1H). Phd2 CKO mice began to die approximately 40 days after tamoxifen treatment, and the death rate reached 90% approximately 90 days after induced knockout (Figure S1B). In addition, Phd2 CKO mice displayed significant vascular phenotypes that have been described elsewhere.33
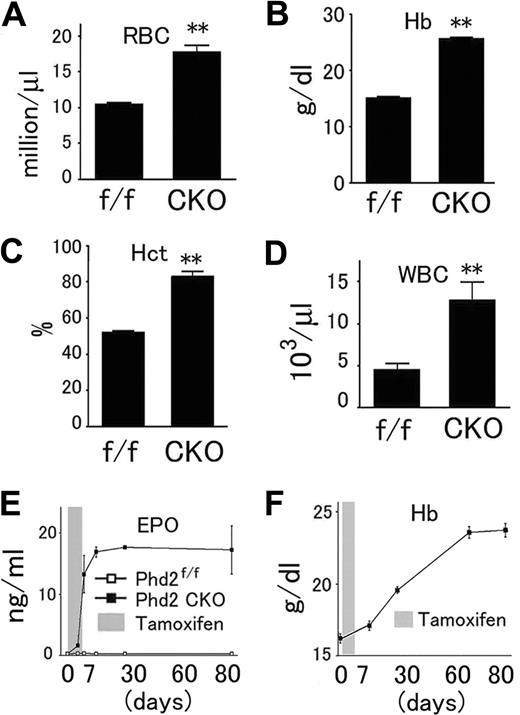
To determine whether Phd2 CKO mice had defects in blood formation or homeostasis, we compared their hematologic parameters with Phd2f/f control mice. Phd2 CKO mice had increased numbers of RBCs per unit volume (Figure 4A), higher hemoglobin concentrations (Figure 4B), and drastically elevated hematocrit values (.83; Figure 4C). In addition, the number of WBCs were also significantly increased (Figure 4D). Serum Epo levels reached approximately 230-fold increases above basal levels within 2 weeks of Phd2 knockout (Figure 4E), and there was an accompanying increase in hemoglobin concentrations (Figure 4F).
Abnormal hematologic parameters of peripheral blood from Phd2 CKO mice. (A-D), Phd2 CKO and Phd2f/f control mice were all treated with tamoxifen at 6 weeks of age and analyzed after another 6 weeks. Red blood cells, hemoglobin concentrations, hematocrit values, and white blood cells were all significantly increased. n = 6. **, P < 0.01. (E) Time course of serum Epo level increases as measured by ELISA. n = 3 at each time point. (F) Time course of increases in hemoglobin concentration. n = 3 at each time point. Error bars represent SEM.
Abnormal hematologic parameters of peripheral blood from Phd2 CKO mice. (A-D), Phd2 CKO and Phd2f/f control mice were all treated with tamoxifen at 6 weeks of age and analyzed after another 6 weeks. Red blood cells, hemoglobin concentrations, hematocrit values, and white blood cells were all significantly increased. n = 6. **, P < 0.01. (E) Time course of serum Epo level increases as measured by ELISA. n = 3 at each time point. (F) Time course of increases in hemoglobin concentration. n = 3 at each time point. Error bars represent SEM.
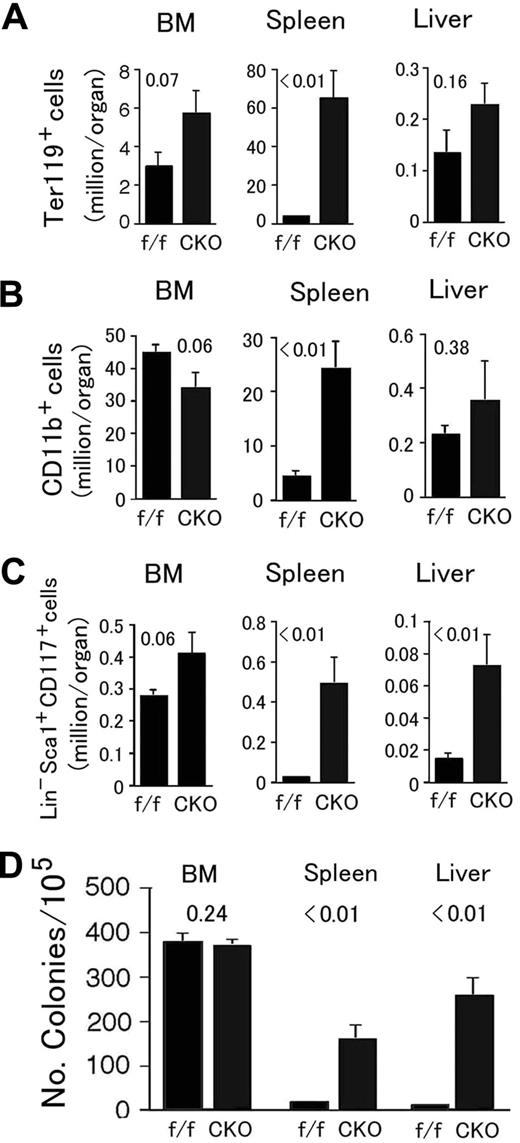
In Phd2 CKO mice, Ter119+ and CD11b+ cells were both dramatically increased in the spleen, accompanied by moderate but statistically insignificant changes in the BM and liver (Figure 5A,B). Massive expansion of splenic CD11b+ cell population could partially explain the increased numbers of WBCs in the peripheral blood (Figure 4D). BM-derived HSCs had a trend of increase (Figure 5C), but not as significant as in Phd1/3 DKO mice. However, splenic and hepatic Lin− Sca-1+ CD117+ populations were significantly expanded (Figure 5C). These expansions correlated with increased extramedular hematopoietic activity evaluated by methylcellulose colony-forming assays (Figure 5D).
Analysis for hematopoietic progenitors and hematopoietic stem cells in Phd2 CKO mice. (A-C) Flow cytometry analyses. (A) Erythroid (Ter119+); (B) myeloid (CD11b+); (C) HSC (Lin− Sca-1+ CD117+). Bone marrow (BM), spleen, and liver samples were analyzed. Total cell numbers in each organ are shown. n = 6 to 7. P values are indicated above the bars. (D) Methylcellulose colony formation assay. Genotypes are indicated at the bottom. f/f and CKO refer to Phd2f/f and Phd2 CKO mice, respectively. Number of colonies per 105 cells are presented, n = 6; P values are indicated in the figure. Error bars represent SEM.
Analysis for hematopoietic progenitors and hematopoietic stem cells in Phd2 CKO mice. (A-C) Flow cytometry analyses. (A) Erythroid (Ter119+); (B) myeloid (CD11b+); (C) HSC (Lin− Sca-1+ CD117+). Bone marrow (BM), spleen, and liver samples were analyzed. Total cell numbers in each organ are shown. n = 6 to 7. P values are indicated above the bars. (D) Methylcellulose colony formation assay. Genotypes are indicated at the bottom. f/f and CKO refer to Phd2f/f and Phd2 CKO mice, respectively. Number of colonies per 105 cells are presented, n = 6; P values are indicated in the figure. Error bars represent SEM.
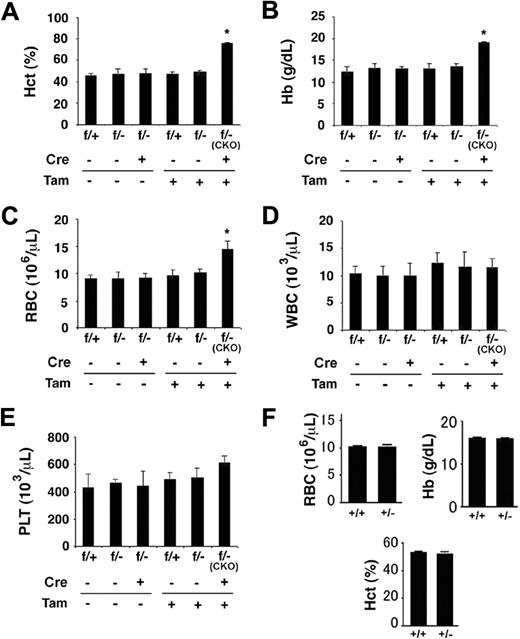
Given that partial loss of PHD2 activity was linked to mild polycythemia in humans,12 and our finding here that extensive loss of PHD2 expression resulted in extremely severe erythrocytosis, we were interested in examining whether heterozygosity of the Phd2 knockout allele would result at least in moderately elevated erythropoiesis. As shown in Figure 6, although tamoxifen-treated Phd2f/−/Rosa26+/CreERT2 (ie, Phd2 CKO) mice displayed the expected polycythemic phenotype 2 weeks after tamoxifen administration, Phd2f/− mice (no CreERT2) with parallel tamoxifen treatment had no detectable increases in hematocrit values (Figure 6A), serum hemoglobin concentrations (Figure 6B), or RBC numbers (Figure 6C). Thus, a single floxed allele was sufficient to maintain the negative regulation of erythropoietic activities. It is noteworthy that Phd2 CKO mice did not display statistically significant changes in WBC and platelet numbers at this time point (2 weeks after tamoxifen treatment).
Normal hematologic parameters in mice heterozygous for Phd2 knockout. (A-E) Phd2 conditional knockout mice and controls. (A) Hematocrit values. (B) Hemoglobin concentrations. (C) Number of red blood cells. (D) White blood cells. (E) Platelets. Two weeks before tamoxifen administration, baseline measurements were performed (Tam, −). Measurements were taken again 2 weeks after tamoxifen administration (Tam, +). CreERT2 status is indicated as Cre − or +, representing absence or presence, respectively. Phd2f/− mice carrying CreERT2 and fed with tamoxifen are also designated as CKO, for conditional knockout. These are similar to Phd2 CKO mice used in other experiments except that one of the allele here was − before tamoxifen treatment; it was inherited as a germline mutation. For (A) to (E), n = 3 to 7; *P < .05. (F) Hematologic analysis of germline heterozygotes at more than 20 weeks of age. n = 5 to 6. Error bars represent SEM.
Normal hematologic parameters in mice heterozygous for Phd2 knockout. (A-E) Phd2 conditional knockout mice and controls. (A) Hematocrit values. (B) Hemoglobin concentrations. (C) Number of red blood cells. (D) White blood cells. (E) Platelets. Two weeks before tamoxifen administration, baseline measurements were performed (Tam, −). Measurements were taken again 2 weeks after tamoxifen administration (Tam, +). CreERT2 status is indicated as Cre − or +, representing absence or presence, respectively. Phd2f/− mice carrying CreERT2 and fed with tamoxifen are also designated as CKO, for conditional knockout. These are similar to Phd2 CKO mice used in other experiments except that one of the allele here was − before tamoxifen treatment; it was inherited as a germline mutation. For (A) to (E), n = 3 to 7; *P < .05. (F) Hematologic analysis of germline heterozygotes at more than 20 weeks of age. n = 5 to 6. Error bars represent SEM.
To further evaluate whether polycythemia might develop in heterozygous mice over a longer period of time, we also examined hematologic parameters in germline heterozygous (Phd2+/−) mice older than 20 weeks. As shown in Figure 6F, no significant differences were found between Phd2+/+ and Phd2+/− mice. Because loss of a single Phd2 allele in mice reduces PHD2 protein levels by approximately half,32 we conclude that moderate loss of PHD2 in mice does not substantially affect erythropoiesis.
We also performed molecular analyses to better understand blood phenotypes observed in this study. To determine whether differences among Phd2 CKO, Phd1−/−, and Phd3−/− mice were related to differential expression of individual PHD isoforms, we analyzed protein levels of PHD1, -2, and -3 in different tissues. Protein bands for different PHD isoforms were initially identified by in vitro transcription/translation (IVTT) experiments (Figure 7A and Figure S2), and the PHD2 band was also identified in a previous study.32 As shown in Figure 7B, PHD2 was the most abundant isoform in all tissues examined. PHD1 was only weakly detectable in several organs (testis, BM, spleen, and possibly liver), whereas PHD3 was below detection level in all tissues. The presence of 2 PHD1 bands (a more intense slowly migrating band and a weaker faster band) in the IVTT lane is probably due to the presence of 2 different translational initiation sites.37
Molecular analysis for Phd2 CKO and Phd1/3 DKO mice. (A) Autoradiography of [35S]methionine-labeled PHD1, 2 and 3 produced by IVTT. Free, unincorporated [35S]methionine. (B) Western blotting analysis for PHD1, -2, and -3 in various tissues from wild-type adult mice. Equal amounts of IVTT-produced PHD1, -2, and -3 proteins were loaded as controls. Note PHD1 had 2 bands because of alternative translational initiation. (C) Anti-PHD2 Western blots for Phd1/3 DKO tissues. (D) Anti-HIF-1α and HIF-2α Western blots for Phd2 CKO and Phd1/3 DKO mice. (E,F) Q-PCR analysis for Epo mRNA. f/f, Phd2f/f; CKO, Phd2 CKO; WT, wild-type; DKO, Phd1/3 DKO. n = 6. (F) The scale in panel E was reduced. **P < .01; *P < .05. Error bars represent SEM.
Molecular analysis for Phd2 CKO and Phd1/3 DKO mice. (A) Autoradiography of [35S]methionine-labeled PHD1, 2 and 3 produced by IVTT. Free, unincorporated [35S]methionine. (B) Western blotting analysis for PHD1, -2, and -3 in various tissues from wild-type adult mice. Equal amounts of IVTT-produced PHD1, -2, and -3 proteins were loaded as controls. Note PHD1 had 2 bands because of alternative translational initiation. (C) Anti-PHD2 Western blots for Phd1/3 DKO tissues. (D) Anti-HIF-1α and HIF-2α Western blots for Phd2 CKO and Phd1/3 DKO mice. (E,F) Q-PCR analysis for Epo mRNA. f/f, Phd2f/f; CKO, Phd2 CKO; WT, wild-type; DKO, Phd1/3 DKO. n = 6. (F) The scale in panel E was reduced. **P < .01; *P < .05. Error bars represent SEM.
PHD2 abundance in BM, spleen, liver, and kidney was similar between wild-type and Phd1/3 DKO mice (Figure 7C), suggesting that PHD1/3 double deficiency did not up-regulate PHD2 expression in hematopoietic organs. We also checked HIF-1α and HIF-2α levels in kidneys and livers of wild-type, Phd2f/f, Phd2 CKO, and Phd1/3 DKO mice (Figure 7D). As expected, HIF-1α levels were increased in both organs of Phd2 CKO mice. However, HIF-2α remained undetectable in PHD2 deficient renal or hepatic tissues. In Phd1/3 DKO mice, HIF-2α was significantly increased in the liver though not kidney, but HIF-1α did not increase in either organ. In fact, kidney HIF-1α levels were moderately reduced in 5 of 6 Phd1/3 DKO mice. Increased perfusion to the kidney as a result of higher RBC numbers, and hence more efficient oxygen delivery, could in theory increase PHD2-mediated hydroxylation and subsequent HIF-1α degradation in Phd1/3 DKO mice.
At the mRNA level, Q-PCR analysis demonstrated enormously increased Epo expression in Phd2 CKO kidneys but not livers, despite increased HIF-1α in both (Figure 7E,F), suggesting that hepatic HIF-1α is insufficient for Epo expression. In sharp contrast, Phd1/3 DKO mice had dramatically reduced, instead of increased, renal Epo expression (Figure 7F), which may be at least partially responsible for reduced serum Epo levels. However increased number of erythroid progenitors and early erythrocytes may have also reduced free Epo protein molecules by increased receptor binding. Nevertheless, hepatic Epo mRNA was up-regulated in Phd1/3 DKO mice (Figure 7F), which was consistent with up-regulated HIF-2α in the liver.
Discussion
Induction of polycythemia in humans and other mammals is one of fundamental adaptive mechanisms to hypoxia,38-41 which is also associated with genetic alterations that result in the accumulation of HIF-α and overexpression of Epo, such as partial loss-of-function mutations in human VHL or PHD2 genes.1,2,12 The role of PHDs in initiating HIF-α degradation and suppressing erythropoiesis is being exploited for the development of therapeutic procedures to treat anemia and tissue ischemia. For example, PHD inhibitors, which are also called HIF stabilizers, have been undergoing clinical trials.42,43
In this article, we describe a detailed investigation on the role of different PHD isoforms in erythropoiesis. We discovered that all 3 PHD isoforms contribute to the regulation of erythropoiesis in adult mice but to different extents and via different HIF pathways. Phd2 gene disruption alone led to dramatic erythrocytosis and premature death, presumably due to blood hyperviscosity. Although single knockouts for Phd1 or Phd3 caused no detectable erythrocytosis, double knockout of Phd1 and Phd3 also resulted in moderate increase in hematocrit values (average of .67 in Phd1/3 DKO vs .83 in Phd2 CKO mice or .53 in wild-type mice).
Polycythemia in PHD2-deficient mice is most likely caused by excessive differentiation and proliferation of Ter119+ erythroid progenitors, which are known to express Epo receptor abundantly.44 This notion is consistent with flow cytometry data, which demonstrated a huge increase in Ter119+ cells (Figure 5A), and ELISA, which revealed drastically increased serum Epo levels in Phd2 CKO mice (Figure 4E). Changes in WBC numbers were observed at 6 weeks after tamoxifen treatment, but not earlier (2 weeks), suggesting that increased cell numbers of the myeloid lineage may be a consequence of severely altered blood properties and general deterioration of the health status in Phd2 CKO mice. Likewise, the direct cause to the expansion of HSC populations also remains to be clarified in future studies.
The predominant role of PHD2 as a negative regulator of erythropoiesis may be because it is by far the most abundant isoform (Figure 7B). Although PHD2 deficiency in the liver led to higher HIF-1α protein levels, there was no detectable effect on HIF-2α. Also noteworthy is our observation that HIF-1α accumulation in PHD2 deficient livers did not promote local Epo expression. This finding is consistent with recent studies demonstrating that HIF-2α instead of HIF-1α is essential for Epo expression, especially in the liver.45-50 In Phd2 CKO kidneys, however, up-regulation of Epo expression occurred without detectable HIF-2α accumulation. Thus, there is an intriguing possibility that even though HIF-2α but not HIF-1α is the essential transcription factor for Epo gene activation, when accumulated to high levels in the kidney, HIF-1α may be able to activate Epo expression. Regardless of the identity of the specific HIF-α involved, it is quite clear that drastically increased Epo expression is a major contributor to blood phenotypes in Phd2 CKO mice.
The mechanisms underlying erythrocytosis in Phd1/Phd3 DKO mice are more complicated, especially because both PHD1 and PHD3 proteins are present at low levels. Among various possibilities, one plausible explanation is that both might be expressed only in selective cell types, resulting in their apparently low abundance in total tissue lysates. On the other hand, the need to disrupt both Phd1 and Phd3 genes to trigger erythrocytosis is consistent with their overall low expression levels. It was also surprising to find that serum Epo levels were reduced in Phd1/3 DKO mice. One possibility is that a large number of erythroid progenitors might remove Epo from the serum by receptor binding.
In contrast to reduced serum Epo levels, Epo expression is up-regulated in Phd1/3 DKO livers, accompanied by significantly expanded erythroid population in the same organ. It is noteworthy that increased liver HIF-2α but not HIF-1α levels were associated with these changes, suggesting that PHD2 and the combination of PHD1/3 regulate different HIF-α subunits in the liver. These findings are also in line with an in vitro study that demonstrated similar differential activities among different PHD isoforms.29
It is likely that increased Epo expression in the liver contributed to erythrocytosis by stimulating erythroid differentiation and proliferation in the hepatic microenvironment. Also not excluded is the possibility that endogenous Epo production from erythroid progenitors might be augmented as a result of PHD1/3 double deficiency and contribute to erythrocytosis; however, it remains unknown whether Epo expression in erythroid progenitors is HIF-dependent.51 In any case, our data agree with an earlier study that demonstrated increased erythropoiesis in anephric animals after the administration of PHD inhibitor,42 which suggested that suppression of PHD function in organs other than the kidney could accelerate erythropoiesis. However, other possible mechanisms are potentially viable as well. For example, because hypoxia in bone marrow microenvironments modulates the hematopoietic stem cell function,52 it will be an important future direction to investigate if altered bone marrow properties contribute to polycythemia in Phd1/3 DKO mice.
Our conclusion that PHD2 and PHD1/3 regulate erythropoiesis by different mechanisms has important implications for the treatment of anemia and other blood disorders. For example, knowing that PHD2 is essential for suppressing Epo expression in the kidney but not in the liver, our data may inspire the development of tissue specific therapies. Furthermore, because vascular defects are not associated with PHD1/3 deficiency, inhibition of PHD1 and PHD3 might be a superior approach to treating anemia. In summary, work described in this article establishes PHD-deficient mice as animal models for erythropoiesis studies and identifies specific roles of different PHD isoforms in regulating HIF-α stabilization and Epo expression. These findings are expected to facilitate the development of PHDs as specific drug targets to treat hematologic diseases.
An Inside Blood analysis of this article appears at the front of this issue.
The online version of this article contains a data supplement.
The publication costs of this article were defrayed in part by page charge payment. Therefore, and solely to indicate this fact, this article is hereby marked “advertisement” in accordance with 18 USC section 1734.
Acknowledgments
We thank Dr Alexandra Joyner for Rosa26CreERT2 mice and Paul Furlow for assistance in mouse colony management.
This work was supported by National Institutes of Health grants 5P01-HL70694 (project 2, G.H.F.) and R01-C090261 (F.S.L.) and by American Heart Association grant-in-aid 0655926T (G.H.F.).
National Institutes of Health
Authorship
Contribution: K.T., H.L.A., N.S.P., X.L., and F.S.L. designed and performed specific experiments. K.L., L.-J.D., and H.T. performed specific experiments. K.T., H.L.A., N.S.P., X.L., and F.S.L participated in the writing of the manuscript. G.-H.F. was responsible for the overall design, data interpretation, and manuscript preparation.
Conflict-of-interest disclosure: F.S.L. has received grant support from GlaxoSmithKline. The remaining authors declare no competing financial interests.
Correspondence: Guo-Hua Fong, Center for Vascular Biology, University of Connecticut Health Center, 263 Farmington Avenue, Farmington, CT 06030-3501; e-mail: fong@nso2.uchc.edu; or L. Hector Aguila, Department of Immunology, University of Connecticut Health Center, 263 Farmington Avenue, Farmington, CT 06030-3501; e-mail: aguila@nso1.uchc.edu.

![Figure 7. Molecular analysis for Phd2 CKO and Phd1/3 DKO mice. (A) Autoradiography of [35S]methionine-labeled PHD1, 2 and 3 produced by IVTT. Free, unincorporated [35S]methionine. (B) Western blotting analysis for PHD1, -2, and -3 in various tissues from wild-type adult mice. Equal amounts of IVTT-produced PHD1, -2, and -3 proteins were loaded as controls. Note PHD1 had 2 bands because of alternative translational initiation. (C) Anti-PHD2 Western blots for Phd1/3 DKO tissues. (D) Anti-HIF-1α and HIF-2α Western blots for Phd2 CKO and Phd1/3 DKO mice. (E,F) Q-PCR analysis for Epo mRNA. f/f, Phd2f/f; CKO, Phd2 CKO; WT, wild-type; DKO, Phd1/3 DKO. n = 6. (F) The scale in panel E was reduced. **P < .01; *P < .05. Error bars represent SEM.](https://ash.silverchair-cdn.com/ash/content_public/journal/blood/111/6/10.1182_blood-2007-09-114561/6/m_zh80040815160007.jpeg?Expires=1765913919&Signature=H4nOKY7U2RrgartXFpEc7Srl0YDMN41QC369OP0JicRoNUpUJtTd2FIcoPixmKPm7ax~n0wcis4317AZXzfwD9fkweTxRxIGzdGk-QDnzHzV7lCYCZJslqZo~f~DuZ17LcbTwuieCfBQaJ8IdWpxjhw4YOEHHTqPDCi5Cu-Q0g7fN~wnYnRbN6HvexwSYRcbUiBLNjqRMAUzBZQjz-d1ODMmsBtvUsE3h3COQPz1y0470qUld6tVwMnhJ-sGfpepgPcCtUsGRqs8ij7B8bU7sQqI0CYxBFOqVtGe-7P462h1Uv2V~FbXeneP6gMXieeGZpeCm8meceRYenZNBaoh0w__&Key-Pair-Id=APKAIE5G5CRDK6RD3PGA)
This feature is available to Subscribers Only
Sign In or Create an Account Close Modal