We explored the ability of the proteasome inhibitor bortezomib, which prevents nuclear factor κB (NF-κB) activation, to block T-cell activation, proliferation, and survival within alloreactive compared with resting T cells. For this purpose, T cells were stimulated with PHA, αCD3/αCD28, or allogeneic dendritic cells or through mixed lymphocyte cultures. NF-κB expression increased in activated T lymphocytes compared with resting T cells. Of interest, the higher the NF-κB expression, the more intense the proliferative blockade induced by bortezomib. Moreover, after mixed lymphocyte reaction (MLR) cultures, alloreactive T cells were 2 logs more sensitive to bortezomib-induced apoptosis than the resting T-cell counterpart. This effect was due to a selective induction of apoptosis among activated T cells that was related to caspase activation and cleavage of the antiapoptotic bcl-2 protein and was partially abolished by the addition of the pancaspase inhibitor Z-VAD-FMK. In addition, after secondary MLR, the number of activated T cells was significantly reduced among T lymphocytes previously cultured with bortezomib when cells from the same donor were used as stimulating cells. By contrast, when third-party donor cells were used as stimulating cells, no significant differences were observed between T lymphocytes previously exposed or not to the drug, indicating a highly specific depletion of T lymphocytes alloreactive against primary donor antigens. The addition of bortezomib decreased not only the proliferation and viability of activated T lymphocytes but also the levels of IFNγ and IL-2, which were significantly decreased among activated T cells cultured with bortezomib at doses ranging from 10 to 100 nM. In conclusion, at concentrations reached in the clinical setting, bortezomib induces selective apoptosis and decreases Th1 response among alloreactive T lymphocytes while it barely affects unstimulated T cells. These results establish the basis for the clinical use of bortezomib in the management of graft-versus-host disease (GVHD).
Introduction
NF-κB is a collective term referring to dimeric transcription factors that belong to the Rel family, which are regulated via shuttling from the cytoplasm to the nucleus in response to cell stimulation.1 The NF-κB family has emerged as a key transducer of inflammatory signals involved in dendritic cell (DC) maturation and T-lymphocyte activation.2-4 Accordingly, the diverse signaling pathways downstream of TCR/CD3 converge on several key transcription factors including NFAT, AP-1, and NF-κB.5 Activation of NF-κB is essential for T-cell immunogenic but not for tolerogenic responses, while NFAT proteins serve both immunogenic and tolerogenic functions.6-9 In addition, NF-κB activates multiple target genes whose products can inhibit apoptosis, and both antiapoptotic activity and immunogenic response are intimately linked.10
Bortezomib, a boronic acid dipeptide, is a potent, selective, and reversible inhibitor of proteasome.11,12 The proteasome is a multienzyme complex present in all cells. It degrades proteins that regulate cell-cycle progression and causes proteolysis of the ubiquitinated endogenous inhibitor of nuclear factor κB, IκB.13 The latter blocks the nuclear translocation and transcriptional activity of NF-κB. Bortezomib has shown cytotoxicity against a broad range of human tumor cell lines that constitutively express NF-κB activity.14,15 In normal T lymphocytes, NF-κB translocation to the nucleus occurs only after TCR/CD3 and costimulatory molecule engagement,3,16 while it is not activated in resting T lymphocytes.
One of the major challenges in allogeneic hematopoietic stem cell transplantation is to prevent the alloreactivity that leads to graft-versus-host disease (GVHD), while preserving the graft-versus-leukemia (GVL) effect.16,17 In vitro data support the existence of hematopoietic lineage-restricted alloresponses within T cells.18 We hypothesized that NF-κB blockade may deplete activated T lymphocytes in a mixed lymphocyte culture, thus selectively targeting alloreactive T cells. Moreover, the blockade of NF-κB under in vitro activating conditions may induce an overexpression of alternative intracellular pathways, thereby modifying the type of immune response. Of importance, a previous study has been reported showing that the use of bortezomib may prevent GVHD in a mouse model.19 In the current paper, we show that in human cells, bortezomib selectively targets alloreactive T cells, inducing apoptosis at concentrations reached in the clinical setting. Moreover, the cytokine pattern is altered since the drug induces a decreased production of Th1 cytokines, which are involved in the development of GVHD.
Materials and methods
Cell cultures and proliferation assays
Peripheral blood mononuclear cells (PBMCs) from buffy coats from volunteer donors were isolated by density gradient centrifugation using Ficoll-Paque solution and allowed to adhere to the tissue-culture dish (Becton Dickinson, Franklin Lakes, NJ). After 2 hours at 37°C, nonadherent cells were collected, washed, and resuspended in culture medium, which consisted of RPMI 1640 l-glutamine (2 mM), penicillin (100 UI/mL), and streptomycin (10 mg/mL) plus 10% human AB serum (Sigma, St Louis, MO). More than 90% of monocytes/macrophages were eliminated as monitored by flow cytometry (data not shown), and T cells were further purified using anti-CD3 magnetic beads (Miltenyi Biotec, Auburn, CA) if required. Approval was obtained from the institutional review board for these studies, and informed consent for volunteer donors was provided according to the Declaration of Helsinki.
In order to generate DCs, adherent cells were cultured for 7 days and incubated at 37°C with 5% CO2 in Iscoves modified Dulbecco medium (IMDM) supplemented with glutamine (2 mM), penicillin (100 UI/mL), and streptomycin (10 mg/mL) plus 10% human AB serum. GM-CSF (1000 U/mL; PeProtech, Rocky Hill, NJ) plus IL-4 (1000 U/mL; R&D System, Minneapolis, MN) were added on the first day of culture, and TNFα (20 ng/mL; R&D System) was added for the last 48 hours of culture. Phenotypic analysis was performed to ensure more than 90% DC purity in the sample using FITC-conjugated mAbs CD3, CD56, CD14, and CD19 (Exclusion Kit for dendritic cell studies; Cytognos, Salamanca, Spain) and PE-conjugated mAbs CD80 and CD86 (BD Bioscience Pharmingen, San Jose, CA) as previously described.20
The inhibitory effect of bortezomib on cell growth was assessed by measuring the 3-(4.5-dimethylthiazol-2-yl)-2,5-diphenyl tetrazolium bromide (MTT) dye absorbance of the cells. For that purpose, 105 cells/100 μL were plated in triplicate into 96-well tissue-culture dishes in culture medium without bortezomib (kindly provided by Millennium Pharmaceuticals, Cambridge, MA) or at increasing doses of the drug: 1 nM, 10 nM, 100 nM, and 1000 nM. Bortezomib was added at the first or third day of the culture in order to allow T-cell activation. MTT absorbance was assessed on the fifth day. For all these concentrations of the drug, lymphocytes were cultured in the following conditions: (1) culture medium alone (control); (2) culture medium plus phytohemagglutinin (PHA, 5 μg/mL); (3) culture medium plus plate-bound anti-CD3 (5 μg/mL) in combination with soluble anti-CD28 (2.5 μg/mL); (4) culture medium plus 0.5 × 10⁵ irradiated (15 Gy) allogeneic T lymphocytes. Finally, for proliferation assays only, lymphocytes were also cultured in medium plus irradiated allogeneic DCs at a ratio of 10:1. While proliferation assays were performed in all cases analyzed, results reported on the rest of studies described in the paper were repeated in at least 5 cases depending on the number of cells required for each experiment.
T lymphocytes, cocultured during 5 days with or without bortezomib plus irradiated allogeneic T lymphocytes, were restimulated in secondary MLRs using T lymphocytes obtained from the same donor or from a third-party donor. Bortezomib was not added to the secondary MLR. Immunophenotypic analysis of activation markers was performed 72 hours after the beginning of the secondary culture.
Immunophenotypic analysis and cytokine staining
Nonadherent lymphocytes (5 × 10⁵/well) were seeded in 48-well plates and were cultured in medium alone or stimulated with either PHA (5 μg/mL), plate-bound anti-CD3 (5 μg/mL) plus soluble anti-CD28 (2.5 μg/mL), or 2.5 × 10⁵ irradiated (15 Gy) allogeneic T lymphocytes. Different concentrations of bortezomib (0, 1 nM, 10 nM, 100 nM, and 1000 nM) were added at day 0 (for 24-hour antigen assessment) or at day 3 of culture (for 5-day assays). Cells were analyzed by direct immunofluorescence using 4-color staining with mAbs conjugated with the following fluorochromes: fluorescein (FITC), phycoerythrin (PE); peridin clorophil protein–cyanine 5 (PerCP-Cy5), and allophycocyanin (APC). Specific antibodies were purchased from BD Bioscience Pharmingen except for anti–CD25-PE provided by Immunotech (Miami, FL). The following combinations were used: anti–CD3-FITC/anti–CD25-PE/anti–CD4-PerCP-Cy5/anti–CD40L-APC; anti–CD25-FITC/anti–cytoplasmic IFN-PE/anti–CD8-PerCP-Cy5.5/anti–CD4-APC; anti–CD25-FITC/anti–CD69-PE/anti–CD8-PerCP-Cy5.5/anti–CD4-APC; and anti–CD69-FITC/anti–cytoplasmic granzyme/anti–CD8-PerCP-Cy5.5/anti–CD3-APC. Briefly, for surface staining, 100 μL sample/tube was incubated for 30 minutes with the appropriate combination of mAbs at room temperature (RT) in the dark. Cells were centrifuged (5 minute at 540g) and the pellet was washed with 4 mL PBS. Finally, cells were resuspended in 0.5 mL PBS until analyzed in the flow cytometer. For intracellular cytokine staining, brefeldin A (10 μg/mL) was added during the last 4 hours prior to acquisition. Intracellular detection of IFN-γ was performed, after staining for surface proteins, using a direct immunofluorescence technique. For this purpose, the IntraStain kit (Dako Cytomation, Glostrup, Denmark) was used, strictly following the recommendations of the manufacturer. After staining for the intracytoplasmic antigens, cells were washed and resuspended in 0.5 mL PBS until analysis in the flow cytometer. Data acquisition was performed on a FACSCalibur flow cytometer (BD, San Jose, CA) using the CellQuest software program and analyzed using the software Paint-A-Gate Pro (BD), except for the analysis of intracellular IFN-γ in which the CellQuest software was used. Samples were acquired and analyzed at different intervals following lymphocyte activation considering the kinetics of cell surface markers.21
ELISA
For IL-2 release assay, nonadherent lymphocytes were seeded as described in the previous paragraph for immunophenotypic analysis. Different concentrations of bortezomib were added at the beginning of the culture. Cells were incubated at 37°C, 5% CO2, and, after 48 hours, supernatants were harvested and analyzed for IL-2 secretion using a commercially available enzyme-linked immunosorbent assay (ELISA; Diaclone, Besan-çon Cedex, France).
Apoptosis assessment
For the detection of apoptosis, cell cultures were performed as previously described in the immunophenotypic analysis section, and the annexin V–PE/7 amino-actinomycin (7-AAD) apoptosis detection kit from BD Bioscience Pharmingen was used. Briefly, a minimum of 0.5 × 10⁶ T lymphocytes were washed and resuspended in binding buffer (1:10 diluted in PBS) maintaining a cell concentration of 1 × 10⁶/mL. Annexin V–PE and 7-AAD (5 μL each) were added for 15 minutes. In order to identify activated T lymphocytes, anti–CD25-FITC was also added. For every condition, 50 000 events were collected and analyzed. The percentage of annexin V–PE plus 7-AAD–negative lymphocytes was calculated using the software Paint-A-Gate Pro (BD).
In another set of experiments, CD25+ cells were isolated after 3 days of a mixed lymphocyte culture by positive selection with directly conjugated anti-CD25 magnetic microbeads (5 μL/107 cells; Miltenyi Biotec) and purified over an LS+ column. The CD25– fraction was further stained using anti-CD3 mAb-coated magnetic microbeads (10 μL/107 cells; Miltenyi Biotec) and applied to a second magnetic column. After purification, bortezomib at different concentrations was added to the CD25+ and CD25– lymphocytes for 48 hours, and apoptosis assessment was performed in both fractions as specified. To further assess the absolute number of annexin V–PE plus 7-AAD–negative cells within the different cell subpopulations, in 5 cases the samples were simultaneously acquired using Trucount Tubes (BD), which contain a calibrated number of fluorescent microbeads. The absolute count of annexin V–PE plus 7-AAD–negative cells was then calculated using the following equation: (number of events in region containing annexin V–PE plus 7-AAD–negative cells/number of events in absolute count bead region) × (number of beads per test/test volume). Finally, in order to evaluate the role of caspase activation in the bortezomib-induced apoptosis, the pancaspase inhibitor Z-VAD-FMK (20 μM; Sigma) was added 1 hour before the addition of bortezomib to samples cultured for 24 hours with different concentrations of the drug. The effect of Z-VAD-FMK on the absolute count of annexin V–PE–positive and/or 7-AAD–positive cells was calculated.
Growth inhibition induced by bortezomib in T lymphocytes as assessed by MTT. Results are expressed as mean percentage (±SD) of absorbance at 570 nM using a spectrophotometer (100% is considered as the corresponding value of the sample incubated without bortezomib [0 nM]). Significant differences (P < .01) in cell growth were observed between PHA-stimulated T lymphocytes, MLR, and controls for the different concentrations of the drug (n = 11). When T lymphocytes were cultured with irradiated allogeneic dendritic cells (DC), T lymphocytes displayed an intermediate proliferative pattern between PHA-stimulated cultures and MLR (n = 9). Significant differences (P < .01) were observed in terms of percentage of growth inhibition within T lymphocytes stimulated with PHA, MLR, or irradiated DCs depending on the concentration of bortezomib.
Growth inhibition induced by bortezomib in T lymphocytes as assessed by MTT. Results are expressed as mean percentage (±SD) of absorbance at 570 nM using a spectrophotometer (100% is considered as the corresponding value of the sample incubated without bortezomib [0 nM]). Significant differences (P < .01) in cell growth were observed between PHA-stimulated T lymphocytes, MLR, and controls for the different concentrations of the drug (n = 11). When T lymphocytes were cultured with irradiated allogeneic dendritic cells (DC), T lymphocytes displayed an intermediate proliferative pattern between PHA-stimulated cultures and MLR (n = 9). Significant differences (P < .01) were observed in terms of percentage of growth inhibition within T lymphocytes stimulated with PHA, MLR, or irradiated DCs depending on the concentration of bortezomib.
Western blot
Cells (106) were seeded in 25-cm2 flasks (Corning, Corning, NY), and were either unstimulated or stimulated with 5 μg/mL PHA for 24 hours. Then, culture medium or 100 nM bortezomib was added for 30 minutes, 1 hour, 3 hours, 6 hours, 12 hours, and 24 hours. Cells were then washed with PBS (Gibco, Carlsbad, CA) and lysed in ice-cold lysis buffer (140 mM NaCl, 10 mM EDTA, 10% glycerol, 1% nonidet P-40, 20 mM Tris [pH 7.0], 1 μM pepstatin, 1 μg/mL aprotinin, 1 μg/mL leupeptin, 1 mM sodium orthovanadate). Samples were centrifuged at 15 700 g at 4°C for 10 minutes and supernatants were collected. Cell extracts were subjected to 10% sodium dodecyl sulfate–polyacrylamide gel electrophoresis (SDS/PAGE) and blotted onto PVDF membrane (Millipore, Billerica, Spain). Membranes were incubated with rabbit anti-IκBα (1:2000), anti–NF-κB p65 (1:2000; both from Santa Cruz Biotechnology, Santa Cruz, CA), bcl-2 (1:2000), caspase-3 (1:30 000), and caspase-9 (1:1000; all three from BD Bioscience Pharmingen). Membrane-bound first-step antibodies were reacted with horseradish peroxidase–conjugated antirabbit (Bio-Rad, Hercules, CA) or antimouse (Amersham, Pharmacia, Piscataway, NJ) antibodies, and bands were visualized with a luminol-based detection system with p-iodophenol enhancement.15
Statistical analysis
Mean values and their SDs as well as the range and median were calculated for each variable using the SPSS software program (SPSS 11.0; Chicago, IL). Comparison between groups was made by analysis of variance (post hoc Scheffé and Tukey tests were performed to confirm differences between groups). A 2-way measurement of repeated multiple analysis (MR-MANOVA 2-way) was performed to compare the effect of the different doses of the drug within the different types of culture. P values below .05 were considered significant.
Results
Activated T cells show increased sensitivity to bortezomib
To investigate whether bortezomib affected T-lymphocyte proliferation or survival, MTT assays were performed on resting, PHA-stimulated, or MLR-stimulated T lymphocytes. Treatment with bortezomib decreased MTT uptake, especially at concentrations of 10 nM and higher (Figure 1). Of interest, the sensitivity to bortezomib appeared to be markedly higher in T cells stimulated with PHA or MLR compared with resting T cells, as indicated by the slopes of the MTT uptake curves. In addition, when T lymphocytes were cultured in the presence of DCs, the proliferation rate showed intermediate values between PHA and MLR, and the growth inhibition in the presence of the drug also displayed intermediate values between PHA and MLR (Figure 1).
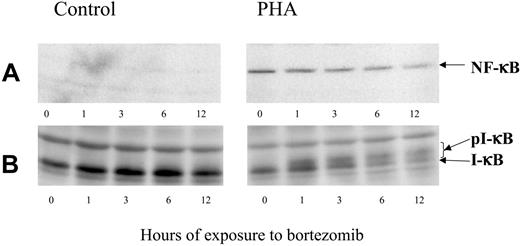
NF-κB activity is controlled by the interaction with its inhibitor, IκB. The latter, in turn, is regulated by phosphorylation, which targets IκB for proteolytic destruction. To assess the effect of bortezomib on IκB degradation and NF-κB expression, T cells were cultured either unstimulated or stimulated with PHA. After 24 hours, bortezomib was added and allowed to act for different time periods. Western blot analysis confirmed that PHA-stimulated T cells overexpressed NF-κB compared with controls (Figure 2A). In addition, bortezomib induced a decrease in NF-κB expression within stimulated T lymphocytes, and this effect was more evident while the incubation period increased. It was also confirmed that in PHA-stimulated T cells IκB is degraded, while the addition of bortezomib induced the accumulation of phosphorylated forms of IκB (Figure 2B).
Bortezomib decreases viability of activated or alloreactive T cells
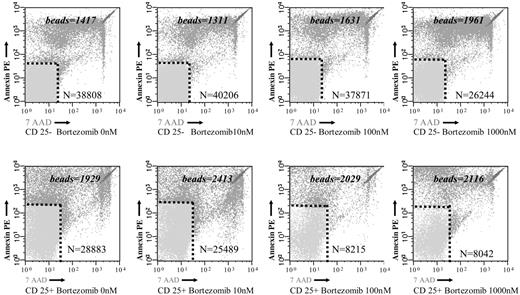
To analyze whether the reduced MTT uptake in response to bortezomib was due to an increased cell death, we investigated the effect of the drug on T lymphocytes using annexin V–PE and 7-AAD staining by flow cytometry. As shown in Figure 3A, the percentage of annexin V–PE–negative and 7-AAD–negative events, which correspond to viable T lymphocytes, significantly decreased in PHA-stimulated samples at drug concentrations higher than 10 nM. By contrast, in unstimulated T cells, viability was only marginally affected by bortezomib (Figure 3B). Moreover, when we compared the effect of bortezomib among PHA-stimulated and unstimulated T lymphocytes, the differences in terms of cell viability increased between both subgroups by increasing the doses of the drug (Figure 3C). Of most importance, these differences in terms of viability were also observed among alloreactive and resting T lymphocytes in MLR. Thus, after 3 days of a mixed lymphocyte culture, CD25+ (alloreactive) and CD25– (resting) T lymphocytes, separated by magnetic-activated cell sorting, were cultured in the presence of different concentrations of bortezomib. In order to precisely quantify the number of viable cells in both subpopulations, the samples were analyzed by flow cytometry using Trucount Tubes with fluorescent beads as specified in “Materials and methods.” Of interest, as shown in Figure 4, the viability of T lymphocytes significantly decreased in the CD25+ T-cell subset, while the number of viable T lymphocytes remained quite constant within the CD25– T-cell subset at different concentrations of the drug. Among CD25+ and CD25– T lymphocytes, the mean percentage of T-cell viability was 75% versus 95% (P = .3), respectively, when cultured at 10 nM, while it was 55% versus 93% (P = .003), respectively, at a concentration of 100 nM. Due to the low number of events remaining within the CD25+ cell subpopulation at higher doses of bortezomib, the analysis could be performed only in 2 cases at 1000 nM. Accordingly, we confirmed that activated T lymphocytes become susceptible to the cytotoxic effect of the drug, while the viability of resting T lymphocytes is not severely affected by bortezomib.
Western blot analysis of NF-κB and IκB expression in control or PHA-stimulated cells, exposed to 100 nM bortezomib for different time periods.
Western blot analysis of NF-κB and IκB expression in control or PHA-stimulated cells, exposed to 100 nM bortezomib for different time periods.
Cell viability assessed by flow cytometry by annexin V–PE and 7-AAD staining. (A) Among PHA-stimulated T lymphocytes (> 70% CD25+ events in all cases), cell viability significantly decreases by increasing the drug concentration. Mean percentage (SD) of annexin V–PE–negative and 7-AAD–negative CD3+ cells (viable T lymphocytes) for the different doses of bortezomib in PHA-stimulated samples: 42.13 (7.03) at 0 nM; 46.14 (9.47) at 1 nM; 35.85 (12.24) at 10 nM; 21.2 (11.9) at 100 nM; and 12.87 (7.72) at 1000 nM. (B) Among resting T lymphocytes, only a minority of cells express CD25 (< 3% CD25+ events in all cases). Cell viability assessed as annexin V–PE–negative and 7-AAD–negative events is not significantly affected by the increments in the drug's concentration. Mean percentage (SD) of annexin V–PE–negative and 7-AAD–negative CD3+ cells (viable T lymphocytes) for the different doses of bortezomib in unstimulated samples: 60.64 (6.03) at 0 nM; 65.6 (3.04) at 1 nM; 64.6 (3.37) at 10 nM; 63.21 (4.96) at 100 nM; and 53.08 (4.32) at 1000 nM. (C) Comparison of the percentage (±95% confidence interval) of annexin V–PE–negative and 7-AAD–negative CD3+ cells between PHA-stimulated and unstimulated (control) T lymphocytes at the different doses of bortezomib. Median, 50% CI, and 95% CI are shown.
Cell viability assessed by flow cytometry by annexin V–PE and 7-AAD staining. (A) Among PHA-stimulated T lymphocytes (> 70% CD25+ events in all cases), cell viability significantly decreases by increasing the drug concentration. Mean percentage (SD) of annexin V–PE–negative and 7-AAD–negative CD3+ cells (viable T lymphocytes) for the different doses of bortezomib in PHA-stimulated samples: 42.13 (7.03) at 0 nM; 46.14 (9.47) at 1 nM; 35.85 (12.24) at 10 nM; 21.2 (11.9) at 100 nM; and 12.87 (7.72) at 1000 nM. (B) Among resting T lymphocytes, only a minority of cells express CD25 (< 3% CD25+ events in all cases). Cell viability assessed as annexin V–PE–negative and 7-AAD–negative events is not significantly affected by the increments in the drug's concentration. Mean percentage (SD) of annexin V–PE–negative and 7-AAD–negative CD3+ cells (viable T lymphocytes) for the different doses of bortezomib in unstimulated samples: 60.64 (6.03) at 0 nM; 65.6 (3.04) at 1 nM; 64.6 (3.37) at 10 nM; 63.21 (4.96) at 100 nM; and 53.08 (4.32) at 1000 nM. (C) Comparison of the percentage (±95% confidence interval) of annexin V–PE–negative and 7-AAD–negative CD3+ cells between PHA-stimulated and unstimulated (control) T lymphocytes at the different doses of bortezomib. Median, 50% CI, and 95% CI are shown.
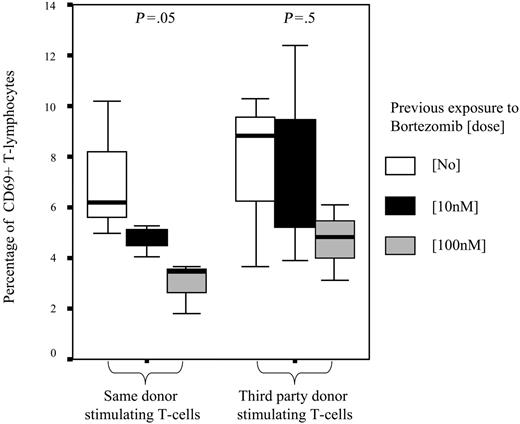
To further confirm the selective depletion of alloreactive T cells after MLR, secondary MLRs were performed using as effector cells T lymphocytes previously cultured with or without bortezomib and, as simulating cells, irradiated T lymphocytes from the same donor used in the primary MLR or from third-party donor. The mean percentage of activated T cells in secondary MLR, as assessed by expression of CD69, was 7.3% among T cells that were not previously exposed to bortezomib and 6.1% and 3.8% among those previously cultured with bortezomib at 10 nM and 100 nM, respectively (P = .8). Of interest, when we separately analyzed the expression of CD69 after secondary MLR among T lymphocytes cocultured with the same donor's stimulating T cells, we found that the mean percentages of CD69+ T cells were 7.1%, 4.1%, and 2.9% among T lymphocytes previously cultured without bortezomib or at a dose of 10 nM and 100 nM of the drug, respectively (P = .05). By contrast, when third-party donor cells were used in the secondary MLRs as stimulating cells, these figures were 7.5%, 7.6%, and 4.7%, respectively (P = .5) (Figure 5), thus indicating not only the selective apoptosis of alloreactive T lymphocytes but a highly specific depletion of T lymphocytes alloreactive against primary donor antigens. Similar values were obtained when activation was assessed by the expression of CD25 (data not shown).
Mechanisms of bortezomib-induced apoptosis in activated T lymphocytes
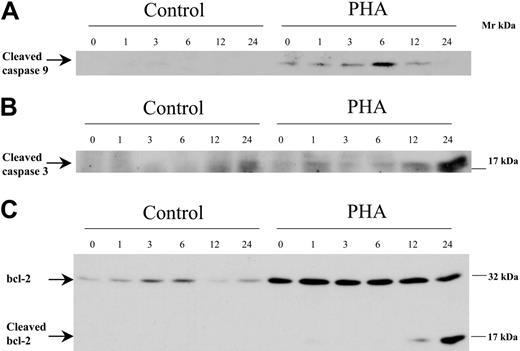
In order to analyze the mechanisms of bortezomib-induced apoptosis among activated or alloreactive T lymphocytes, we performed Western blot analysis assessing the effect of the drug on the activation of caspases and the expression of antiapoptotic and proapoptotic factors of the bcl-2 family. For this purpose, T cells were cultured either unstimulated or stimulated with PHA, and bortezomib was added and allowed to act for different time periods. As shown in Figure 6A-B, activation of caspases-9 and -3, as indicated by the presence of their cleaved fragments, was observed among activated T lymphocytes exposed to bortezomib for 6 and 24 hours, respectively. Activation of caspase-9 preceded that of caspase-3, as expected, since the former is upstream of caspase-3 (caspase-8 activation was difficult to evaluate as these cells expressed low amounts; data not shown). Of interest, bcl-2 expression increased among activated T lymphocytes compared with resting T cells. The addition of bortezomib induced a decrease in bcl-2 concomitantly with the appearance of a lower Mr form that resulted from bcl-2 cleavage, as observed in Figure 6C. These results suggested that activation of caspases and subsequent degradation of bcl-2 could mediate bortezomib-induced apoptosis among activated T lymphocytes.
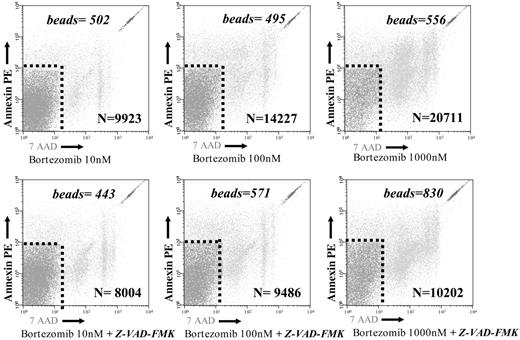
To evaluate whether apoptosis induced by bortezomib among stimulated T cells was dependent or not on caspase activation, the pancaspase inhibitor Z-VAD-FMK was added to T lymphocytes exposed to the drug for 24 hours. As shown in Figure 7, Z-VAD-FMK rescued T cells from bortezomib-induced apoptosis.
Samples were acquired with a calibrated number of Trucount with fluorescent beads Tubes in order to calculate the absolute count of annexin V–PE plus 7-AAD–negative cells among resting (CD25–) and alloreactive (CD25+) T cells. The numbers specified in the figures represent the number of beads in each test and the number of events in the annexin V–PE plus 7-AAD–negative region.
Samples were acquired with a calibrated number of Trucount with fluorescent beads Tubes in order to calculate the absolute count of annexin V–PE plus 7-AAD–negative cells among resting (CD25–) and alloreactive (CD25+) T cells. The numbers specified in the figures represent the number of beads in each test and the number of events in the annexin V–PE plus 7-AAD–negative region.
Bortezomib modifies the pattern of activation markers and cytokine secretion
Thus far, we have demonstrated that bortezomib induces cell death particularly among activated T lymphocytes. Since bortezomib regulates NF-κB and the latter is involved in the activation of target genes linked not only to antiapoptotic activity but also to immunogenic response, we also wanted to evaluate whether bortezomib could modify the activation pattern and cytokine secretion within the remaining viable activated T cells. First, we analyzed the intensity of the expression of the T-cell activation markers CD25 and CD69 in the presence or the absence of bortezomib. As shown in Table 1, the mean fluorescence channel (MFC) of CD25 among activated T cells decreased with the addition of bortezomib in a dose-dependent manner. In addition, in PHA- and CD3/CD28-stimulated cultures we observed a significant decrease in MFC of CD69 as well as a decrease in the percentage of CD69+ T lymphocytes ranging from 60% at 1 nM to 48% at 1000 nM.
Intensity of CD25 and CD69 expression assessed as mean fluorescence channel (MFC) among activated T lymphocytes
. | % CD3+CD25+ cells remaining . | CD25 MFC among remaining activated T cells . | CD69 MFC among remaining activated T cells . |
|---|---|---|---|
| PHA-stimulated samples | |||
| 0 nM bortezomib | 90 | 971 | 207 |
| 10 nM bortezomib | 82 | 929 | 230 |
| 100 nM bortezomib | 73* | 771* | 200 |
| 1000 nM bortezomib | 69* | 642* | 174* |
| αCD3/αCD28-stimulated samples | |||
| 0 nM bortezomib | 64 | 555 | 276 |
| 10 nM bortezomib | 56 | 433 | 256 |
| 100 nM bortezomib | 34* | 208* | 201 |
| 1000 nM bortezomib | 5* | 85* | 166* |
P < .05 compared with the respective value of the samples without bortezomib.
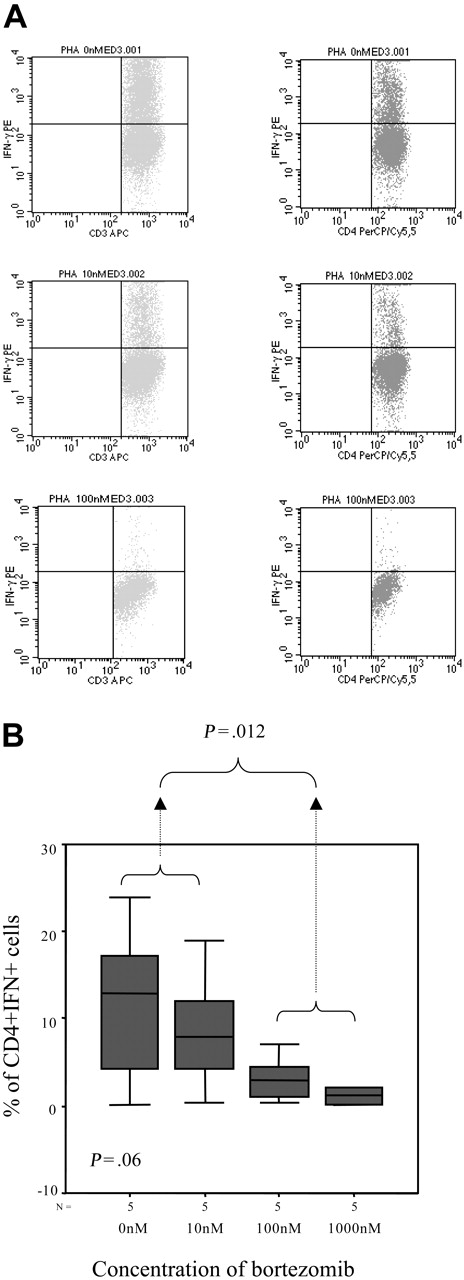
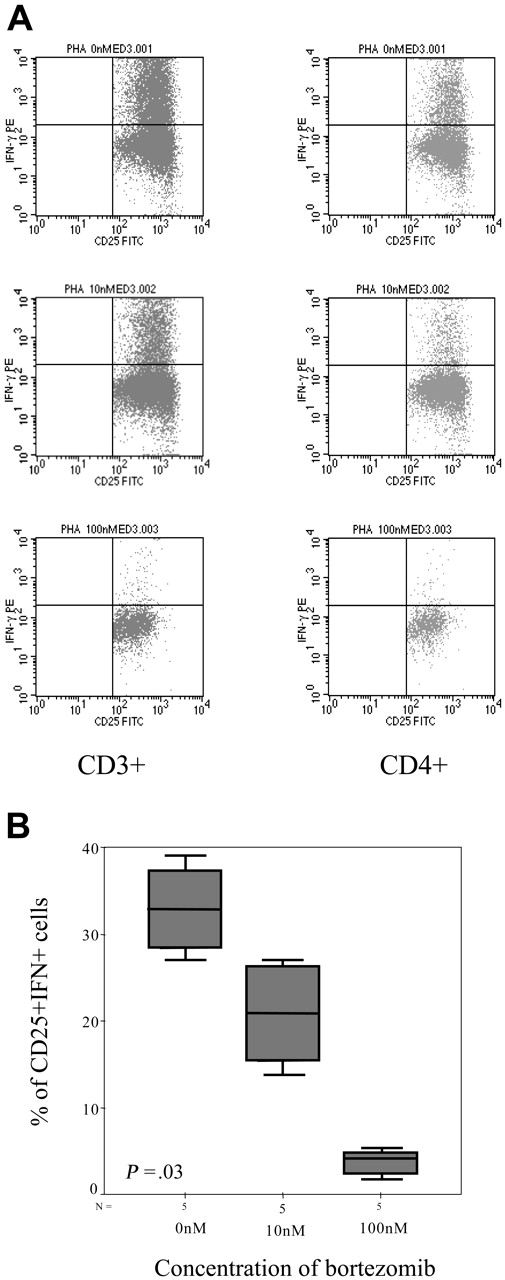
In addition, we evaluated the intracellular expression of IFN-γ and again the percentage of IFN-γ–positive T lymphocytes decreased by increasing the doses of bortezomib, with a mean percentage (range) of IFN+CD4+ cells of 11.42% (0.22%-24.01%), 8.97% (0.4%-18.97%), 3.39% (0.38%-7.12%), and 1.2% (0.23%-2.07%) in samples cultured without bortezomib or at a concentration of 10 nM, 100 nM, and 1000 nM of the drug, respectively (P = .06, Figure 8A-B). Moreover, among activated T lymphocytes identified by their FSC/SSC pattern as well as CD25 expression, the number of IFN-positive T cells also significantly decreased, with a mean percentage (range) of CD25+IFN+ T lymphocytes of 32.88% (28.41%-37.36%), 20.87% (15.45%-26.3%), and 3.49% (3.06%-3.93%) among samples cultured without bortezomib or at a concentration of 10 nM and 100 nM of the drug, respectively (P = .033, Figure 9A-B). In addition, regarding CD8+ T lymphocytes, the mean percentage (range) of activated cells ranged from 21.2% (5.7%-53.17%), 5% (2.3%-8.6%), and 1.7% (0%-4.3%) CD8+CD25+ cells for cultures without bortezomib or at a concentration of 10 nM and 100 nM, respectively (P = .06), while these figures were 39.3% (26.5%-62.5%), 23.7% (8.5%-34.6%), and 9.8% (0%-20.4%) for CD8+granzyme+ T lymphocytes, respectively (P = .003).
Percentage of activated T lymphocytes as assessed by CD69 staining after secondary MLR. Mean percentage (±95% confidence intervals) of activated T lymphocytes significantly decreased among T cells previously cultured with bortezomib at 10 nM or 100 nM when restimulated with the same donor's T cells (P = .05). By contrast, decrease in T-cell activation was not significant when T lymphocytes were restimulated with third-party T cells. Median, 50% CI, and 95% CI are shown.
Percentage of activated T lymphocytes as assessed by CD69 staining after secondary MLR. Mean percentage (±95% confidence intervals) of activated T lymphocytes significantly decreased among T cells previously cultured with bortezomib at 10 nM or 100 nM when restimulated with the same donor's T cells (P = .05). By contrast, decrease in T-cell activation was not significant when T lymphocytes were restimulated with third-party T cells. Median, 50% CI, and 95% CI are shown.
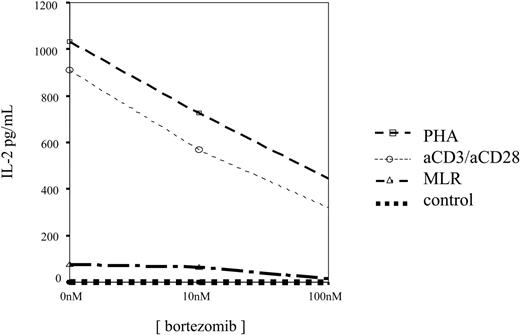
Finally, in 9 cases, ELISA assays were performed and we observed that IL-2 levels decreased in culture supernatants by increasing the concentration of bortezomib, as shown in Figure 10. It should be mentioned that in 3 PHA-activated samples, in which the concentration of 1000 nM was tested, an increased cytokine level was found in the supernatant. Of interest, these cases displayed the highest T-lymphocyte apoptosis, suggesting that activated T-cell lysis induced cytokine release into the medium.
Western blot analysis of caspase-9, caspase-3, and bcl-2 in control or PHA-stimulated cells, exposed to 100 nM bortezomib for different time periods.
Western blot analysis of caspase-9, caspase-3, and bcl-2 in control or PHA-stimulated cells, exposed to 100 nM bortezomib for different time periods.
Samples cultured with different concentrations of bortezomib with or without Z-VAD-FMK were acquired with a calibrated number of Trucount Tubes with fluorescent beads in order to calculate the absolute count of annexin V–PE–positive and/or 7-AAD–positive cells. The following equation was used: (number of events contained in annexin V–PE plus 7-AAD–negative region/number of events in absolute count bead region) × (number of beads per test/test volume). The numbers specified in the figures represent the number of beads in each test and the number of events in the annexin V–PE–positive and/or 7-AAD–positive region. The absolute number of annexin V–PE–positive and/or 7-AAD–positive events, which correspond to apoptotic cells, decreased a mean of 11%, 29%, and 49% in the presence of the pancaspase inhibitor after exposure to concentrations of 10, 100, and 1000 nM bortezomib, respectively (P < .05 for 100 and 1000 nM). Similar values were observed when only annexin V–PE–positive cells were analyzed.
Samples cultured with different concentrations of bortezomib with or without Z-VAD-FMK were acquired with a calibrated number of Trucount Tubes with fluorescent beads in order to calculate the absolute count of annexin V–PE–positive and/or 7-AAD–positive cells. The following equation was used: (number of events contained in annexin V–PE plus 7-AAD–negative region/number of events in absolute count bead region) × (number of beads per test/test volume). The numbers specified in the figures represent the number of beads in each test and the number of events in the annexin V–PE–positive and/or 7-AAD–positive region. The absolute number of annexin V–PE–positive and/or 7-AAD–positive events, which correspond to apoptotic cells, decreased a mean of 11%, 29%, and 49% in the presence of the pancaspase inhibitor after exposure to concentrations of 10, 100, and 1000 nM bortezomib, respectively (P < .05 for 100 and 1000 nM). Similar values were observed when only annexin V–PE–positive cells were analyzed.
Thus, bortezomib not only decreased the number of viable activated T lymphocytes but also modified the activation and cytokine pattern among the remaining activated T cells.
Discussion
One of the major challenges in the allogeneic transplant setting is the control of GVHD without hampering the efficacy of the procedure by decreasing the GVL effect. Thus, numerous studies have been reported showing a narrow relationship between GVHD and GVL,16,17,22 and the development of new approaches allowing the separation of both immune reactions is currently under investigation. In this sense, in vitro data suggest that GVL and GVHD are mediated by different clones of T cells. Thus, Michálek et al18 reported that it was possible to selectively deplete alloreactive donor T-cell clones after a one-way MLR by an anti-CD25 immunotoxin, while the remaining cells could be stimulated with leukemic cells from the same patient. Unfortunately, although it is a promising approach, CD25 is also expressed in regulatory T lymphocytes (Tregs),23 and in vivo depletion of these Tregs may increase the risk of GVHD.23,24 In order to overcome this problem, other membrane activation–related antigens such as CD69 have been used to selectively deplete in vitro alloreactive T cells after MLR.25
Intracellular IFN-γ expression. (A) Intracellular IFN-γ expression in CD3+ or CD4+ cells stimulated with PHAin the presence of different concentrations of bortezomib (1 of 5 similar experiments is shown). (B) Box plot of CD4+IFN+ cells for the different doses of bortezomib for the 5 samples analyzed. Error bars indicate 95% confidence intervals.
Intracellular IFN-γ expression. (A) Intracellular IFN-γ expression in CD3+ or CD4+ cells stimulated with PHAin the presence of different concentrations of bortezomib (1 of 5 similar experiments is shown). (B) Box plot of CD4+IFN+ cells for the different doses of bortezomib for the 5 samples analyzed. Error bars indicate 95% confidence intervals.
Intracellular IFN-γ expression. (A) Intracellular IFN-γ expression in CD3+CD25+ or CD3+CD4+CD25+ cells stimulated with PHA in the presence of different concentrations of bortezomib (1 of 5 similar experiments is shown). (B) Box plot of CD4+CD25+IFN+ cells for the different doses of bortezomib for the 5 samples analyzed. Error bars indicate 95% confidence intervals.
Intracellular IFN-γ expression. (A) Intracellular IFN-γ expression in CD3+CD25+ or CD3+CD4+CD25+ cells stimulated with PHA in the presence of different concentrations of bortezomib (1 of 5 similar experiments is shown). (B) Box plot of CD4+CD25+IFN+ cells for the different doses of bortezomib for the 5 samples analyzed. Error bars indicate 95% confidence intervals.
In the current paper, we have focused on the use of bortezomib as a new approach to selectively target alloreactive T cells. Bortezomib has been demonstrated to exert numerous biologic effects that include blocking the activation of NF-κB, thus inhibiting the growth of different types of tumors with augmented NF-κB activity such as multiple myeloma.11,12 Since T-cell–receptor (TCR) signaling pathways trigger NF-κB26 activation, we hypothesized that this property may promote bortezomib-mediated apoptosis among activated T lymphocytes without affecting resting T cells, which do not express activated NF-κB. As shown in MTT assays, in the current study we show that the growth inhibition induced by bortezomib was especially evident among activated T lymphocytes compared with controls. We confirmed that, as previously reported,3,27 the expression of NF-κB increases in activated T lymphocytes compared with resting T cells, thus becoming a target for the drug. Moreover, the growth inhibition was related mainly to an increased apoptosis as assessed by annexin V–PE and 7-AAD staining by flow cytometry, and this effect was significantly higher among alloreactive T lymphocytes after MLR as further confirmed in secondary MLRs. Moreover, while alloreactive reaction was abrogated in secondary MLR after exposure to the drug, this effect was much more evident when T lymphocytes were exposed to the same donors' cells compared-with third-party donors, thus suggesting a very specific depletion of alloreactive T cells that allows for maintenance of the immune response upon restimulation with other antigens.
As previously reported in different tumors and cell lines, the expression of several antiapoptotic genes, such as FLIP, cIAPs, Bcl-2, or Bcl-XL, is regulated by NF-κB.27-29 In the current paper, we confirmed that in activated human T lymphocytes bortezomib decreases NF-κB expression. In addition, bortezomib caused caspase-9 and caspase-3 cleavage with generation of truncated active fragments. These results strongly suggest that the mechanism of selective depletion of stimulated T cells by bortezomib could involve activation of proteolytic cascades orchestrated by caspases. In fact, treatment with the pancaspase inhibitor Z-VAD-FMK prevented bortezomib-induced apoptosis, supporting an essential role of caspases in this effect. As far as the proteins downstream of caspases, our data suggest that bcl-2 may participate in this proapoptotic effect. Thus, bcl-2 was overexpressed in activated compared with resting T cells, as expected from its dependence on NF-κB, and treatment with bortezomib caused its cleavage to generate a lower Mr fragment. While full-length bcl-2 is an antiapoptotic protein, truncated forms have been shown to promote apoptosis.30 Of interest, the apoptotic effect among alloreactive T lymphocytes was evident at concentrations ranging from 10 to 1000 nM of the drug, which are usually reached with the current standard doses recommended in the clinical setting. A previous study has been reported by Sun et al on a murine model,19 showing that bortezomib may prevent GVHD. Although in vitro studies using mouse T cells also showed a selective effect of the drug among activated T lymphocytes, it should be noted that the doses of the drug were significantly lower, ranging from 1 to 4 nM.19 A possible explanation for these differences would be the existence of a different sensitivity to the effect of the drug between murine and human T lymphocytes. In addition, it is worth mentioning that in order to explain the in vivo effect of the drug on GVHD prophylaxis, the effect not only on activated T cells but also on DCs must be considered,2,31 and, regarding prophylaxis, the latter may play a crucial role. Contrary to this finding, the delayed administration of bortezomib following allogeneic transplantation results in accelerated GVHD morbidity in a fully MHC-mismatched bone marrow transplantation (BMT) mouse model, and this morbidity is related mostly to gut GVHD.32 According to Sun et al,32 increased TNFα, IL-1β, and IL-6 levels were critical in GVHD development. In the present study, we observed a decrease in Th1 cytokine secretion, but, of interest, those cases that displayed the highest activated T-lymphocyte apoptosis showed an increase in IL-2 levels in the supernatant, suggesting that activated T-cell lysis induced cytokine release into the medium. This might be the case in mice with GVHD in a fully MHC-mismatched model. Additionally, bortezomib has a moderate gastrointestinal toxicity, and, as we and other authors have previously reported, organ toxicity may trigger GVHD in that specific organ.33
IL-2 concentration in 48-hour culture supernatants of unstimulated, PHA-stimulated, or anti-CD3 plus anti-CD28–stimulated T cells incubated in the presence of different concentrations of bortezomib.
IL-2 concentration in 48-hour culture supernatants of unstimulated, PHA-stimulated, or anti-CD3 plus anti-CD28–stimulated T cells incubated in the presence of different concentrations of bortezomib.
Concerning the immunophenotypic assays performed in the current study, it is worth mentioning that since the kinetics of cell-surface activation markers differ from each other,34 the analysis was performed at different intervals following lymphocyte activation. As previously mentioned, CD69 has been used24 together with or instead of CD25 depletion in order to avoid Treg depletion, which could increase the risk of GVHD. In our study, alloreactive T lymphocytes were significantly decreased by bortezomib, as assessed by early activation markers such as CD69 as well as CD25, suggesting a role for in vitro/in vivo purging using this approach.
In addition to its antiapoptotic effect, NF-κB activates multiple target genes related to immunogenic response.10 In this sense, NF-κB is not only activated through the TCR signaling pathway but also through costimulatory molecules such as CD40L or CD28,35 which are recognized as the principal receptors that generate full T-cell activation. Other transcription factors such as AP-1 and nuclear factor of activated T cells (NFAT) are triggered by downstream TCR/CD3 activation cascade,5 but, of interest, the latter is involved not only in immunogenic but also in tolerogenic responses.6 Since a competition between NFAT and NF-κB has been proposed for binding to several target genes,36 bortezomib may alter this equilibrium, thus modifying the type of immune response. In this sense, in our study NF-κB blockade not only induced activated T-cell apoptosis but also decreased the production of Th1 cytokines such as IFN-γ and IL-2 as assessed by flow cytometry and ELISA, indicating that the cytokine pattern is altered by bortezomib. Whether a tolerogenic response can be obtained or not, as recently reported using rapamycin,37 will require further studies, but the balance between NF-κB and other transcription factors such as JNF/AP-1 has already been shown to play a role in immune response by controlling DC life and death.31 Thus, NF-κB seems an ideal target for future studies trying to manipulate the immune response.
In conclusion, in the current paper we have demonstrated that bortezomib, used at concentrations reached in the clinical setting, induces apoptosis among activated T lymphocytes selectively targeting alloreactive T cells after MLR. Moreover, the cytokine pattern is also modified by NF-κB blockade, decreasing the secretion of Th1 cytokines such as IFN-γ and IL-2. This study suggests a role for this approach in the management of GVHD in the allogeneic transplantation setting.
Prepublished online as Blood First Edition Paper, November 10, 2005; DOI 10.1182/blood-2005-05-2118.
Supported by a grant (62-05) from the Gerencia Regional de Salud de Castilla y León, Spain, and by grants from the Scientific Foundation of the Asociación Española contra el Cáncer (AECC) and by the G03-136 ISC III network to J.S.M. and A.P. B.B. was supported by a fellowship from the AECC.
The publication costs of this article were defrayed in part by page charge payment. Therefore, and solely to indicate this fact, this article is hereby marked “advertisement” in accordance with 18 U.S.C. section 1734.

![Figure 1. Growth inhibition induced by bortezomib in T lymphocytes as assessed by MTT. Results are expressed as mean percentage (±SD) of absorbance at 570 nM using a spectrophotometer (100% is considered as the corresponding value of the sample incubated without bortezomib [0 nM]). Significant differences (P < .01) in cell growth were observed between PHA-stimulated T lymphocytes, MLR, and controls for the different concentrations of the drug (n = 11). When T lymphocytes were cultured with irradiated allogeneic dendritic cells (DC), T lymphocytes displayed an intermediate proliferative pattern between PHA-stimulated cultures and MLR (n = 9). Significant differences (P < .01) were observed in terms of percentage of growth inhibition within T lymphocytes stimulated with PHA, MLR, or irradiated DCs depending on the concentration of bortezomib.](https://ash.silverchair-cdn.com/ash/content_public/journal/blood/107/9/10.1182_blood-2005-05-2118/2/m_zh80090695130001.jpeg?Expires=1769181493&Signature=KweKBUd2kew~i5M6ZKC7NgggQER2ErYMHJMsDkH~Zk7fsWWG2ey08CupOsTgMyTnz5S24xDmJ1r9DA9mT2~vcVyR-Fum1yM5t-ywDM2RxtCML~MhEB-oqLBVIxrTNB4DDkZGd3BGVn5kRlUi4wVt4aVTU2wvW~o82mYXDfuZ4NGuqbe6MKGurS8xVJoIISyH306iFfG9xLt9kry0FBdqkoQ~bov~SrOM~km7luPNYHZmXpTdSYe9Y2f9mlg5PN1LxKv9tW3KcEzKm8uYacjo4AtCsehfyisF4NWmua2FIN1GqAahAezUfKw0AZcQtcdEwTV9odfa3X3spg~3Pq4sMg__&Key-Pair-Id=APKAIE5G5CRDK6RD3PGA)

This feature is available to Subscribers Only
Sign In or Create an Account Close Modal