Abstract
Chronic graft-versus-host disease (cGVHD) is a major complication of allogeneic hematopoietic stem cell transplantation but the immune mechanisms leading to the diverse clinical manifestations of cGVHD remain unknown. In this study, we examined regulatory T cells (Tregs) in 57 transplant recipients (30 with cGVHD and 27 without active cGVHD) and 26 healthy donors. Phenotypic studies demonstrated decreased frequency of CD4+CD25+ T cells in patients with cGVHD compared with patients without cGVHD (P < .001) and healthy individuals (P < .001). Gene expression of Treg transcription factor FOXP3 was reduced in cGVHD patients compared with patients without cGVHD (P = .009) or healthy donors (P = .01). T-cell receptor excision circle (TREC) assays for the evaluation of thymus activity revealed fewer TRECs in both transplant groups compared with healthy donors (P < .001 and P = .02, respectively) although no difference was observed between patients with or without cGVHD (P = .13). When tested in functional assays, Tregs from both patient cohorts and healthy individuals mediated equivalent levels of suppression. Collectively, these studies indicate that patients with active cGVHD have reduced frequencies of Tregs but the function of these cells remains normal. These findings support the development of new strategies to increase the number of Tregs following allogeneic hematopoietic stem cell transplantation to prevent or correct cGVHD. (Blood. 2005; 106:2903-2911)
Introduction
Chronic graft-versus-host disease (cGVHD) is a major cause of morbidity and mortality after allogeneic hematopoietic stem cell transplantation (HSCT).1-3 In most studies, between 30% and 75% of patients who survive after day 100 develop some clinical manifestations of cGVHD.1 Chronic GVHD occurs following engraftment of HLA-identical or HLA-mismatched stem cells and after nonmyeloablative and ablative conditioning. Chronic GVHD is presumably mediated primarily by effector T cells, and increasing degrees of HLA disparity between recipient and donor contribute to the incidence and severity of disease. However, the pathophysiology of cGVHD remains poorly understood. A paradoxic hallmark of cGVHD is the concurrent manifestation of autoimmunity, alloimmunity, and immunodeficiency.1-3 These clinical observations suggest that systemic dysregulation of the immune system may play a significant role in this disease.
CD4+CD25+ regulatory T cells (Tregs) are naturally occurring T cells whose function is to suppress autoreactive lymphocytes and control normal immune responses.4,5 Tregs develop in the thymus, and in mouse models, depletion of this subset of cells leads to proliferation of normal lymphocytes and autoimmune destruction of various tissues and organs.6 Allogeneic HSCT is known to affect thymic function and the reconstitution of T-cell lineages. Poor reconstitution of the Treg subset after HSCT could lead to the inability to suppress autoreactive and alloreactive immune cells and contribute to cGVHD. The ability of Tregs to delay the onset of acute GVHD (aGVHD) or reverse established GVHD has previously been reported in several murine models.7-12 In humans, recent investigations of Tregs after HSCT have generated conflicting results. One phenotypic study suggested that cGVHD is associated with higher absolute numbers of circulating CD4+CD25+ T cells.13 In contrast, molecular studies using quantitative polymerase chain reaction (PCR) demonstrated lower expression levels of the Treg-specific transcription factor FOXP3 in patients with both acute and chronic GVHD.14 Another study found that CD4+CD25+ Tregs were significantly reduced relative to the number of OX40+-activated cells in patients with cGVHD.15
Using phenotypic, molecular, and functional methods, we examined CD4+CD25+ Tregs in 30 patients with cGVHD after allogeneic HSCT, 27 patients without active cGVHD, and 26 healthy controls. The diagnosis of cGVHD was established using clinically and histologically accepted criteria.16 Both phenotypic and molecular assays indicated that patients with active cGVHD have a reduced frequency of circulating Tregs compared with patients without active cGVHD and healthy controls. However, when isolated in vitro, Tregs from patients and healthy individuals appeared to exhibit similar levels of immune suppressive function. We also assessed thymic activity in patients and controls using a quantitative PCR assay for T-cell receptor excision circles (TRECs). The 2 patient groups had lower TREC values compared with healthy donors, indicating that allogeneic HSCT substantially reduces thymic activity and this may contribute to Treg imbalance in these patients.
Patients, materials, and methods
Patients and samples
All patients included in this study were enrolled in clinical protocols approved by the Dana-Farber/Harvard Cancer Center Investigational Review Board. Details of patient clinical history, treatment, HSCT outcome, and symptoms of cGVHD are summarized in Table 1. Written informed consent was obtained from each patient prior to sample collection. Patient peripheral blood mononuclear cells (PBMCs) were isolated from blood samples by density gradient centrifugation and cryopreserved in aliquots before being analyzed.
Patient characteristics
. | cGVHD . | No cGVHD . | P . |
|---|---|---|---|
| Number | 30 | 27 | NA |
| Median age, y | 44 | 36 | .22 |
| Sex | .43 | ||
| Male | 17 | 12 | |
| Female | 13 | 15 | |
| Diagnosis | NA | ||
| Chronic myeloid leukemia | 11 | 5 | |
| Acute lymphoblastic leukemia | 3 | 1 | |
| Acute myeloid leukemia | 8 | 7 | |
| Myelodysplastic syndrome | 7 | 5 | |
| Multiple myeloma | 1 | 0 | |
| Non-Hodgkin lymphoma | 0 | 5 | |
| Hodgkin lymphoma | 0 | 3 | |
| Aplastic anemia | 0 | 1 | |
| Conditioning regimen | .09 | ||
| Myeloablative | 29 | 22 | |
| Nonmyeloablative | 1 | 5 | |
| Stem cell source | <.001 | ||
| Bone marrow | 26 | 10 | |
| Peripheral blood | 4 | 17 | |
| Donor | .06 | ||
| Related | 13 | 19 | |
| Unrelated | 17 | 8 | |
| HLA | .09 | ||
| Matched | 25 | 25 | |
| Mismatched | 5 | 2 | |
| Sex match, patient/donor | NA | ||
| M/M | 7 | 6 | |
| M/F | 10 | 6 | |
| F/M | 4 | 4 | |
| F/F | 9 | 11 | |
| Acute GVHD grade II to IV | .01 | ||
| No | 14 | 22 | |
| Yes | 16 | 5 | |
| Median time after transplantation | |||
| (range), mo | 24 (7-124) | 19 (5-127) | .08 |
| Immunosuppressive drugs | 29 | 12 | <.001 |
| cGVHD grade | NA | ||
| Mild | 23 | NA | |
| Moderate | 6 | NA | |
| Severe | 1 | NA |
NA indicates not applicable.
Flow cytometry
Thawed PBMCs were analyzed by flow cytometry using a series of monoclonal antibodies (Beckman Coulter, Fullerton, CA) including anti-CD3-PC5, anti-CD4-phycoerythrin (PE), anti-CD8-fluorescein isothiocyanate (FITC), and anti-CD25-FITC (clone 1HT44H3). The frequency of each cell subset was calculated as a percentage of positive cells in the total lymphocyte gate.
Quantitative PCR for FOXP3 expression
Total RNA was extracted from PBMCs using Trizol reagent according to the manufacturer's guidelines (Invitrogen, Carlsbad, CA). Complementary DNA was then prepared using 2 μg RNA using the Superscript III cDNA first-strand synthesis kit (Invitrogen). Real-time PCR was performed in triplicates using SYBR Green PCR Master Mix (Applied Biosystems, Foster City, CA) and the following primer pairs: FOXP3-forward 5′-TGCCTCCTCTTCTTCCTTGAAC-3′, FOXP3-reverse 5′-GGGCGTGGGCATCCA-3′; glyceraldehyde-3-phosphate dehydrogenase (GAPDH)-forward 5′-CCACCCATGGCAAATTCC-3′, GAPDH-reverse 5′-GATGGGATTTCCATTGATGACA-3′ on a ABI 7700 Sequence Detector (Applied Biosystems). Aliquots of a standard cDNA prepared from PBMCs collected from a healthy donor were used as standards in each plate to normalize for interplate variability. Results for the expression of FOXP3 were normalized using GAPDH signals, linearly transformed, and readjusted to the percentage of peripheral blood lymphocytes (PBLs) in total PBMCs. The final value reflects the expression level of FOXP3 within total PBLs.
TREC assay
A Taqman quantitative PCR method was used to quantify TRECs in genomic DNA extracted from patient and donor samples. The method has been described in detail elsewhere.17 Briefly, the method consists of amplifying TRECs with specific primers (sense 5′-CGTGAGAACGGTGAATGAAGAGCAGACA-3′, antisense 5′-CATCCCTTTCAACCATGCTGACACCTCT-3′) in the presence of an internal fluorochrome/quencher-labeled probe (5′-VIC-TTTTTGTAAAGGTGCCCACTCCTGTGCACGGTGA-TAMRA-3′). Each PCR reaction was performed in a 50 μL volume containing 0.075 μg genomic DNA, 1× Taqman buffer A (Perkin Elmer Cetus Institute), 3 mM MgCl2, 300 nM each primer, 100 nM probe, 200 nM deoxyadenosine triphosphate (dATP), 200 nM deoxycytidine triphosphate (DCTP), 200 nM deoxyguanosine triphosphate (DGTP), 400 nM deoxyuridine triphosphate (dUTP), 17 U uracil-DNA glycosylase (UNG), and 2 U AmpliTaq Gold DNA polymerase (Perkin Elmer). A series of standard dilutions of plasmid containing the signal-joint breakpoint was used to quantify TRECs in each patient and control DNA sample. Each patient and control DNA sample was run in triplicate on a 96-well plate along with the dilution series of the TREC plasmid. Data were readjusted based on the percentage of CD3+ T cells in total PBMCs and calculated as number of TRECs per 105 CD3+ cells.
Treg suppression assays
Suppression of antiviral T-cell reactivity was evaluated using enzyme-linked immunospot (ELISPOT) assays for the secretion of interferon γ (IFNγ). Briefly, 105 PBMCs obtained from patients with cGVHD were incubated in duplicate cultures in multiscreen immobilon-P (IP)-microplates coated with anti-IFNγ monoclonal antibody (mAb; Mabtech, Mariemont, OH) in the presence of 10 μg/mL of pooled common viral antigenic peptides presented by frequent HLA class-I molecules.18 Antiviral T-cell reactivity was assessed before and after complete depletion of CD25+ cells using anti-CD25 microbeads (Miltenyi). After overnight incubation, plates were successively labeled with a biotinylated anti-IFNγ secondary mAb (Mabtech) followed by streptavidin alkaline phosphatase (Mabtech). Spots were revealed using nitroblue tetrazolium and brom-chlor-indolyl phosphate (Promega). Percent inhibition due to the CD25+ cells was calculated as follows: % inhibition = ([no. of spots using CD25-depleted cells - no. of spots using undepleted cells]/no. of spots using CD25 depleted cells) ×100.
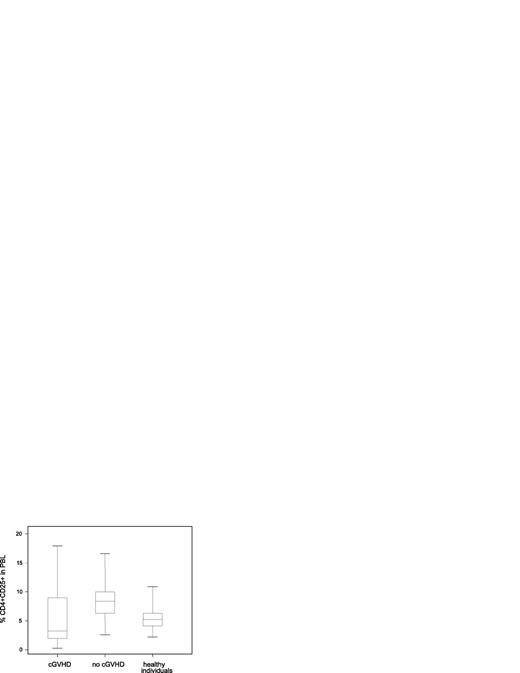
Decreased frequency of circulating CD4+CD25+ T cells in patients with cGVHD. Percent CD4+CD25+ in PBLs was measured by flow cytometry in patient and donor samples. Values represent total positive cells including CD4+ CD25+dim and CD25+high cells. Box plots define the values for median, range, 25th, and 75th percentiles. One outlier with a value of 37.5% in the group of patients with cGVHD is not shown in the figure. P values were calculated using the Wilcoxon rank-sum test; cGVHD versus no cGVHD, P = .007; cGVHD versus healthy donors, P = .29; no cGVHD versus healthy donors, P < .001.
Decreased frequency of circulating CD4+CD25+ T cells in patients with cGVHD. Percent CD4+CD25+ in PBLs was measured by flow cytometry in patient and donor samples. Values represent total positive cells including CD4+ CD25+dim and CD25+high cells. Box plots define the values for median, range, 25th, and 75th percentiles. One outlier with a value of 37.5% in the group of patients with cGVHD is not shown in the figure. P values were calculated using the Wilcoxon rank-sum test; cGVHD versus no cGVHD, P = .007; cGVHD versus healthy donors, P = .29; no cGVHD versus healthy donors, P < .001.
Suppression of T-cell proliferation by Treg
Standard assays for the suppression of proliferation were performed as previously described with minor modifications.19 Briefly, CD4+CD25- and CD4+CD25+ cells were purified from patient and donor PBMCs using the Miltenyi magnetic separation system according to the manufacturer's instructions. CD4+CD25- responder cells (1 × 10⁴ cells/well) were incubated either alone or in the presence of CD4+CD25+ Treg cells (1 × 10⁴ cells/well; ratio, 1:1) in round-bottom microplates coated with OKT3 (1 μg/mL) in the presence of 1 × 10⁴ irradiated allogeneic PBMCs as feeder cells. After 6 days, cells were pulsed overnight with 3H thymidine. Incorporation of radioactivity was measured using a scintillation counter. Percent inhibition of proliferation was calculated as follows: % inhibition = ([cpm responder cells alone - cpm responder/Treg]/cpm responder alone) × 100.
Statistical methods
For 2 × 2 table analysis, a 2-sided Fisher exact test was performed. For 2-sample comparison of continuous variables, a 2-sided Wilcoxon rank-sum test was performed. Pairwise group comparisons are not adjusted for multiple comparisons. Measure of correlation was calculated and tested using the Spearman rank method. Smoothing spline curve estimation technique was used to characterize the pattern of correlation. Several statistical approaches were explored to establish cut-off points for percent CD4+CD25+. These approaches included taking the 95th or 99th percentile value, taking the mean plus 2 standard deviation (STD) value from the log-transformed distribution and a classification and regression tree. The cut-off point of 3.0% was established from these approaches. Linear and logistic regression analyses for Tregs were performed to adjust differences in patient baseline characteristics between patients with cGVHD and those without cGVHD.
Results
Patients
In this retrospective study, 57 patients and 26 healthy donors were analyzed. Patient characteristics are summarized in Table 1. There were 30 patients with active mild (n = 23), moderate (n = 6), or severe (n = 1) cGVHD at the time of sample collection. These clinical grades were assigned by one author (S.J.L.) blinded to Treg results using the criteria of the Center for International Blood and Marrow Transplant Research (CIBMTR). Patients with cGVHD were studied at a median of 24 months after transplantation, and 29 of 30 were receiving immunosuppressive drugs. Patients without active cGVHD were studied at a median of 19 months after transplantation, and only 12 of 27 were receiving immunosuppressive agents at this time. Of 30 patients with active cGVHD, 16 had previously had grade 2 to 4 acute GVHD but only 5 of 27 patients without active cGVHD had a history of prior acute GVHD (P = .01). Within the group of patients without active cGVHD, 12 had previously had chronic GVHD that had resolved by the time of analysis for this study. Posttransplantation GVHD prophylaxis consisted of cyclosporine/prednisone/mycophenolate mofetil or tacrolimus/methotrexate with or without rapamycin. Twenty-six of 30 patients with cGVHD and 10 of 27 patients without active cGVHD (P < .001) had received bone marrow stem cell grafts. All other patients received granulocyte-colony-stimulating factor (G-CSF)-mobilized peripheral blood stem cells. All 26 healthy donors were adults.
Decreased frequency of CD4+CD25+ T cells associated with cGVHD
Percentages of CD4+CD25+ in total PBLs were determined by flow cytometry to evaluate the frequency of Tregs relative to other blood lymphocytes. As shown in Figure 1, patients with cGVHD had significantly lower percentages of CD4+CD25+ in total PBLs compared with patients without active cGVHD (P = .007). The median value for the cGVHD group was also lower than that observed for healthy donors; however, this difference did not reach statistical significance (P = .29). Patients without active cGVHD also had significantly higher CD4+CD25+ values than the control population (P < .001). Interestingly, both patient groups had decreased percentages of CD3+CD4+ in total PBLs compared with healthy individuals (P < .001; data not shown). These results support the view that CD4+CD25+ cells are independently regulated among total CD3+CD4+ cells. Because of the limited number of patients with moderate or severe cGVHD, we were not able to evaluate the association of CD4+CD25+ cells with severity of cGVHD.
Since CD25 is not a unique marker of Tregs and can also be expressed on activated T cells, the wide range of percent CD4+ CD25+ values shown in Figure 1 could reveal the presence of effector rather than regulatory T cells in some samples. We therefore considered alternative methods of comparing different groups. Based on the distribution of the healthy donors, we established a cut-off point of 3.0 to use in comparing different groups. As seen in Table 2, using this cut-off point, 50% (15/30) of patients with cGVHD had low % CD4+CD25+ (less than or equal to 3.0%) whereas only 3.7% (1/27) of patients without active cGVHD (P < .001) and 8% (2/26) of healthy individuals had low percentages of CD4+CD25+ (P < .001). As the stem cell source, prior acute GVHD and frequency of related donors appeared to be different between patients with cGVHD and patients without cGVHD, we performed a linear regression model for percentages of CD4+CD25+ on a continuous scale and a logistic model for dichotomous percentages of CD4+CD25+ (> 3.0% vs ≤ 3.0%) after adjusting all these factors and age but excluding patient treatment. Immunosuppressive therapy was not adjusted because nearly all patients with cGVHD received immunosuppressive drugs. Active cGVHD was the only significant factor for lower frequency of CD4+CD25+ in PBLs (P = .01 from a logistic regression model and P = .049 from a linear regression model). There was no correlation between phenotypic determination of Tregs and the time of sample collection after transplantation (P = .29) or sex matching (P = .29). Likewise there was no correlation between % CD4+CD25+ and the source of stem cells among patients without cGVHD (P = .82).
CD4+ CD25+ Tregs in peripheral blood
CD4+CD25+/PBL ratios . | cGVHD . | No cGVHD . | Healthy donors . |
|---|---|---|---|
| Less than or equal to 3%, no. (%) | 15/30 (50.0) | 1/27 (3.7) | 2/26 (7.7) |
| Greater than 3%, no. (%) | 15/30 (50.0) | 26/27 (96.3) | 24/26 (92.3) |
CD4+CD25+/PBL ratios . | cGVHD . | No cGVHD . | Healthy donors . |
|---|---|---|---|
| Less than or equal to 3%, no. (%) | 15/30 (50.0) | 1/27 (3.7) | 2/26 (7.7) |
| Greater than 3%, no. (%) | 15/30 (50.0) | 26/27 (96.3) | 24/26 (92.3) |
cGVHD versus no cGVHD: P<.001; cGVHD versus healthy donors: P<.001; no cGVHD versus healthy donors: P = .61.
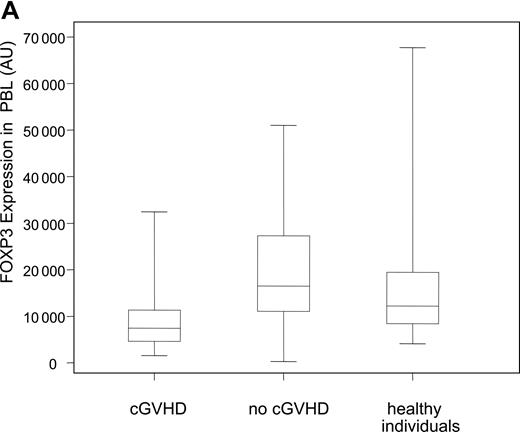
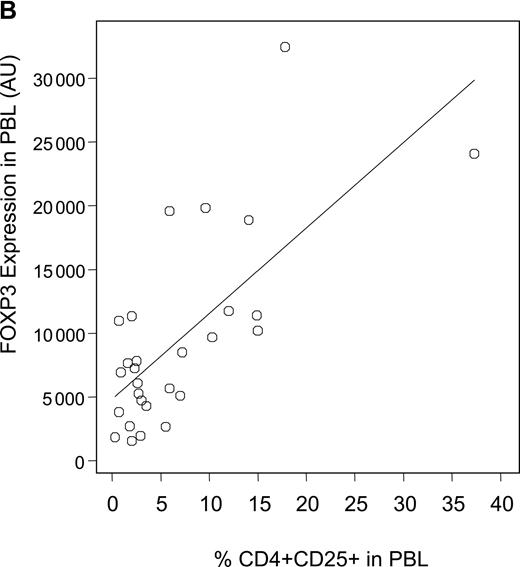
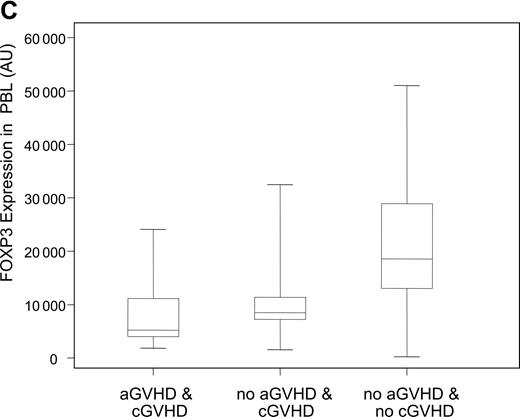
Decreased expression levels of FOXP3 in patients with cGVHD. (A) Expression levels of the Treg-specific transcription factor FOXP3 was assessed by quantitative PCR in patient and donor samples, normalized, and reported as a function of total lymphocytes (AU, arbitrary units). Box plots define the values for median, range, 25th, and 75th percentiles. P values were calculated using the Wilcoxon rank-sum test; cGVHD versus no cGVHD, P = .009; cGVHD versus healthy donors, P = .01; no cGVHD versus healthy donors, P = .34. (B) Correlation between CD4+CD25+ phenotypic values and FOXP3 expression levels in patients with cGVHD was calculated using a rank-based Spearman test (P < .001; rs = 0.60). (C) Patients with cGVHD were subdivided according to whether they previously developed aGVHD. Box plots define the values for median, range, 25th, and 75th percentiles. P values were calculated using the Wilcoxon rank-sum test; aGVHD and cGVHD versus no aGVHD and cGVHD, P = .29; aGVHD and cGVHD versus no aGVHD and no cGVHD, P < .001; no aGVHD and cGVHD versus no aGVHD and no cGVHD, P = .005.
Decreased expression levels of FOXP3 in patients with cGVHD. (A) Expression levels of the Treg-specific transcription factor FOXP3 was assessed by quantitative PCR in patient and donor samples, normalized, and reported as a function of total lymphocytes (AU, arbitrary units). Box plots define the values for median, range, 25th, and 75th percentiles. P values were calculated using the Wilcoxon rank-sum test; cGVHD versus no cGVHD, P = .009; cGVHD versus healthy donors, P = .01; no cGVHD versus healthy donors, P = .34. (B) Correlation between CD4+CD25+ phenotypic values and FOXP3 expression levels in patients with cGVHD was calculated using a rank-based Spearman test (P < .001; rs = 0.60). (C) Patients with cGVHD were subdivided according to whether they previously developed aGVHD. Box plots define the values for median, range, 25th, and 75th percentiles. P values were calculated using the Wilcoxon rank-sum test; aGVHD and cGVHD versus no aGVHD and cGVHD, P = .29; aGVHD and cGVHD versus no aGVHD and no cGVHD, P < .001; no aGVHD and cGVHD versus no aGVHD and no cGVHD, P = .005.
Decreased expression of FOXP3 in PBLs from patients with cGVHD
To assess Tregs in patient and donor samples, we also measured the expression of the Treg-specific transcription factor FOXP3 using a quantitative PCR assay. Figure 2A summarizes the expression of FOXP3 transcripts in PBLs for both patient groups and healthy donors. Patients with active cGVHD have significantly lower expression of FOXP3 when compared with patients without cGVHD (P = .009) or healthy donors (P = .01). As with phenotypic results, occurrence of cGVHD was the only risk factor for lower levels of FOXP3 when all other factors such as age, source of stem cell, grade 2 to 4 acute GVHD, and donor type, but excluding immunosuppressive therapy, were adjusted in a linear model (P = .02). There was no correlation between FOXP3 values and time of sample collection (P = .62) or sex matching (P = .92). In addition, we did not observe any correlation between FOXP3 expression and the source of stem cells in patients without cGVHD (P = .40). We next examined whether phenotypic assessment of CD4+CD25+ T cells correlated with molecular assessment of FOXP3 in samples from patients with cGVHD. As shown in Figure 2B, there is a significant correlation between percentages of circulating CD4+CD25+ T cells determined by flow cytometry and the level of FOXP3 transcripts measured by quantitative PCR. We confirmed the correlation using a rank-based Spearman correlation test (rs = 0.60, P < .001). Acute GVHD (aGVHD) is a predominant risk factor for cGVHD. We next analyzed whether FOXP3 expression correlated with cGVHD independently of previous occurrence of aGVHD. As shown in Figure 2C, the lowest levels of expression of FOXP3 were observed in patients who had cGVHD after aGVHD. Remarkably, patients with de novo cGVHD (no previous aGVHD) had reduced FOXP3 expression levels compared with patients without acute or chronic GVHD. These results indicate that reduced Tregs in these patients correlates with the development of cGVHD independently of aGVHD.
As mentioned previously, within the no-cGVHD group, 12 patients previously had cGVHD that had resolved at the time of sample collection. We compared flow cytometric and molecular Treg measurements for these patients to those who had never developed cGVHD. As reported in Table 3, there was no significant difference between the 2 subgroups, strongly suggesting that resolution of cGVHD is accompanied by a readjustment of Treg values toward normal values.
Phenotypic and molecular Treg markers in patients without cGVHD
Previous occurrence of cGVHD . | No . | Yes (resolved) . | P . |
|---|---|---|---|
| %CD4+CD25+/PBLs, median (range) | 8.3 (2.6-12.4) | 8.7 (4.0-16.6) | .44 |
| FOXP3 expression, AU, median (range) | 17548 (268.5-48 327) | 14872 (4 916-51 029) | .94 |
Previous occurrence of cGVHD . | No . | Yes (resolved) . | P . |
|---|---|---|---|
| %CD4+CD25+/PBLs, median (range) | 8.3 (2.6-12.4) | 8.7 (4.0-16.6) | .44 |
| FOXP3 expression, AU, median (range) | 17548 (268.5-48 327) | 14872 (4 916-51 029) | .94 |
AU indicates arbitrary units.
Inverse correlation between CD4+CD25+ Tregs and CD3+CD8+ T cells
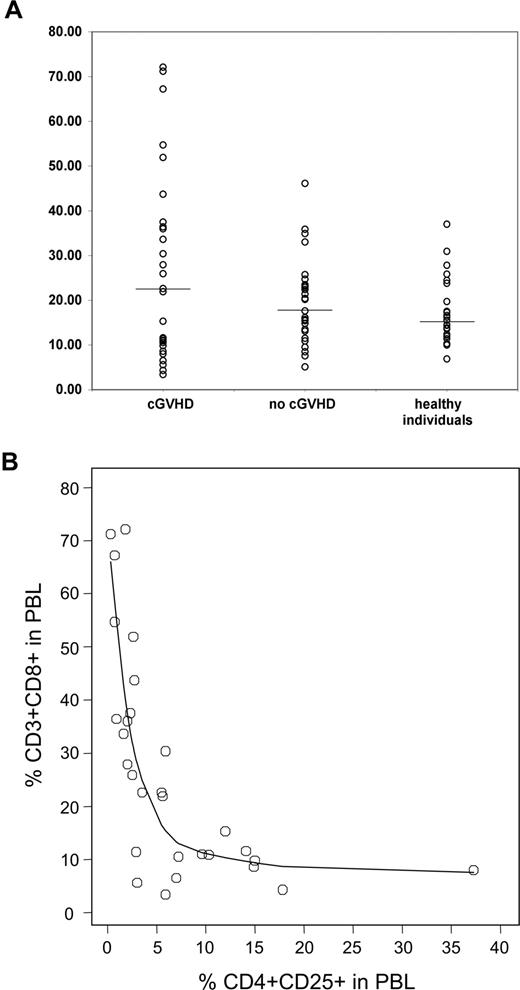
In addition to CD4+CD25+ Tregs, we also examined other lymphocyte populations in all samples from patients and healthy controls. Effector T cells are predominately CD3+CD8+ T cells, and phenotypic studies revealed a highly heterogeneous distribution of CD3+CD8+ values for the cGVHD group (Figure 3A). In contrast, patients without cGVHD showed little variation of CD3+CD8+ T cells compared with healthy individuals. As shown in Figure 3B, we found a striking inverse correlation between the percentages of CD4+CD25+ and CD3+CD8+ T cells in samples from patients with cGVHD (rs =-0.81, P < .001), providing further evidence for a physiologic interaction between these 2 subpopulations. This correlation was also highly significant when results from all patients were combined and analyzed (P < .001; data not shown). Remarkably, there was no correlation between percent CD3+CD8+ cells and total CD3+CD4+ cells in these patient samples (data not shown).
Correlation between CD3+CD8+ and CD4+CD25+ T cells in active cGVHD. (A) Percent CD3+CD8+ in PBLs was measured by flow cytometry in patient and donor samples. Lines represent median values. (B) Percent CD4+CD25+ and CD3+CD8+ T cells in total PBLs are shown for patients with cGVHD. Correlation between the 2 variables was calculated using a rank-based Spearman test (rs = -0.81, P < .001).
Correlation between CD3+CD8+ and CD4+CD25+ T cells in active cGVHD. (A) Percent CD3+CD8+ in PBLs was measured by flow cytometry in patient and donor samples. Lines represent median values. (B) Percent CD4+CD25+ and CD3+CD8+ T cells in total PBLs are shown for patients with cGVHD. Correlation between the 2 variables was calculated using a rank-based Spearman test (rs = -0.81, P < .001).
Patient CD4+CD25+ Treg frequency correlates with their suppressive function
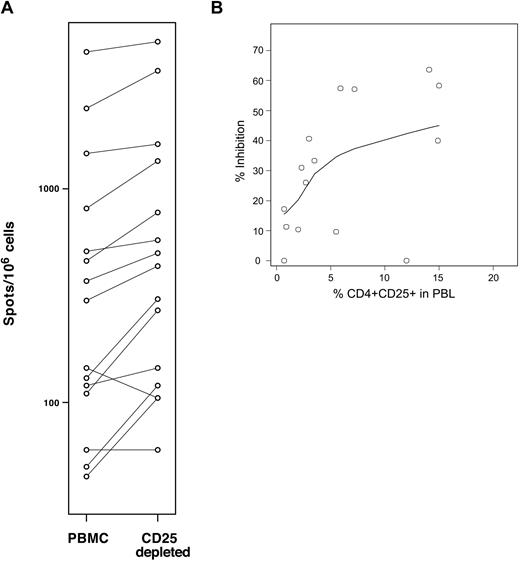
Based on the strong correlation between CD4+CD25+ and CD3+CD8+ T cells, we developed an in vitro assay to measure the suppressive function of patient Tregs on autologous antigen-specific cytotoxic T lymphocyte (CTL) responses. In this assay, patient PBMCs are stimulated with a panel of 17 previously characterized class I-restricted viral epitopes from cytomegalovirus (CMV), Epstein-Barr virus (EBV), and influenza.18 Specific CTL reactivity is measured using an IFNγ secretion ELISPOT assay before and after depletion of CD25+ Tregs. Depletion of CD25+ regulatory T cells increases the number of effector T cells responding to the pool of viral peptides. The difference between the reactivity obtained in the presence and absence of CD25+ cells reflects the level of suppression of antiviral CTLs due to Tregs. Figure 4A shows the results obtained using samples from 15 patients with cGVHD tested in this assay. In these experiments, percent inhibition due to the presence of CD25+ cells was calculated to be between 0% (2 samples) and 59.2%. Figure 4B summarizes the inhibitory activity measured for these 15 patients with cGVHD plotted along with the percentages of CD4+CD25+ T cells in these samples. As shown in the figure, there is a significant correlation between Treg frequencies measured by flow cytometry and their suppressive function measured in this in vitro assay (P = .02; rs = 0.59).
Percent CD4+CD25+ in PBLs correlates with Treg suppressive function in cGVHD. (A) CTL reactivity against a pool of class I-restricted common viral peptides was assessed by IFNγ ELISPOT assays before and after CD25+ T-cell depletion using 15 samples collected from patients with cGVHD. Depletion of CD25+ cells was confirmed by flow cytometry for each sample. (B) Percent inhibition was measured for 15 patients with cGVHD and values are plotted together with percent CD4+CD25+. One sample generated a negative value and was interpreted as null. Correlation between the 2 variables was calculated using a rank-based Spearman test (rs = 0.59, P = .02).
Percent CD4+CD25+ in PBLs correlates with Treg suppressive function in cGVHD. (A) CTL reactivity against a pool of class I-restricted common viral peptides was assessed by IFNγ ELISPOT assays before and after CD25+ T-cell depletion using 15 samples collected from patients with cGVHD. Depletion of CD25+ cells was confirmed by flow cytometry for each sample. (B) Percent inhibition was measured for 15 patients with cGVHD and values are plotted together with percent CD4+CD25+. One sample generated a negative value and was interpreted as null. Correlation between the 2 variables was calculated using a rank-based Spearman test (rs = 0.59, P = .02).
Patient Tregs exert normal levels of suppression
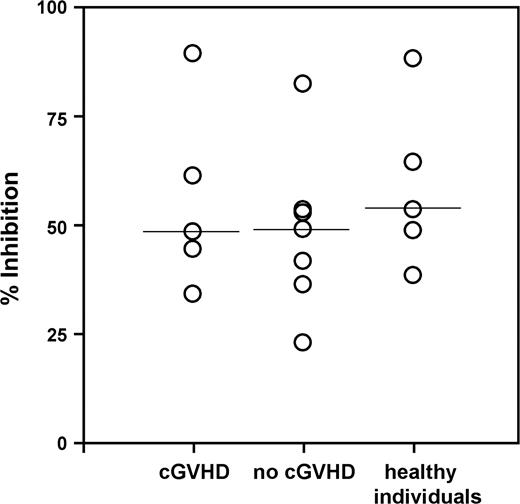
The previous series of experiments established a correlation between the number of Tregs and their level of suppressive activity. We next investigated whether Tregs isolated from patients with or without cGVHD as well as from healthy donors displayed similar levels of suppressive activity. Using antibody-coated magnetic particles, CD4+CD25+ Tregs were purified from patients and donors and tested for their capacity to inhibit the proliferation of autologous CD4+CD25- T cells stimulated with anti-CD3. Results obtained from 5 patients with cGVHD, 7 patients without cGVHD, and 5 controls are shown in Figure 5. Although this analysis was limited by the number of samples available, we could not detect any significant differences between the suppressive activities of Tregs isolated from patient and donor groups. These findings suggest that Tregs isolated from cGVHD patients exert similar levels of suppression as Tregs purified from patients without cGVHD or healthy donors.
Patient Tregs express normal levels of suppression. CD4+CD25+ Tregs were immunopurified from PBMCs and assessed for their capacity to suppress the proliferation of autologous CD4+CD25- cells at a responder/Treg ratio of 1:1. Percent inhibition of responder cell proliferation due to the presence of Tregs was measured using 17 samples collected from 5 cGVHD patients, 7 patients without cGVHD, and 5 healthy individuals. The solid lines represent the median values.
Patient Tregs express normal levels of suppression. CD4+CD25+ Tregs were immunopurified from PBMCs and assessed for their capacity to suppress the proliferation of autologous CD4+CD25- cells at a responder/Treg ratio of 1:1. Percent inhibition of responder cell proliferation due to the presence of Tregs was measured using 17 samples collected from 5 cGVHD patients, 7 patients without cGVHD, and 5 healthy individuals. The solid lines represent the median values.
Decreased thymic activity following allogeneic HSCT
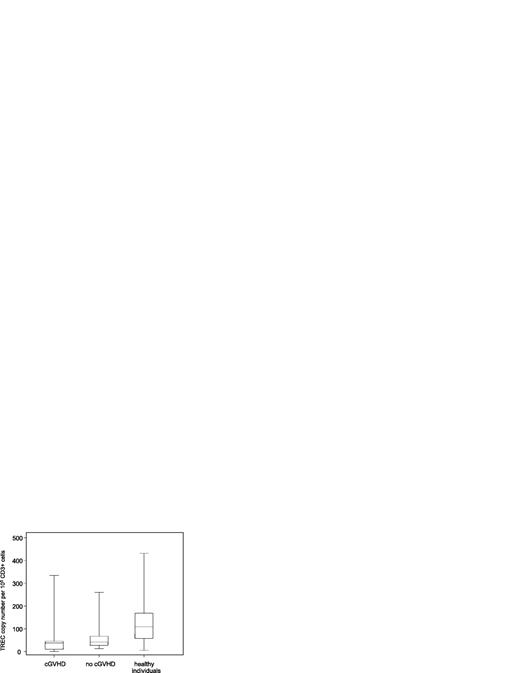
To examine thymic activity, TREC copy numbers in DNA extracted from patient and control samples were measured using quantitative PCR. As shown in Figure 6, patients with or without cGVHD showed a significant decrease in TRECs compared with healthy donors (P < .001). These data support previous reports that thymic function is substantially impaired following allogeneic HSCT. However, in contrast to other published studies, we could not find any significant difference between the 2 patient groups.20,21 In addition, there was no correlation between TREC values and either percentages of CD4+CD25+ cells or FOXP3 levels (data not shown).
Allo-transplant patients have impaired thymus function. Thymic activity was assessed in patient and donor samples using the TREC assay and represented as TREC copy number per 105 CD3+ T cells. Box plots define the values for median, range, 25th, and 75th percentiles. One outlier with a value of 1292 in the group of no-cGVHD patients is not shown in the figure. P values were calculated using the Wilcoxon rank-sum test; cGVHD versus no cGVHD, P = .13; cGVHD versus healthy donors, P < .001; no cGVHD versus healthy donors, P = .02.
Allo-transplant patients have impaired thymus function. Thymic activity was assessed in patient and donor samples using the TREC assay and represented as TREC copy number per 105 CD3+ T cells. Box plots define the values for median, range, 25th, and 75th percentiles. One outlier with a value of 1292 in the group of no-cGVHD patients is not shown in the figure. P values were calculated using the Wilcoxon rank-sum test; cGVHD versus no cGVHD, P = .13; cGVHD versus healthy donors, P < .001; no cGVHD versus healthy donors, P = .02.
Discussion
Several recent studies in murine models have demonstrated the critical role of Tregs in controlling GVHD after allogeneic HSCT.7-12 In humans, it is still unclear whether impairment of Treg populations after transplantation contributes to the development of acute or chronic GVHD. Thus far, only 3 studies have examined Tregs following allogeneic HSCT using either phenotypic or molecular techniques, and these studies have generated conflicting results.13-15 To address this issue we performed a retrospective analysis of Tregs following allogeneic HSCT using independent phenotypic markers as well as functional assays. Moreover we focused entirely on cGVHD, and results in patients with active clinical manifestations of disease were compared with patients without active disease as well as healthy controls.
Tregs are described through their capacity to suppress other immune cells, including CD4+CD25- T cells, CD3+CD8+ T cells, and natural killer (NK) cells.22-26 Based on the wide range of Treg target immune cells, we chose to examine the frequency of CD4+CD25+ cells over total lymphocytes as a quantitative measurement of these cells. Our approach to analyze Treg populations differed from that of Clark et al,13 who examined absolute CD4+CD25+ cell counts in the blood of patients with cGVHD. Remarkably, the 2 different methods generated conflicting results. In contrast to absolute numbers, we believe frequency measurements reflect the ratio of Tregs to the total number of cells to be regulated and thus represent a more accurate reflection of the function of these cells in vivo. Most assays used to demonstrate the suppressive activity of Tregs in vitro are based on the same principle of measuring function for defined regulatory-responder cell ratios. In addition, we confirmed our flow cytometry results by assessing FOXP3 gene expression as a complementary method to measure Tregs.
Interleukin 2 (IL-2) plays a critical role in the development and maintenance of Tregs, and the constitutive expression of IL-2 receptor α chain (CD25) is widely used as a phenotypic marker of these cells. However, CD25 is expressed on other functional T lymphocytes upon activation and is therefore not specific to Tregs. Accordingly, we considered whether the CD25+ cells identified by flow cytometry in some transplant patients could represent activated effector T cells as well as Tregs. This was consistent with the heterogeneous number of CD4+CD25+ cells found in the cGVHD patient group. In our studies, analysis of dichotomized populations underscored the observation that a large fraction of cGVHD patients (50%) had low values (less than or equal to 3%), which necessarily revealed reduced Tregs. The fact that we observed such low values almost exclusively in patients with active cGVHD supports our main hypothesis. Interestingly, even if CD4+CD25+ cell frequencies were respectively low and high for patients with or without cGVHD compared with healthy donors, percentages of total CD4+ T cells were lower for both patient groups. This indicates that frequency of CD4+CD25+ does not follow values for total CD4+ cells and further suggests that Tregs constitute an independently regulated T-cell subset among CD4+ cells.
In several independent studies, the expression of the FOXP3 gene has been associated with the functional suppressive capacity of Tregs.27-30 Our results showed a decrease in FOXP3 levels in cGVHD patients compared with control groups, confirming a quantitative defect in Treg populations. The correlation between the expression of FOXP3 and the number of CD4+CD25+ cells in cGVHD patient samples was also instrumental in validating both parameters for the detection of Tregs. As Tregs may be composed of distinct subsets of cells expressing different markers, the use of complementary methods is better suited to quantify these regulatory cells in patient blood samples. Although apparently moderate, the difference in both molecular and phenotypic Treg values was statistically significant. On average, Treg frequency was reduced by half in patients with cGVHD compared with control patients. Likewise, median for FOXP3 values in patients with cGVHD was approximately half the median for the no-cGVHD group. We believe this difference to be physiologically relevant. Naturally occurring Tregs are present at a low frequency in the blood of healthy individuals. Yet their critical role in controlling a wide range of immune responses has been demonstrated in many model systems. Even a modest decrease in the pool size of these cells can have considerable implications for the balance of immune responsiveness after transplantation. Similar levels of reduction have also been reported in other clinical studies in different diseases.31,32
CD3+CD8+ cytolytic T cells are important effector cells in both acute and chronic GVHD.33-39 In our studies, the frequency of CD3+CD8+ cells in PBLs was inversely correlated with the frequency of CD4+CD25+ cells, suggesting a direct physiologic relation between Tregs and CTLs. This association might reflect the balance of the posttransplant immune response tipping between 2 extremes: increased Tregs associated with decreased cytolytic effector T cells, corresponding to a controlled immune response, or decreased Tregs associated with larger numbers of CTLs, resulting in escalating immune responses. Further studies will be required to confirm this notion.
In addition to phenotypic analysis, we undertook a functional assessment of Tregs in our patients and donor samples. In most studies, the functional suppression of immune responses has correlated well with the phenotypic assessment of Tregs. However, there are also well-documented examples of phenotypically normal Tregs that exhibit impaired suppressive function.19 Our experiments confirmed that the overall suppression activity is primarily a function of the percentage of Tregs in the blood in patients with cGVHD. Additional functional assays indicated that Tregs isolated from both patient groups exhibited comparable suppressive capabilities as Tregs purified from healthy donors. Although we could perform this assay with only a small number of samples, these findings confirm a previous report by Clark et al13 demonstrating that Tregs from patients with cGVHD are not impaired in their suppressive function.
Almost all patients with cGVHD as well as a significant number of patients without cGVHD had received various combinations of immunosuppressive drugs. From our data we cannot entirely exclude the possibility that these treatments affected the frequency and function of Treg populations in vivo. However, there was no significant difference in values for either the phenotypic or the molecular Treg marker (P = .26 and P = .9, respectively) between patients treated with immunosuppressive drugs and patients not treated within the no-cGVHD group. This demonstrated that immunosuppressive medication alone cannot explain reduction in Treg frequencies. Moreover, results from our cell-based assays did not show any significant variations in T-cell function that could reflect such modulation. On the contrary, cells isolated from patients with or without cGVHD as well as control healthy donors exhibited similar levels of reactivity in vitro even though all cGVHD patients were receiving immune suppressive therapy at the time of analysis.
Our comprehensive series of experiments provide substantial evidence that active cGVHD correlates with decreased Treg populations after allogeneic HSCT but not impaired function of these cells. The cause of the Treg reduced frequency remains unclear. Previous development of acute GVHD is well recognized as a major risk factor for cGVHD and could have contributed to immune imbalance or thymic injury and subsequent Treg quantitative defects. However, patients with “de novo” cGVHD also had reduced Treg frequency, indicating that the defect is independent of previous aGVHD. Alternatively, it is conceivable that lower Treg frequency results from a poor reconstitution of T-cell lineages in transplant recipients. Following HSCT, T-cell lineages are reconstituted through combined expansion of mature peripheral cells and the export of new T cells from the thymus. Reduced thymic activity after HSCT would result in impaired reconstitution of Tregs as well as naive T cells. However, in our samples we could not detect any association between TREC values, Treg frequency, and cGVHD. Regardless of their GVHD status, all transplantation patients had lower TREC copy numbers. Remarkably, the TREC assay we used in these experiments measures the abundance of newly differentiated T cells among all CD3+ cells in the periphery without any distinction between effector and Tregs. Therefore, this assay does not account for any defined subset of T cells. Further studies will be required to assess the reconstitution of specific T-cell subpopulations, and especially Tregs, following allogeneic HSCT. Likewise, longitudinal follow-up of transplantation patients will be required to establish whether improved Treg reconstitution correlates with the resolution of active cGVHD and a better clinical outcome. Nevertheless, our findings give further support for new treatment aimed at reconstituting or enhancing Treg populations in an attempt to correct cGVHD in patients with active disease.
Prepublished online as Blood First Edition Paper, June 21, 2005; DOI 10.1182/blood-2005-03-1257.
Supported by the Jock and Bunny Adams Research and Education Endowment, the Ted and Eileen Pasquarello Research Fund, and National Institutes of Health grants AI29530 and HL70149. E.Z. is a special fellow of the Leukemia and Lymphoma Society.
The publication costs of this article were defrayed in part by page charge payment. Therefore, and solely to indicate this fact, this article is hereby marked “advertisement” in accordance with 18 U.S.C. section 1734.
We are indebted to Leah Gordon, Evan McEwing, Marcia Chesterfield, and Christine Canning for their help in collecting patient samples.

This feature is available to Subscribers Only
Sign In or Create an Account Close Modal