Abstract
Treatment resistance, as indicated by the presence of high levels of minimal residual disease (MRD) after induction therapy and induction consolidation, is associated with a poor prognosis in childhood acute lymphoblastic leukemia (ALL). We hypothesized that treatment resistance is an intrinsic feature of ALL cells reflected in the gene expression pattern and that resistance to chemotherapy can be predicted before treatment. To test these hypotheses, gene expression signatures of ALL samples with high MRD load were compared with those of samples without measurable MRD during treatment. We identified 54 genes that clearly distinguished resistant from sensitive ALL samples. Genes with low expression in resistant samples were predominantly associated with cell-cycle progression and apoptosis, suggesting that impaired cell proliferation and apoptosis are involved in treatment resistance. Prediction analysis using randomly selected samples as a training set and the remaining samples as a test set revealed an accuracy of 84%. We conclude that resistance to chemotherapy seems at least in part to be an intrinsic feature of ALL cells. Because treatment response could be predicted with high accuracy, gene expression profiling could become a clinically relevant tool for treatment stratification in the early course of childhood ALL.
Introduction
Acute lymphoblastic leukemia (ALL) is the most common malignancy in childhood. Major advances have been made in the treatment of childhood ALL in the past several decades, based on the identification of prognostic markers and the development of risk-adapted treatment strategies. However, for approximately 25% of patients therapy still fails, and surviving patients often experience significant toxicities.1 Therefore, improved assessment of a patient's risk for relapse is necessary so that treatment can be adapted and the chance for survival can be enhanced.
In trial ALL–Berlin-Frankfurt-Münster 2000 (ALL-BFM 2000), a risk-adapted treatment stratification (standard, intermediate, and high risk) is performed using cytogenetic markers (t(9;22) and t(4;11)) or their molecular equivalents (BCR-ABL and MLL-AF4) and the in vivo response to treatment. Response is assessed cytomorphologically by the initial cytoreduction (blast reduction in peripheral blood after 7 days of treatment; blast clearance from the bone marrow after induction therapy on treatment day 33) or molecularly by the measurement of minimal residual disease (MRD) on treatment day 33 and after induction consolidation at week 12. Measurement of MRD is based on the detection of clone-specific immunoglobulin and T-cell–receptor gene rearrangements by polymerase chain reaction (PCR) amplification. The level of sensitivity reached in most cases is 10-4 to 10-5 (detection of one leukemic cell per 104-105 cells).2
Even though patients show similar clinical characteristics at diagnosis, despite the fact that the leukemic cells appear biologically and phenotypically homogeneous and that patients receive the same initial induction and consolidation therapy, some patients have no detectable MRD on treatment day 33 and at week 12 (MRD standard risk [MRD-SR]), whereas others still have a high MRD load at week 12 (10-3 or greater, MRD high risk [MRD-HR]). In a third group of patients, MRD is measurable at a low level (less than 10-3, MRD intermediate risk [MRD-IR]). In vivo response to initial therapy, as assessed systematically by the determination of MRD at 5 and 12 weeks of treatment, has evolved as the strongest prognostic factor in pediatric ALL if patients are treated by the BFM regimen. The probability of relapse-free survival in MRD-SR patients is more than 95%, whereas for MRD-HR patients it is only 19%.2
We hypothesized that the response to induction therapy and induction consolidation is determined before treatment and that this is reflected in the pattern of gene expression in ALL cells. Furthermore, we hypothesized that treatment resistance can be predicted before treatment, which would allow early treatment adjustment. To test these hypotheses, we compared leukemic gene expression profiles in a set of patients with childhood ALL who were homogeneous with regard to relevant prognostic factors and who differed only in their molecular treatment response (MRD-HR vs MRD-SR).
Patients, materials, and methods
Patients and study design
In accordance with institutional review board regulations, clinical samples were obtained from children with ALL before treatment was initiated. Children were assigned to risk and treatment groups according to the ALL-BFM 2000 protocol. Mononuclear cells were isolated from bone marrow aspirate or peripheral blood using Ficoll-Paque (Amersham Biosciences, Piscataway, NJ). Cells were placed in RPMI 1640 with 10% heat-inactivated fetal calf serum, penicillin (100 U/mL), streptomycin (100 μg/mL), l-glutamine (2 mM), and 10% dimethyl sulfoxide (DMSO) and were frozen in liquid nitrogen for long-term storage. Each sample was tested for the presence of BCR-ABL, TEL-AML1, and MLL-AF4 rearrangements by reverse transcription–polymerase chain reaction (RT-PCR).3 Positive results were confirmed by fluorescence in situ hybridization. In ALL-BFM 2000, cytogenetic analysis was not required if at least these (prognostically relevant) fusion genes had been sought. Flow cytometry was performed according to European Group for the Immunological Characterization of Leukemias (EGIL) standards.4 E2A-PBX1 fusion gene transcripts were amplified as described previously.5 MRD was measured on treatment day 33 and at week 12.2
Patients from the entire study population of the ongoing ALL-BFM 2000 trial were included in our study if their MRD loads qualified for the MRD-HR or the MRD-SR group and, to ensure homogeneity with regard to prognostic factors, if they fulfilled the following criteria: B-cell precursor or common ALL; DNA index of 1.0; no BCR-ABL, no MLL-AF4, and no TEL-AML1 rearrangements; and absence of conditions predisposing to leukemia. Bone marrow or peripheral blood specimens had to contain more than 80% blasts, as assessed morphologically before gradient centrifugation.
RNA isolation, amplification, and reference RNA
Total RNA of the primary set was isolated with Trizol reagent (Invitrogen, Paisley, United Kingdom) and subsequently was passed over a Qiagen RNeasy column (Qiagen, Hilden, Germany) for the removal of small fragments. The RNA of an independent test set was previously prepared using the RNeasy minikit (Qiagen) according to manufacturer's instructions. Each of the total RNA samples was linearly amplified using the MessageAmp aRNA Kit (Ambion, Austin, TX). Total and amplified RNA were quantified and validated for integrity using the Bioanalyzer 2100 (Agilent, Palo Alto, CA). The reference RNA used for all the arrays was Universal Human Reference RNA (Stratagene Europe, Amsterdam, The Netherlands) and was linearly amplified using the same method.
Gene expression measurements and analyses
Spotted cDNA microarrays were used that contained more than 43 000 features representing approximately 30 000 genes (Stanford Functional Genomics Facility, Stanford, CA). We labeled the sample RNA and the reference RNA with different fluorescent dyes (Cy5-deoxyuridine triphosphate [dUTP] and Cy3-dUTP; Amersham Pharmacia Biotech Europe, Freiburg, Germany) and comparatively hybridized them to an array. Protocols are posted at http://brownlab.stanford.edu/protocols.html.
The fluorescence intensities of Cy5 and Cy3 were measured using a GenePix 4000 scanner (Axon Instruments, Foster City, CA). Images were analyzed using GenePix Pro 4.1 software (Axon Instruments). Any areas of the microarrays that had obvious blemishes were manually omitted from subsequent analyses. Spots were considered well measured only if the sample RNA fluorescence or the reference RNA fluorescence intensity was greater than 2 times the local background and if the regression correlation was greater than 0.6. Any clone that was not well measured on at least 70% of the arrays was excluded from subsequent analyses. For each array, we used a scaling factor to set the mean sample/reference ratio for all well-measured spots to 1. For all subsequent analyses, we used log2 of this normalized sample/reference ratio. We then mean-centered the data for each clone across all arrays within each of 2 array print runs to minimize potential print run–specific bias.6 For prediction analysis, data of the second test set were centered separately.
To analyze the data in an unsupervised manner, we used agglomerative hierarchical clustering.7 In the supervised analysis of the data, we used significance analysis of microarrays (SAM).8 Prediction analysis was performed using prediction analysis of microarrays (PAM).9 The primary data and the image files are stored in and are publicly available through the Stanford Microarray Database (http://genome-www.stanford.edu/microarray).
Quantitative RT-PCR
To validate the array results, we performed quantitative RT-PCR on selected genes using samples from 19 patients. We used random hexamer priming and MuLV reverse transcriptase (Fermentas, Hanover, MD) to generate cDNA. PCR was carried out on a LightCycler (Roche Diagnostics, Mannheim, Germany) using the QuantiTect SYBR Green PCR kit as described in the manufacturer's instructions (Qiagen). The following primers were used to measure RNA abundance (5′ to 3′): ATM forward primer, TGGATCCAGCTATTTGGTTTGA; ATM reverse primer, CCAAGTATGTAACCAACAATAGAAGAAGTAG10 ; LMO2 forward primer, TTGTTGTGACTTTGACGCTTG; LMO2 reverse primer, TTAAGGCCTTGGGAAGGG (UniSTS:155981); E2F1 forward primer, ACCAGGGTTTCCAGAGATGC; E2F1 reverse primer, CACCACACAGACTCCTTCCC (UniSTS: 84627); FGFR1 forward primer, TTTGAGAGCAACGTCACTGG; FGFR1 reverse primer, CCATTTGCCAGAAAGATCGT (UniSTS: 82 184). The expression of SDHA was used as an endogenous control (UniSTS: 34691). Reactions were carried out under the following conditions: 95°C for 15 minutes, then 45 cycles of 94°C for 15 seconds, 52°C for 25 seconds, and 72°C for 25 seconds. Melting curve analyses were performed to verify the amplification specificity. First, quantitative PCR reactions were carried out on a dilution series of a reference cDNA to obtain standard curves for the target genes and SDHA. Based on these curves, the relative concentrations were calculated based on the second derivative maximum method using LightCycler Relative Quantification Software.
Results
Fifty-one patients were included in our study, 21 with an MRD load qualifying the patient for the MRD-HR group and 30 with an MRD load qualifying the patient for the MRD-SR group. All patients had the following characteristics: B-cell precursor or common ALL; DNA index of 1.0; no BCR-ABL, no MLL-AF4, no TEL-AML1 rearrangements; and absence of conditions predisposing to leukemia. In 4 patients with MRD-HR and 2 patients with MRD-SR, blood samples were analyzed; for all other patients, bone marrow aspirate samples were used.
In 38 of the 51 patients (22 MRD-SR, 16 MRD-HR [set 1]), the RNA was homogenously prepared, and 4 of 22 MRD-SR samples were E2A-PBX1 positive. The remaining 13 samples (8 MRD-SR, 5 MRD-HR [set 2]) were prepared using a different technique and, therefore, were used as test samples in prediction analysis only. Detailed patient characteristics are shown in Supplementary Tables S1 and S2 (see the Supplemental Data Set link at the top of the online article on the Blood Web site).
Unsupervised hierarchical clustering
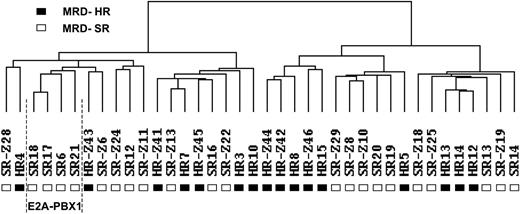
Gene expression data were analyzed by hierarchical clustering. The only clones considered were those that had a 4-fold difference in expression from the mean on at least 2 arrays. Although potentially resulting in the loss of some information, selecting clones in this manner decreased the possibility that clustering would be influenced mainly by clones with little difference in expression. As depicted in Figure 1, the samples were separated into 2 main branches. The left branch contained 12 MRD-SR and 7 MRD-HR-samples, and the right branch contained 10 MRD-SR and 9 MRD-HR samples. The 4 E2A-PBX1–positive samples clustered within the left branch. Next, we looked for differences in clinical features between the 2 main clusters. No statistically significant differences were observed for sex (left cluster: girls/boys, 9:10; right cluster: girls/boys, 9:10), age at diagnosis (left cluster: median, 5.5 years [range, 1.5-14.3 years]; right cluster: median, 6.8 years [range, 1.1-16.8 years]), or initial white blood cell (WBC) count (left cluster: median, 45 700 cells/μL [range, 2400-447 000 cells/μL]; right cluster: median, 34 000 cells/μL [range, 2100-470 000 cells/μL]).
Cluster dendrogram of 16 MRD-HR and 22 MRD-SR specimens. Hierarchical clustering analysis was carried out considering only those clones that had a 4-fold difference in expression from the mean on at least 2 arrays (1579 clones). Each column represents 1 sample. (▪) MRD-HR samples. (□) MRD-SR samples. The cluster of 4 samples with an E2A-PBX1 rearrangement is indicated.
Cluster dendrogram of 16 MRD-HR and 22 MRD-SR specimens. Hierarchical clustering analysis was carried out considering only those clones that had a 4-fold difference in expression from the mean on at least 2 arrays (1579 clones). Each column represents 1 sample. (▪) MRD-HR samples. (□) MRD-SR samples. The cluster of 4 samples with an E2A-PBX1 rearrangement is indicated.
Identifying genes that distinguish poor from good molecular treatment response
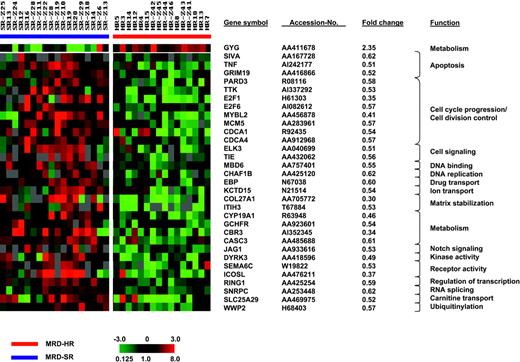
SAM was applied to identify genes that distinguish poor from good treatment response. To avoid a potential confounding effect by genes associated with an E2A-PBX1 rearrangement, we excluded the 4 t(1;19)-positive cases from this analysis and compared the expression signatures of 18 MRD-SR and 16 MRD-HR samples. Comparing both groups, no statistically significant differences were observed for sex (MRD-SR: girls/boys, 9:9; MRD-HR: girls/boys, 8:8), age at diagnosis (MRD-SR: median, 5.0 years [range, 1.5-14.3 years]; MRD-HR: median, 6.2 years [range, 1.1-16.8 years]), and initial WBC count (MRD-SR: median, 41 765 cells/μL [range, 2100-317 400 cells/μL]; MRD-HR: median, 44 700 cells/μL [range, 2400-470 000 cells/μL]). Using a significance threshold expected to produce less than 10% false positives, SAM identified 255 clones (1000 permutations: fold change, 1.5; delta, 0.50; false discovery rate [FDR], 9.63%) that distinguished poor from good treatment response. Fifty-five clones representing 54 genes were detected when applying an FDR of less than 5% (1000 permutations: fold change, 1.5; delta, 0.64; FDR, 4.6%). The results of this analysis are shown in Figure 2. The complete set of genes is listed in Supplementary Table S3.
Genes whose expression is associated with molecular treatment response. SAM identified 55 clones representing 54 genes that distinguished poor from good molecular treatment response when considering a false discovery rate of less than 5%. Each column represents 1 sample, each row 1 clone. Variation in expression is displayed as a variation in color. The color scale extends from 0.125- to 8.0-fold of the mean (-3 to 3 in log2 space), as indicated in the left lower corner. Gray represents data that were omitted because they were not well measured, as described in “Patients, materials, and methods.” Selected clones, their respective accession numbers, fold changes, and functions are shown.
Genes whose expression is associated with molecular treatment response. SAM identified 55 clones representing 54 genes that distinguished poor from good molecular treatment response when considering a false discovery rate of less than 5%. Each column represents 1 sample, each row 1 clone. Variation in expression is displayed as a variation in color. The color scale extends from 0.125- to 8.0-fold of the mean (-3 to 3 in log2 space), as indicated in the left lower corner. Gray represents data that were omitted because they were not well measured, as described in “Patients, materials, and methods.” Selected clones, their respective accession numbers, fold changes, and functions are shown.
Most differentially expressed genes showed a low expression in the MRD-HR group (238 of 255 clones and 54 of 55 clones, respectively). Analyzing the biologic function of the top 54 clones expressed at low levels in the resistant group revealed a predominance of genes involved in cell-cycle progression, cell division control (CDCA1, CDCA4, E2F1, E2F6, MCM5, MYBL2, PARD3, TTK), and apoptosis (E2F1, GRIM19, SIVA, TNF). This pattern suggests an impaired cell proliferation and an impaired apoptosis in B-cell precursor ALL samples that are resistant to chemotherapy. Other genes were heterogeneously related to different processes, such as cell signaling (ELK3, TIE), matrix stabilization (COL27A1, ITIH3), Notch-signaling (JAG1), and ubiquitinylation (WWP2).
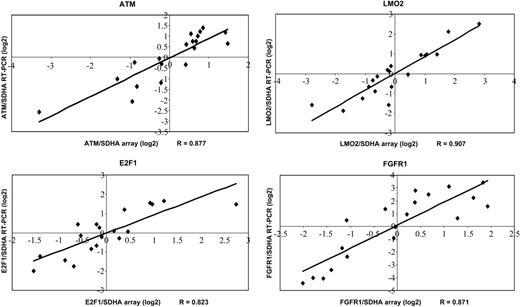
To validate our microarray data, a subset of genes (ATM, E2F1, FGFR1, LMO2) was analyzed by quantitative RT-PCR. Data generated by quantitative RT-PCR and cDNA arrays correlated well with correlation coefficients (RT-PCR to array data) between 0.823 (E2F1) and 0.907 (LMO2) (Figure 3).
Confirmation of selected genes by quantitative RT-PCR. Expression ratios revealed by quantitative RT-PCR are plotted compared with the expression ratios determined by cDNA arrays. Correlation coefficients (R) are shown.
Confirmation of selected genes by quantitative RT-PCR. Expression ratios revealed by quantitative RT-PCR are plotted compared with the expression ratios determined by cDNA arrays. Correlation coefficients (R) are shown.
Similarities in resistance-associated gene expression profiles in pediatric B-cell precursor ALL and adult T-ALL
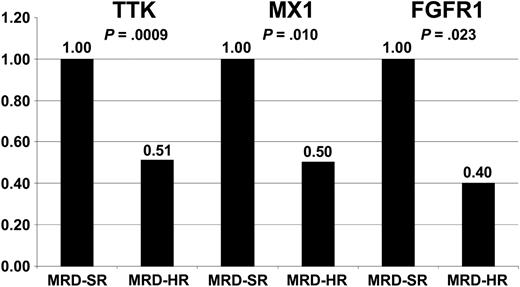
To evaluate whether common gene expression patterns are associated with treatment resistance and outcomes in ALL, we compared our data with published data analyzing gene expression profiles of patients with relapsed and successfully treated ALL and treatment-resistant compared with sensitive ALL, respectively.11-15 A remarkable concordance could be observed comparing our results with the data recently published by Chiaretti et al,15 who analyzed the expression signatures of adult T-cell ALL. Chiaretti et al15 identified a set of only 3 genes that were predictive of duration of remission and a list of 30 genes expressed at low levels in treatment-resistant T-cell ALL. One gene within their 3-gene predictor (TTK) was included in the top 54 differentially expressed genes in our study, and 2 of their resistance-associated genes (FGFR1 and MX1) were identified as differentially expressed in our study when considering an FDR less than 10%. The expression of TTK, FGFR1, and MX1 is illustrated in Figure 4.
Expression of TTK, FGFR1, and MX1 in MRD-SR and MRD-HR in pediatric B-cell precursor ALL. Low expression of TTK, FGFR1, and MX1 was shown to be associated with poor outcome (TTK) and treatment resistance (FGFR1 and MX1) in adult T-cell ALL.15 Expression levels of these genes in MRD-HR samples are shown relative to the expression in MRD-SR samples. The test statistic (t test) is indicated.
Expression of TTK, FGFR1, and MX1 in MRD-SR and MRD-HR in pediatric B-cell precursor ALL. Low expression of TTK, FGFR1, and MX1 was shown to be associated with poor outcome (TTK) and treatment resistance (FGFR1 and MX1) in adult T-cell ALL.15 Expression levels of these genes in MRD-HR samples are shown relative to the expression in MRD-SR samples. The test statistic (t test) is indicated.
Prediction of treatment resistance
We applied PAM to test whether treatment resistance can be predicted. PAM is a variant of nearest-centroid classification with an automated gene selection step integrated into the algorithm.9 This analysis was performed independently of the investigation of differentially expressed genes described here. We randomly selected 26 samples (14 MRD-SR, 12 MRD-HR) as a training set to construct a predictor. The remaining 8 samples (4 MRD-SR, 4 MRD-HR), the 4 t(1;19)-positive MRD-SR samples, and the 13 samples (8 MRD-SR, 5 MRD-HR) excluded from the analysis of differentially expressed genes (the preparation of these samples did not follow our standardized procedures) were used as a test set.
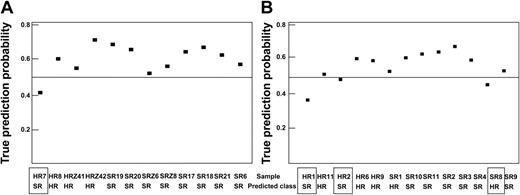
First, SAM was applied to preselect 300 differentially expressed clones comparing the MRD-SR and the MRD-HR samples of the training set. Using this set of 300 clones, PAM identified a 62-clone predictor (threshold, 1.9) that correctly predicted the molecular treatment response of all 26 training patients and of 21 of the 25 test samples. Analysis of the incorrectly predicted samples indicated that only 1 of the 12 samples for which the preanalytical procedure was identical to that of the training set (test set 1) was wrongly predicted (accuracy, 92%). In contrast, the prediction failed in 3 of the 13 samples prepared using a different RNA preparation method (test set 2; accuracy, 77%). This observation underscores the importance of a standardized preparation of samples. Results are summarized in Figure 5 and Table 1, and clones selected by PAM are shown in Supplementary Table S4.
Prediction analysis. PAM using 26 randomly selected samples as a training set and the remaining 25 samples as a test set. The probability of a true prediction and the prediction results are shown. If the prediction probability was less than 0.5, the sample prediction was wrong (□). (A) Samples were prepared as the training samples (test set 1). (B) RNA preparation of samples was different, as described in “Patients, materials, and methods” (test set 2).
Prediction analysis. PAM using 26 randomly selected samples as a training set and the remaining 25 samples as a test set. The probability of a true prediction and the prediction results are shown. If the prediction probability was less than 0.5, the sample prediction was wrong (□). (A) Samples were prepared as the training samples (test set 1). (B) RNA preparation of samples was different, as described in “Patients, materials, and methods” (test set 2).
Test sets prediction confusion matrix
Test set no. . | 1 . | . | . | 2 . | . | . | 1 and 2 . | . | . | ||||||
|---|---|---|---|---|---|---|---|---|---|---|---|---|---|---|---|
| . | Prediction . | . | . | Prediction . | . | . | Prediction . | . | . | ||||||
| True . | HR . | SR . | Accuracy . | HR . | SR . | Accuracy . | HR . | SR . | Accuracy . | ||||||
| HR | 3 | 1 | 92% | 3 | 2 | 77% | 6 | 3 | 84% | ||||||
| SR | 0 | 8 | 1 | 7 | 1 | 15 | |||||||||
Discussion
The present study compared gene expression signatures of leukemic samples that had poor molecular treatment responses with those that had good responses. We focused on this comparison for 2 main reasons. First, the assessment of resistance to treatment using specimens obtained at diagnosis could have consequences for early treatment intervention. Second, the in vivo resistance to treatment measured by MRD is a strong and highly specific predictor of treatment outcome.2 If MRD is determined with a highly sensitive technology and if no signal is detected after induction and induction consolidation therapy, the patient has an excellent prognosis. In contrast, if the patient has a high level of MRD after induction and induction consolidation therapy, the chance for relapse is high.16 However, a large number of patients are stratified into the IR group. These patients have small but measurable levels of MRD. Because the impact of MRD in predicting treatment outcome for the IR group is clearly lower than it is for the other risk groups,2 these patients were not included in our study. Given that the IR group is still expected to comprise approximately half of all the patients who ultimately will have relapses,2 searching for parameters contributing to a better stratification of such patients is of clinical importance. For this purpose, identifying markers that clearly distinguish patients at high risk from those at standard risk is likely to be an important step in this process.
Gene expression profiling in childhood ALL was performed primarily to describe cytogenetic subgroups or to look for prognosis-associated signatures considering the rates of relapse.11-13,17-22 Cheok et al23 described treatment-specific changes in gene expression after in vivo application of different drugs. We did not analyze gene expression with regard to treatment outcome in this study because treatment outcome is influenced not only by the biology of the disease—as likely to be reflected in the gene expression pattern—but also by many additional and potentially confounding factors (eg, treatment delays because of severe infections or differences with regard to patient compliance during maintenance therapy). Therefore in our opinion, the chance to detect potential prognostic markers is higher comparing patients with distinct initial in vivo patterns of resistance and sensitivity as surrogates for treatment outcome.
In contrast to other studies in childhood ALL, our study was specifically designed to identify differences in gene expression associated with treatment resistance and sensitivity, as measured by MRD. Consequently, similar numbers of treatment-resistant and treatment-sensitive patients were analyzed, and factors were excluded that were of known prognostic relevance and that were known to influence the gene expression pattern. This approach allowed us to identify gene expression signatures associated with distinct molecular treatment response, even though only a relatively small number of patients was included. For an unselected approach, many more samples would have to have been analyzed to achieve a similar result.
By analyzing the differentially expressed genes, we observed a striking pattern of genes involved in cell-cycle progression and cell division that were expressed at lower levels in the MRD-HR group. This suggests impaired cell proliferation in treatment-resistant ALL blasts. The same observation was made by Chiaretti et al15 in adult T-cell ALL when comparing the gene expression of blasts of patients who achieved complete remission after induction therapy and of those who did not. Given that in both diseases agents used for induction therapy are cell-cycle dependent, reduced cell proliferation could explain a decreased susceptibility of these blasts to treatment. Moreover, we observed a low expression level of several genes involved in apoptosis induction in the resistant group, suggesting that reduced sensitivity to apoptosis also contributed to treatment resistance.
Comparison of our data with those published by Chiaretti et al15 not only showed similar mechanisms that may explain treatment resistance, it also revealed 3 genes that were similarly expressed at low levels in treatment-resistant ALL or in blasts of patients with relapses: TTK, FGFR1, and MX1. Again, all 3 genes encode for proteins shown to function in cell proliferation (TTK, FGFR1) and apoptosis (MX1).24-27 Given the marked differences in the biology and the response to treatment between pediatric and adult ALL and the different immunophenotypes (adult T-cell ALL and pediatric B-cell precursor ALL, respectively), the concordance between both studies is remarkable. One might speculate that there are common features of treatment resistance in lymphoid malignancies, as described for the ability of different solid tumors to metastasize.28 However, additional studies investigating gene expression patterns associated with treatment resistance are needed to test this hypothesis.
To investigate the potential of gene expression profiling to predict resistance to chemotherapy, we used 26 randomly selected samples as a training set to construct a gene expression classifier of treatment response and tested this predictor in 25 independent samples. This analysis revealed an accuracy of 92% when testing samples that were prepared exactly as the training samples. This result is promising with respect to an application of gene expression profiling in treatment stratification. The prediction was less accurate when samples were tested from which the RNA was prepared differently. Considering the instability of RNA and its susceptibility to technical variation, this observation is not surprising and underscores the necessity to define strict standards before implementing this technique in a clinical setting.
To define the molecular signatures of sensitivity or resistance in childhood ALL, our results should be validated in a prospective study with a larger series of patients. Gene expression profiling may then become a useful, clinically relevant tool for treatment stratification in the early course of childhood ALL and may contribute to an improvement in treatment outcomes by defining the optimal therapy for each patient.
Prepublished online as Blood First Edition Paper, September 23, 2004; DOI 10.1182/blood-2004-04-1552.
Supported by the “Verein zur Förderung der Behandlung krebskranker Kinder Hannover e.V.” and the “Deutsche Krebshilfe.”
G.C. and M. Stanulla contributed equally to this work.
The online version of this article contains a data supplement.
The publication costs of this article were defrayed in part by page charge payment. Therefore, and solely to indicate this fact, this article is hereby marked “advertisement” in accordance with 18 U.S.C. section 1734.
We thank Michael Fero and the staff of the Stanford Functional Genomics Facility for producing the microarrays, and we thank the Stanford Microarray Database for providing a repository for the primary data.

This feature is available to Subscribers Only
Sign In or Create an Account Close Modal