Abstract
The FLT3 receptor is activated by juxtamembrane insertion mutations and by activation loop point mutations in patients with acute myeloid leukemia (AML). In a systematic tyrosine kinase gene exon resequencing study, 21 of 24 FLT3 exons were sequenced in samples from 53 patients with AML, 9 patients with acute lymphoblastic leukemia (ALL), and 3 patients with myelodysplasia samples. Three patients had novel point mutations at residue N841 that resulted in a change to isoleucine in 2 samples and to tyrosine in 1 sample. Introduction of FLT3-N841I cDNA into Ba/F3 cells led to interleukin-3 (IL-3)–independent proliferation, receptor phosphorylation, and constitutive activation of signal transducer and activator of transcription 5 (STAT5) and extracellular regulatory kinase (ERK), suggesting that the N841I mutation confers constitutive activity to the receptor. An FLT3 inhibitor (PKC412) inhibited the growth of Ba/F3-FLT3N841I cells (IC50 10 nM), but not of wild-type Ba/F3 cells cultured with IL-3. PKC412 also reduced tyrosine phosphorylation of the mutant receptor and inhibited STAT5 phosphorylation. Examination of the FLT3 autoinhibited structure showed that N841 is the key residue in a hydrogen-bonding network that likely stabilizes the activation loop. These results suggest that mutations at N841 represent a significant new activating mutation in patients with AML and that patients with such mutations may respond to small-molecule FLT3 inhibitors such as PKC412.
Introduction
FLT3, a class 3 receptor tyrosine kinase, is targeted and activated by somatic mutation in acute myeloid leukemia (AML). Internal tandem duplication (ITD) mutations of the FLT3 juxtamembrane (JM) occur in approximately 24% of patients with AML and in 15% of patients with secondary AML1,2 and are associated with shortened disease-free survival.3 Mutations in the activation loop (AL), typically D835Y, occur in approximately 7% of patients with AML and 3% of patients with myelodysplastic syndromes (MDS)4,5 and in patients with T-cell ALL (T-ALL).6 An increased frequency of FLT3 mutations has also been associated with mutations involving the mixed-lineage leukemia (MLL) gene.7
ITD and AL mutations result in constitutive FLT3 kinase activity. When FLT3 receptors harboring such mutations are introduced into mammalian cells, downstream signaling pathways are activated that lead to factor-independent growth in vitro and to leukemogenesis in vivo.8,9 For example, the production of FLT3-ITD mutant proteins in primary murine bone marrow cells results in a lethal myeloproliferative phenotype.10 Thus, FLT3 is a leukemia oncogene, and activating FLT3 mutations likely contribute significantly to the development of leukemia in humans.
Several small-molecule inhibitors block the kinase activity of FLT3 with high potency10-13 (eg, PKC412, MLN518, SU11248) and can prolong the lifespans of mice harboring leukemias expressing mutant FLT3 receptors.10,14 In phase-1 and -2 clinical trials, FLT3 inhibitors have reduced FLT3 phosphorylation15-17 and leukemia blast counts and have induced clinical responses in patients with advanced therapy-refractive AML.17,18
In this report, we identified novel point mutations in 3 patients with AML that result in a substitution of isoleucine for asparagine 841 in 2 patients and of tyrosine for asparagine 841 in another patient. The recently characterized structure of the autoinhibited FLT3 receptor reveals that this residue makes critical stabilizing contacts between the activation loop and the C-lobe of the kinase domain. An FLT3 receptor harboring the N841I mutation (FLT3-N841I), when expressed in Ba/F3 cells, was constitutively autophosphorylated, led to the phosphorylation of STAT5 and ERK kinase, and induced IL-3–independent proliferation. Importantly, the autophosphorylation, signaling, and growth-promoting activities of FLT3-N841I were blocked by an FLT3 inhibitor, PKC412.
Study design
Patient samples
Samples from 53 AML, 9 ALL, and 3 MDS patients were studied. One ALL and 8 AML patients previously had MDS, and 2 AML and 2 ALL patients previously underwent chemotherapy for other malignancies. Median age of the patients, 38 men and 27 women, was 52.3 (range, 19-89 years). Forty-two samples were obtained at first diagnosis and 9 at first relapse; 14 patients had refractory disease. Initial screening revealed that 10 patients had the D835 mutation and 2 had both a D835 and an ITD mutation. No other ITD mutations were observed in this group because we had enriched it for ITD-negative AML samples.
Plasmids, cell culture, immunoblots, and immunoprecipitation
pClneo/FLT3-N841I was generated by site-directed mutagenesis using the primers 5′-GATATCATGAGTGATTCCATCTATGTTGTCAGGGGCA-3′ and 5′-TGCCCCTGACAACATAGATGGAATCACTCATGATATC-3′. Three polyclonal Ba/F3 cell lines expressing FLT3-N841I were derived and used for further studies. PKC412 was obtained from Novartis Pharma AG (Basel, Switzerland). Antibodies anti-pTyr, anti-FLT3, anti-pERK, anti-pSTAT5(Tyr694), anti-STAT5 and anti-MAPK were used for immunoblotting or immunoprecipitation, as described.14
FLT3 gene sequencing
Nested primer sets were designed for each FLT3 exon,19 and polymerase chain reaction (PCR) and sequencing of 21 of the 24 exons were performed as described (J.G.P., M.M., W.R.S., manuscript in preparation), with more than 80% coverage obtained across this exon sample set. Then 1365 forward and reverse chromatograms were manually reviewed and analyzed using Mutation Surveyor 2.03 (SoftGenetics). High-quality sequence variations found in one or both directions were scored as candidate mutations and were subjected to validation sequencing from the original DNA sample.
Genotyping by primer mass extension and MALDI-TOF
Forward (5′-ACGTTGGATGGTAGGAAATAGCAGCCTCAC-3′) and reverse (5′-ACGTTGGATGTGTGACTTTGGATTGGCTCG-3′) PCR primers and primer extension probes (N841I, 5′-TGCCCCTGACAACATAGT-3′; N841Y, 5′-GCCCCTGACAACATAGTT-3′) were designed using SpectroDESIGNER 2.0 (Sequenom) and MassExtend genotyping assays, performed as described.20
Analysis of the FLT3 structure
Results and discussion
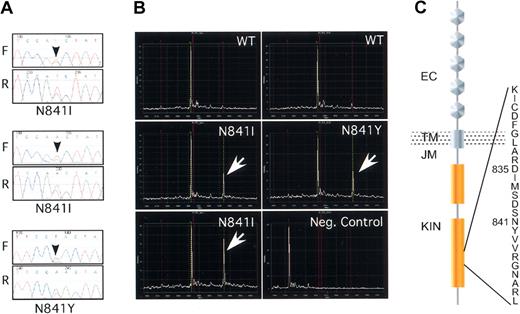
In 65 leukemia/myelodysplasia samples, partially enriched for those that lacked ITD mutations, sequencing of 21 of the 24 FLT3 exons led to the discovery of 3 novel variations: 2522A>T was detected in 2 samples, and 2521A>T was found in a third patient (Figure 1A, C). As an initial validation, each variation was identified again in the original DNA samples by repeat direct sequencing. Although paired normal germline DNA was unavailable, these alterations have not been seen in more than 200 nonleukemia DNA samples (data not shown), arguing that these are indeed somatic mutations.
Novel missense mutations in the activation loop of FLT3. (A) Sequencing chromatograms of the N841I and N841Y missense mutations. The black arrows indicate the position of the heterozygote variant base. The forward (F) and the reverse (R) reads are shown. (B) Mass spectrometry–based genotyping detects the N841I and N841Y variants. Primer extension assays were developed for each variant nucleotide and extension reaction was carried out after PCR amplification of the target sequence. Wild-type and variant extension products, differing in mass as a result of differences in the extended length, were detected by matrix-assisted laser desorption time-of-flight mass spectrometry (MALDI-TOF). The white arrows indicate the variant peaks. The negative control represents the spectra of the extension probe in the absence of input DNA. (C) Schematic diagram of the FLT3 tyrosine kinase and the position of the novel missense mutations within the kinase activation loop. EC indicates extracellular domain; TM, transmembrane; JM, juxtamembrane; and KIN, kinase domain. The position of D835 is also shown for comparison.
Novel missense mutations in the activation loop of FLT3. (A) Sequencing chromatograms of the N841I and N841Y missense mutations. The black arrows indicate the position of the heterozygote variant base. The forward (F) and the reverse (R) reads are shown. (B) Mass spectrometry–based genotyping detects the N841I and N841Y variants. Primer extension assays were developed for each variant nucleotide and extension reaction was carried out after PCR amplification of the target sequence. Wild-type and variant extension products, differing in mass as a result of differences in the extended length, were detected by matrix-assisted laser desorption time-of-flight mass spectrometry (MALDI-TOF). The white arrows indicate the variant peaks. The negative control represents the spectra of the extension probe in the absence of input DNA. (C) Schematic diagram of the FLT3 tyrosine kinase and the position of the novel missense mutations within the kinase activation loop. EC indicates extracellular domain; TM, transmembrane; JM, juxtamembrane; and KIN, kinase domain. The position of D835 is also shown for comparison.
Mutation detection by sequencing is complicated by the admixture of alleles from tumor and nontumor genomes in the same chromatogram trace. To further validate these mutations and to test the application of mass spectrometry–based genotyping to somatic mutation, detection assays that could specifically distinguish the wild-type and the 2 mutant DNA bases were designed. In each case the mutant allele and the wild-type alleles were readily distinguished (Figure 1B). Thus, this technique represents a sensitive, inexpensive, and high-throughput method for targeted detection of characterized somatic variants.
Patients with leukemia cells bearing these mutations all had French-American-British (FAB) subtype M1 or M2 AML, and all experienced relapse after induction chemotherapy or bone marrow transplantation. The cytogenetic abnormalities in this group were complex. One patient had inv(6)(p21p23), one had trisomy 8 and hyperploidy, and one had a complex karyotype that included a der(6)t(1;6)(p32;q23) translocation. No patient had evidence of ITD mutation, though one had a D835 alteration revealed by allele-specific restriction digestion and sequencing. Additional analysis suggested that the D835 mutation was likely nonallelic to N841I and was present in a distinctly minor population of cells (data not shown).
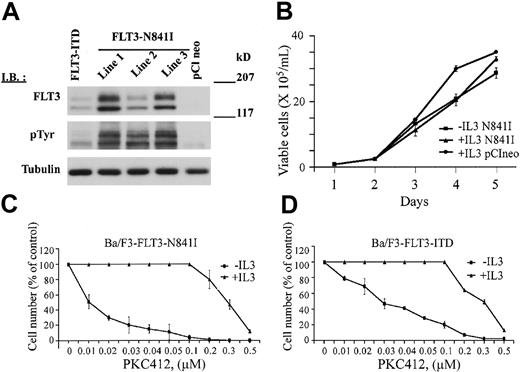
Nucleotide alterations were predicted to change the activation loop residue asparagine 841 to isoleucine or tyrosine. To determine the functional significance of mutations targeting this residue, cDNA directing the expression of FLT3-N841 was introduced into Ba/F3 cells by electroporation. Expression of the FLT3-N841I mutant receptor led to IL-3–independent growth in 3 independent polyclonal Ba/F3 cell lines (Figure 2A-B). In each line, the FLT3-N841I receptor was phosphorylated in the absence of IL-3, suggesting that the mutant receptor is constitutively autophosphorylated. Treatment with the FLT3 inhibitor PKC412 led to a dose-dependent reduction in receptor phosphorylation and inhibited the growth of Ba/F3-FLT3-N841I cells with an IC50 of 10 nM compared with 30 nM for the Ba/F3-FLT3-ITD cells (Figures 2C-D, 3A). Growth inhibition by PKC412 was reversed by the addition of IL-3 (Figure 2C-D), suggesting that the antiproliferative effect of PKC412 in this line resulted from inhibition of the mutant receptor. As an additional control, treatment with up to 1 μM imatinib mesylate had no effect on Ba/F3-N841I cells in the absence of IL-3 (data not shown) and had no effect on receptor phosphorylation. Taken together, these results suggest that the N841I mutation, like other FLT3 mutations,11,16,22,23 results in constitutive kinase activation and factor-independent proliferation of Ba/F3 cells.
Receptor phosphorylation, IL-3–independent growth, and response to PKC412 of Ba/F3-FLT3-N841I cells. (A) Expression and phosphorylation of the FLT3-N841I receptor. Whole-cell extracts were immunoblotted with either anti-pTyr antibody to detect receptor phosphorylation or anti-FLT3 to detect the level of receptor expression (as indicated). Lines 1 to 3 represent 3 independent polyclonal cell populations stably expressing FLT3-N841I and maintained in media without IL-3. FLT3-ITD represents the Ba/F3 cells expressing FLT3-ITD (as a positive control). pClneo represents the Ba/F3 cells expressing empty vector (as a negative control). (B) FLT3-N841I induces the IL-3–independent growth of Ba/F3 cells. Ba/F3 cells stably expressing FLT3-N841I were seeded at a density of 0.5 × 10⁵/mL and were grown in the presence or absence of IL-3 (as indicated). As a control, Ba/F3 cells containing only the empty vector (pClneo) and growing in the presence of IL-3 were also seeded at the same density. Cells were collected at the indicated times and counted after staining with trypan blue. (C-D) Dose-dependent growth inhibition of Ba/F3-FLT3-N841I and Ba/F3-FLT3-ITD cells by PKC412. Ba/F3-FLT3-N841I cells (C) and, as a control, Ba/F3-FLT3-ITD cells (D) were seeded at 0.5 × 10⁵/mL and were immediately treated with PKC412 at the indicated concentrations. Cells were collected at 72 hours and counted as in panel B. All data points are the average of experimental duplicates and are representative of the results obtained in 2 independent experiments.
Receptor phosphorylation, IL-3–independent growth, and response to PKC412 of Ba/F3-FLT3-N841I cells. (A) Expression and phosphorylation of the FLT3-N841I receptor. Whole-cell extracts were immunoblotted with either anti-pTyr antibody to detect receptor phosphorylation or anti-FLT3 to detect the level of receptor expression (as indicated). Lines 1 to 3 represent 3 independent polyclonal cell populations stably expressing FLT3-N841I and maintained in media without IL-3. FLT3-ITD represents the Ba/F3 cells expressing FLT3-ITD (as a positive control). pClneo represents the Ba/F3 cells expressing empty vector (as a negative control). (B) FLT3-N841I induces the IL-3–independent growth of Ba/F3 cells. Ba/F3 cells stably expressing FLT3-N841I were seeded at a density of 0.5 × 10⁵/mL and were grown in the presence or absence of IL-3 (as indicated). As a control, Ba/F3 cells containing only the empty vector (pClneo) and growing in the presence of IL-3 were also seeded at the same density. Cells were collected at the indicated times and counted after staining with trypan blue. (C-D) Dose-dependent growth inhibition of Ba/F3-FLT3-N841I and Ba/F3-FLT3-ITD cells by PKC412. Ba/F3-FLT3-N841I cells (C) and, as a control, Ba/F3-FLT3-ITD cells (D) were seeded at 0.5 × 10⁵/mL and were immediately treated with PKC412 at the indicated concentrations. Cells were collected at 72 hours and counted as in panel B. All data points are the average of experimental duplicates and are representative of the results obtained in 2 independent experiments.
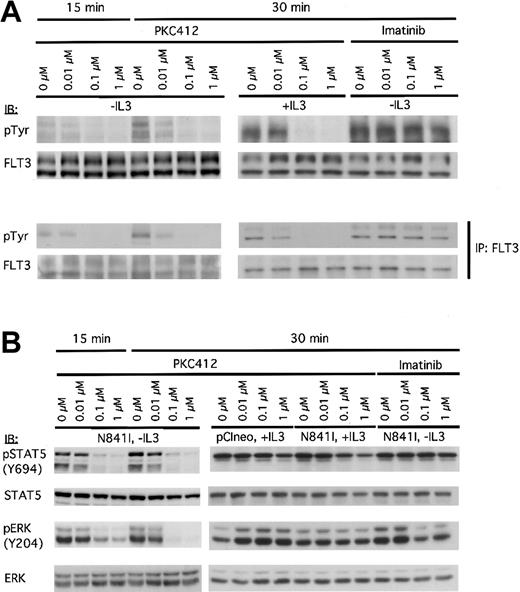
PKC412 inhibits receptor phosphorylation and the constitutive activation of downstream signaling cascades in Ba/F3-FLT3-N841I cells. FLT3-N841I–expressing Ba/F3 cells cultured in either the absence or presence of IL-3 were treated with PKC412 or STI571 (in the absence of IL-3) at the concentrations indicated and lysed in NP-40 buffer after 15- and 30-minute treatments. (A) Whole-cell lysates were subjected to direct immunoblot analysis (top panel) or were used as the starting material for anti-FLT3 immunoprecipitation (bottom panel). Whole-cell extracts or immunoprecipitates were immunoblotted with either anti-pTyr antibody or anti-FLT3 (as indicated). (B) The same cell lysates were subjected to immunoblot analysis with antibodies specific to the phosphorylated forms of STAT5 and ERK, as indicated. Membranes were then reprobed with the corresponding nonphosphospecific antibodies, as indicated.
PKC412 inhibits receptor phosphorylation and the constitutive activation of downstream signaling cascades in Ba/F3-FLT3-N841I cells. FLT3-N841I–expressing Ba/F3 cells cultured in either the absence or presence of IL-3 were treated with PKC412 or STI571 (in the absence of IL-3) at the concentrations indicated and lysed in NP-40 buffer after 15- and 30-minute treatments. (A) Whole-cell lysates were subjected to direct immunoblot analysis (top panel) or were used as the starting material for anti-FLT3 immunoprecipitation (bottom panel). Whole-cell extracts or immunoprecipitates were immunoblotted with either anti-pTyr antibody or anti-FLT3 (as indicated). (B) The same cell lysates were subjected to immunoblot analysis with antibodies specific to the phosphorylated forms of STAT5 and ERK, as indicated. Membranes were then reprobed with the corresponding nonphosphospecific antibodies, as indicated.
Immunoblot analysis of the FLT3-N841I cells revealed constitutive phosphorylation of STAT5 in the absence of IL-3 and ERK phosphorylation on tyrosine 204. These phosphorylation events were reduced by treatment with PKC412 at concentrations as low as 0.01 μM (Figure 3B), and this inhibition was reversed by treatment with IL-3. Again, imatinib mesylate had no effect on the phosphorylation of STAT5 and only subtle effects on the ERK phosphorylation at high concentrations (Figure 3B). Together, these data strongly suggest that the N841I receptor was able to induce and maintain the constitutive activation of STAT5 and ERK signaling.
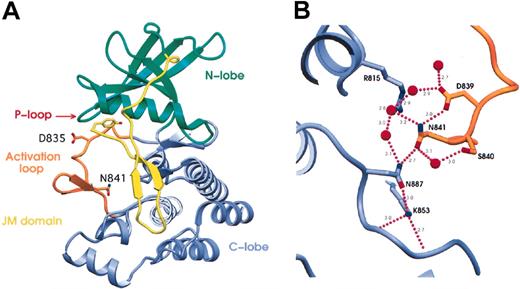
The structure of the FLT3 kinase in its autoinhibited state was recently elucidated24 and allowed us to ask whether this might reveal a mechanism by which mutation of N841 could lead to the apparent kinase activation described. The frequently altered residue D835 forms a hydrogen bond to the carbonyl-oxygen of S838, perhaps helping to stabilize the inactive conformation. It is, however, a poorly ordered residue in the crystal structure.24 Interestingly, in this structure, it appears that N841 is the key residue in an extensive hydrogen bonding network incorporating R815, D839, S840, N841, K853, N887, and 5 water molecules (Figure 4A-B). The central feature of this network is a hydrogen bonding “ladder,” from D839 to N841 to N887 to K853, that seems to stabilize the activation loop close to the terminus of the F-helix by means of a hydrogen bond between N841 and N887. N841 also interacts with 2 water molecules. The first water hydrogen bonds to S840, and the second bonds to R815; both interactions likely stabilize the inactive conformation of the activation loop. Mutation of the key residue in this network, N841, to either tyrosine or isoleucine would be predicted to disrupt this hydrogen bonding network, making the inactive conformation less energetically favorable. Based on these analyses, we believe the N841Y mutation, though not yet studied biochemically, is also likely active.
Spatial analysis of mutations in the crystal structure of FLT3. (A) Ribbon representation of the crystal structure of FLT3 (pdb code: 1RJB).24 Residues highlighted by this study are indicated and are shown in “stick” representation. Y572 is at the N-terminal residue of the JM domain visible in the crystal structure. D835 and N841 are both in the activation loop. Significant structural elements are color-coded, with the N-terminal kinase domain in green, the C-terminal kinase domain in blue, the activation loop in orange, and the juxtamembrane (JM) domain in yellow. P-loop is indicated. (B) The hydrogen-bonding network surrounding N841. N841 is the key residue in an extensive hydrogen-bonding network incorporating R815 in the catalytic loop; D839, S840, and N841 in the activation loop; K853 in the end of the activation loop; N887 at the end of the F-helix; and 5 water molecules. The activation loop is shown in orange and the C-terminal kinase domain in blue. Residues are shown in stick representation with nitrogen atoms in blue, oxygen atoms in red, and carbon atoms the same color as the domain. Water molecules are represented as red spheres, and hydrogen bonds are shown as purple dotted lines with distances shown in angstroms (nanometers). Figures were made using SETOR.25
Spatial analysis of mutations in the crystal structure of FLT3. (A) Ribbon representation of the crystal structure of FLT3 (pdb code: 1RJB).24 Residues highlighted by this study are indicated and are shown in “stick” representation. Y572 is at the N-terminal residue of the JM domain visible in the crystal structure. D835 and N841 are both in the activation loop. Significant structural elements are color-coded, with the N-terminal kinase domain in green, the C-terminal kinase domain in blue, the activation loop in orange, and the juxtamembrane (JM) domain in yellow. P-loop is indicated. (B) The hydrogen-bonding network surrounding N841. N841 is the key residue in an extensive hydrogen-bonding network incorporating R815 in the catalytic loop; D839, S840, and N841 in the activation loop; K853 in the end of the activation loop; N887 at the end of the F-helix; and 5 water molecules. The activation loop is shown in orange and the C-terminal kinase domain in blue. Residues are shown in stick representation with nitrogen atoms in blue, oxygen atoms in red, and carbon atoms the same color as the domain. Water molecules are represented as red spheres, and hydrogen bonds are shown as purple dotted lines with distances shown in angstroms (nanometers). Figures were made using SETOR.25
In summary, we have demonstrated that a novel mutation in the residue N841 results in the production of an activated FLT3 receptor that is highly sensitive to one of the new FLT3 inhibitors, PKC412. These data underscore the importance of careful cataloging of each mutant and its sensitivity to various FLT3 inhibitors for the design and interpretation of clinical trials of these agents.
Prepublished online as Blood First Edition Paper, June 3, 2004; DOI 10.1182/blood-2004-02-0712.
Supported by the Poduska Family Foundation, by the Claudia-Adams Barr Foundation (M.M. and W.R.S), by National Institutes of Health grant DK50654 and C66996, and by the Leukemia and Lymphoma Society (D.G.G.). D.G.G. is an Associate Investigator of the Howard Hughes Medical Institute.
J.J. and J.G.P. contributed equally to this study.
The publication costs of this article were defrayed in part by page charge payment. Therefore, and solely to indicate this fact, this article is hereby marked “advertisement” in accordance with 18 U.S.C. section 1734.
We thank Dr Liuda Ziagura and Dr Stacey Gabriel for performing the Sequenom MassExtend Genotyping assays and Dr B. Scheijen for providing wild-type human FLT3 cDNA and for useful discussion.


This feature is available to Subscribers Only
Sign In or Create an Account Close Modal