CD8 T cells play a key role in host defense against intracellular pathogens. Efficient migration of these cells into sites of infection is therefore intimately linked to their effector function. The molecular mechanisms that control CD8 T-cell trafficking into sites of infection and inflammation are not well understood, but the chemokine/chemokine receptor system is thought to orchestrate this process. Here we systematically examined the chemokine receptor profile expressed on human CD8 T cells. Surprisingly, we found that CXC chemokine receptor 1 (CXCR1), the predominant neutrophil chemokine receptor, defined a novel interleukin-8/CXC ligand 8 (IL-8/CXCL8)–responsive CD8 T-cell subset that was enriched in perforin, granzyme B, and interferon-γ (IFNγ), and had high cytotoxic potential. CXCR1 expression was down-regulated by antigen stimulation both in vitro and in vivo, suggesting antigen-dependent shaping of the migratory characteristics of CD8 T cells. On virus-specific CD8 T cells from persons with a history of Epstein-Barr virus (EBV) and influenza infection, CXCR1 expression was restricted to terminally differentiated effector memory cells. In HIV-1 infection, CXCR1-expressing HIV-1–specific CD8 T cells were present only in persons who were able to control HIV-1 replication during structured treatment interruptions. Thus, CXCR1 identifies a subset of CD8 T cells poised for immediate cytotoxicity and early recruitment into sites of innate immune system activation.
Introduction
A central feature of the adaptive immune response is the generation of antigen-specific effector and memory T cells. Naive T cells are induced to proliferate (clonal expansion) and differentiate upon encounter with cognate antigen presented by dendritic cells in secondary lymphoid structures.1,2 Activation and subsequent differentiation lead to the formation of several CD8 T-cell memory subsets with different functional and migratory properties, classified as central memory, effector memory, and terminally differentiated effector memory cell subsets.3,4 Terminally differentiated effector memory CD8 T cells express high levels of perforin, granzyme A and B, and Fas ligand; are highly cytotoxic; and home to sites of infection and inflammation. Effector memory CD8 T cells are thought to allow for a recall response in the tissue, as these cells survey nonlymphoid organs in search of cognate antigen and, while able to produce interferon-γ (IFNγ) upon antigen recognition, are only moderately cytotoxic. In contrast, central memory cells recirculate between the blood and the lymphoid compartment and are thought to provide a pool of antigen-experienced cells with a high proliferative capacity but a lower activation threshold than naive cells, thus allowing for a more rapid generation of effector cells during a recall response.3,5,6
Distinct migratory properties are a determining factor in T-cell subset function. Homing characteristics are thought to be controlled by the expression pattern of adhesion molecules and chemokine receptors acquired by specialized T-cell subsets during the process of differentiation and polarization. For example, central memory T cells retain expression of the lymph-node homing receptors CC chemokine receptor 7 (CCR7) and L-selectin. In contrast, effector memory and terminally differentiated effector memory cells lose expression of CCR7 and L-selectin, and acquire receptors allowing homing to peripheral tissue and to sites of infection/inflammation, respectively.3 Although not systematically examined in any detail, inflammatory chemokine receptors, such as CXC chemokine receptor 3 (CXCR3), CCR5, and CX3C chemokine receptor 1 (CX3CR1), have been described on CD8 T-cell subsets with effector function and are thought to enable these subsets to migrate into the periphery.7-10
In this study, we systematically analyzed the chemokine receptor profile of human CD8 T-cell subsets as defined by expression of the lymph-node homing chemokine receptor CCR7 and the cell-surface tyrosine phosphatase CD45RA. Naive cells were defined as CCR7+CD45RAhigh, central memory cells (CMs) as CCR7+CD45RA–, effector memory cells (EMs) as CCR7–CD45RA–, and terminally differentiated effector memory cells as CCR7–CD45RAhigh (CD45RA re-expressing EMs [EMRAs]).3,4,11 Subset-specific analysis allowed for the unambiguous identification of a population of CD8 T cells expressing functional CXCR1. CXCR1 was differentially expressed on Epstein-Barr virus (EBV)– and influenza-specific CD8 T cells that had higher levels of perforin and IFNγ and greater cytotoxic activity. On HIV-1–specific CD8 T cells, expression of CXCR1 was unique to treated persons able to control HIV-1 replication during periods of structured treatment interruptions. CXCR1 expression was uniquely down-modulated upon antigen-specific stimulation in vitro, and during periods of uncontrolled viral replication in vivo. CXCR1 is the predominant chemokine receptor expressed on human neutrophils, and its ligand, interleukin-8 (IL-8), is one of the earliest and most abundant chemokines produced during acute inflammatory responses.12,13 Responsiveness to IL-8 is essential during the earliest phase of the host immune response to infection.14,15 Thus, CXCR1 defines a novel subset of highly cytotoxic CD8 T cells that, following innate immune system activation, may provide the first wave of antigen-specific protection during a recall response.
Patients, materials, and methods
Flow cytometry
Antibodies recognizing CCR1 (53504.111), CXCR1 (42705.111), CCR2 (48607.121), CXCR2 (48311.211), CCR3 (61828.111), CXCR5 (51505.111), CCR6 (53103.111), CXCR6 (56811), CCR7 (150503), CCR9 (112509), CD27 (57703), and CD28 (37407) were purchased from R&D Systems (Minneapolis, MN). CXCR3 (1C6), CCR4 (1G1), CXCR4 (12G5), CCR5 (3A9), CCR6 (11A9), CCR7 (2H4), CD3 (UCHT1), CD4 (SK3), CD8 (RPA-T8), and CD19 (SJ25C1) were purchased from BD PharMingen (San Diego, CA). Antibody recognizing CX3CR1 (2A9-1) was purchased from MBL (Nakaku Nagoya, Japan). Fluorogenic caspase substrate was purchased from OncoImmunin (Gaithersburg, MD). The following human leukocyte antigen (HLA) tetramers were used: for influenza, HLA-A2 GILGFVFTL (Immunomics, San Diego, CA); for EBV, HLA-B8–restricted FLRGRAYGL (EBNA3A) and QAKWRLQTL (EBNA3A), HLA-A2–restricted GLCTLVAML (BMLF1), and HLA-B8–restricted RAKFKQLL; for HIV-1, HLA-B8–restricted FLKEKGGL (nef), HLA-B8–restricted EIYKRWII (p24), HLA-B7–restricted IPRRIRQGL (gp41), and HLA-A2–restricted SLYNTVATL (p17) (all synthesized and refolded as described previously).16 Control experiments were performed to exclude binding of tetramer to natural killer (NK) cells. No such binding was observed (data not shown). For fluorescence-activated cell scanner (FACS) analysis, peripheral blood mononuclear cells (PBMCs) were prepared by centrifugation through a density gradient on Histopaque-1077 (Sigma-Aldrich, St Louis, MO). When appropriate, CD8+ cells were selected by means of anti-CD8 magnetic beads (MACS system; Miltenyi Biotec, Auburn, CA). Purity of CD8+ cells, as confirmed by flow cytometry, was at least 97% (data not shown). Cells were blocked with 10% human serum before staining with antibodies to individual chemokine receptors. Staining and analysis were performed in phosphate-buffered saline (PBS) with 1% fetal calf serum (FCS). For intracellular perforin analyses, after surface-marker labeling, cells were fixed and permeabilized with PermeaFix (Ortho Diagnostic Systems, Raritan, NJ) before intracellular staining with antiperforin monoclonal antibody (27-35; BD PharMingen). Isotype-matched controls were used for both surface and intracellular staining. Data were acquired on a FACS Calibur or FACSvantage SE system (system expanded for 5-color analysis) and analyzed by means of CellQuest software (Becton Dickinson). To accumulate several hundred antigen-specific CD8 T cells within the various subsets, up to several million events were acquired.
Cell sorting
Samples were NK-cell depleted with anti-CD56 magnetic beads by means of the MACS system (Miltenyi Biotec). Depletion of at least 99% of CD56+ lymphocytes was found not to change the percentage of CXCR1+ CD8 T cells (data not shown). Alternatively, 5-color flow cytometry including anti-CD3 monoclonal antibodies was performed. Cells were sorted on Cytomation MoFlo (Dako Cytomation, Fort Collins, CO) or FACSvantage SE high-speed cell sorters. The following populations of CD8 T cells were sorted: for quantitative polymerase chain reaction (PCR) analysis, CCR7+ CD45RAhigh, CCR7+ CD45RA–, CCR7–CD45RA–, and CCR7–CD45RAhigh; for cytotoxicity assays; CXCR1+, CX3CR1+, CCR7–CD45RAhigh, and bulk; for intracellular cytokine staining, CCR7–CD45RA–, CCR7–CD45RAhigh, CXCR1+. For each cell population, 20 000 to 500 000 cells were sorted. Purity was evaluated by postsort flow cytometry. Less than 1% contamination was observed in all T-cell subsets (data not shown).
Quantitative PCR (QPCR)
CD3/CD8 double-positive naive (N), CM, EM, and EMRA subsets were sorted as described. Purity of subsets was assessed by postsort flow analysis and typically was 99%. Total RNA was extracted by means of the RNeasy kit (Qiagen, Valencia, CA), and after DNase I (Invitrogen, Carlsbad, CA) treatment, total RNA from each sample was used as template for the reverse-transcription reaction. QPCR was performed as described, by means of the Mx4000 Multiplex Quantitative PCR System (Stratagene, La Jolla, CA).13 Briefly, all samples were reverse transcribed under the same conditions (25°C for 10 minutes, 48°C for 30 minutes) and from the same reverse-transcription master mix to minimize differences in reverse-transcription efficiency. The QPCR reaction contained 2 μL cDNA, 12.5 μL 2 × SYBR Green master mix (Stratagene), and 500 nmol sense and antisense primer. Emitted fluorescence for each reaction was measured during the annealing/extension phase, and amplification plots were analyzed with the MX4000 software version 3.0 (Stratagene). Quantity values (ie, copies) for gene expression were generated by comparing the fluorescence generated by each sample with standard curves of known quantities, and the calculated number of copies was divided by the number of copies of the constitutively active gene GAPDH or β2-microglobulin. In control experiments, no significant difference in QPCR results were observed when comparing data normalized with the use of the housekeeping gene β2-microglobulin versus GAPDH.
Chemotaxis
CD8 T cells were negatively selected by means of anti-CD4, anti-CD19, anti-CD14, and anti-CD56 magnetic beads with the use of the MACS system. Purity as confirmed by flow cytometry was at least 95% (data not shown). CD8 T cells were suspended in RPMI with 1% bovine serum albumin and loaded in duplicate into modified Boyden chamber inserts (pore size, 5 μm) for 24-well cell-culture dishes. IL-8 and macrophage-derived chemokine (MDC) were added to RPMI with 1.5% bovine serum albumin in the lower wells at various concentrations. After incubation for 2 hour at 37°C, cells that migrated into the lower chamber were washed and stained for CD3, CD8, CD45RA, and CCR7, and analyzed by flow cytometry. By gating on CD3/CD8 double-positive lymphocyte subsets migrating in response to a given chemotactic gradient, potentially contaminating NK cells were excluded from the analysis. The CD8 T-cell phenotype with respect to expression of CCR7 and CD45RA ex vivo was compared with the respective phenotype after 2 hours at 37°C (in presence and absence of IL-8 and MDC), and no significant changes were observed (data not shown). In control experiments, a known amount of polystyrene counting beads (diameter, 15.8 μm) (Polysciences, Warrington, PA) was added to the cells that migrated into the lower well, allowing their quantitation by flow cytometry.17 Background migration of naive (CCR7+CD45RAhigh) CD8 T cells (not expressing CCR4 or CXCR1) (Figure 1A-B) was not affected by either IL-8 or MDC (data not shown). Migration of CM CD8 T cells, EM CD8 T cells, and EMRA CD8 T cells is presented as fold increase/decrease using naive CD8 T cells as internal standard.
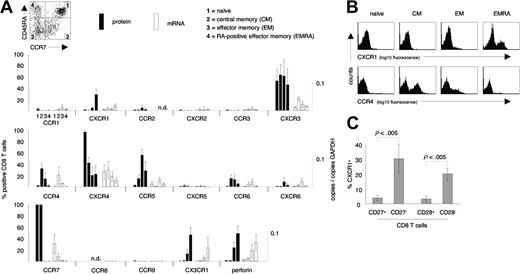
Chemokine receptor expression on CD8 T-cell subsets. (A) Protein and mRNA levels of chemokine receptors were assessed on naive, central memory (CM), effector memory (EM), and CD45RA re-expressing effector memory (EMRA) CD8 T cells. CXCR1 and CX3CR1 were selectively expressed on EMRA CD8 T cells, while CCR4 was selectively expressed on CM and EM CD8 T-cell subsets. Note the generally tight association of protein expression and mRNA levels. (B) Representative examples of cell surface expression of CXCR1 and CCR4 on naive, CM, EM, and EMRA CD8 T cells. (C) Distribution of CXCR1+ CD8 T cells among subsets of CD8 T cells defined by expression/absence of CD27 and CD28. CXCR1+ CD8 T cells were highly enriched within the CD27– and CD28– subpopulations of CD8 T cells. Data represent the mean (± SD) of 3 to 12 healthy blood donors. Several donors were tested more than once. n.d. indicates not done.
Chemokine receptor expression on CD8 T-cell subsets. (A) Protein and mRNA levels of chemokine receptors were assessed on naive, central memory (CM), effector memory (EM), and CD45RA re-expressing effector memory (EMRA) CD8 T cells. CXCR1 and CX3CR1 were selectively expressed on EMRA CD8 T cells, while CCR4 was selectively expressed on CM and EM CD8 T-cell subsets. Note the generally tight association of protein expression and mRNA levels. (B) Representative examples of cell surface expression of CXCR1 and CCR4 on naive, CM, EM, and EMRA CD8 T cells. (C) Distribution of CXCR1+ CD8 T cells among subsets of CD8 T cells defined by expression/absence of CD27 and CD28. CXCR1+ CD8 T cells were highly enriched within the CD27– and CD28– subpopulations of CD8 T cells. Data represent the mean (± SD) of 3 to 12 healthy blood donors. Several donors were tested more than once. n.d. indicates not done.
Ligand-induced internalization
CD8 T cells were negatively selected as described. CD8 T cells were suspended in RPMI with 1% normal human serum and incubated for 45 minutes at 37°C with IL-8 and MDC at various concentrations. After incubation, cells were washed, and expression of CXCR1 and CCR4 on subsets of CD8 T cells was determined by flow cytometry.
Cytotoxicity assay
CXCR1+ CD8 T cells, CX3CR1+ CD8 T cells, CCR7–CD45RAhigh CD8 T cells, and bulk CD8 T cells were sorted (as described) and used as effector cells. EBV-immortalized B cells were used as target cells. The caspase-3–activity assay was performed as previously described.18 Briefly, effector cells were incubated in duplicates with target cells at a 1:1 ratio. To activate effector cells, 4 μg/mL anti-CD3 monoclonal antibody (mAb) (OKT3, immunoglobuln G2a [IgG2a]) (eBioscience, San Diego, CA) was used. Plates were centrifuged at 25g for 30 seconds and incubated for 90 minutes at 37°C prior to adding caspase-3 substrate for an additional 30 minutes. The percentage of caspase-3–activity–positive target cells was analyzed by flow cytometry. Caspase-3 activity induction was almost entirely dependent on anti-CD3 mAb activation (less than 5% killing in absence of anti-CD3 mAb) (Figure 3C), excluding potentially contaminating NK cells from contributing to killing.
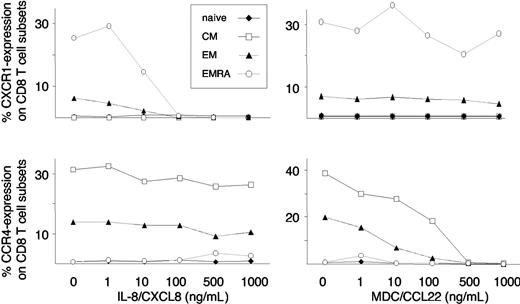
MDC- and IL-8–induced cell-surface down-regulation of CCR4 and CXCR1 on CD8 T-cell subsets. CD8 T cells were exposed to increasing concentrations of MDC and IL-8, and cell-surface expression was assessed by flow cytometry. MDC selectively induced a dose-dependent internalization of CCR4 on CM and EM CD8 T cells, while IL-8 selectively induced a dose-dependent internalization of CXCR1 on EM and EMRA CD8 T cells. Representative data from 4 independent experiments are shown.
MDC- and IL-8–induced cell-surface down-regulation of CCR4 and CXCR1 on CD8 T-cell subsets. CD8 T cells were exposed to increasing concentrations of MDC and IL-8, and cell-surface expression was assessed by flow cytometry. MDC selectively induced a dose-dependent internalization of CCR4 on CM and EM CD8 T cells, while IL-8 selectively induced a dose-dependent internalization of CXCR1 on EM and EMRA CD8 T cells. Representative data from 4 independent experiments are shown.
Intracellular cytokine staining
CCR7–CD45RA– CD8 T cells, CCR7–CD45RAhigh CD8 T cells, and CXCR1+ CD8 T cells were sorted (as described). Sorted CD8 T-cell subsets were incubated in presence/absence of 2 μg/mL anti-CD3 mAb (OKT3, IgG2a) at 37°C, 5% CO2. Brefeldin A (GolgiPlug; BD PharMingen) was added after 1 hour, and after a total incubation period of 6 hours, cells were washed, fixed, and permeabilized with PermeaFix (Ortho Diagnostic Systems), and then incubated for 30 minutes at 4°C with anti-IFNγ mAb (25723.11; BD PharMingen). The percentage of IFNγ+ CD8 T-cell subsets was analyzed by flow cytometry. IFNγ production by CD8 T-cell subsets was entirely dependent on anti-CD3 mAb activation, excluding potentially contaminating NK cells from contributing to the signal observed for IFNγ.
Enzyme-linked immunospot
Peptides corresponding to described optimal HIV-1, EBV, and influenza CD8 T-cell epitopes were synthesized on an automated peptide synthesizer. Fresh or frozen PBMCs were plated in 96-well polyvinylidene difluoride–backed plates (MAIP S45; Millipore, Billerica, MA) previously coated with 0.5 μg/mL anti-IFNγ monoclonal antibody 1-D1k (Mabtech, Stockholm, Sweden) overnight at 4°C. PBMCs were added to the wells at 50 000 to 200 000 cells per well, and plates were processed as described.19 IFNγ-producing cells were counted by direct visualization and expressed as spot-forming cells (SFCs). Negative controls were subtracted and in all cases were fewer than 60 SFCs per 106 input cells.
In vitro peptide stimulation
PBMCs were incubated in RPMI with 10% FCS in the presence of antigen, control peptide (2 μg/mL each), or no peptide for 4 hours at 37°C. After incubation, cells were washed, stained with tetramers and antibodies, and analyzed by flow cytometry.
Statistical analysis
Student t test analyses were performed with JMP Version 3 software (SAS Institute, Cary, NC). Mean values of caspase activity were used from individuals tested twice. Data are presented as mean ± standard deviation (SD).
Study subjects
Influenza- and EBV-specific CD8 T cell responses were analyzed in healthy volunteers. For influenza, 5 donors with a vaccine-induced CD8 T cell-response and 1 donor with an infection-induced response were studied. For EBV, all donors (n = 6) were studied in the chronic/latent phase of infection. HIV-specific CD8 T-cell responses were characterized in individuals (n = 15) followed at the Massachusetts General Hospital ([MGH], Boston, MA). The study was approved by the Institutional Review Board, and we abided by the tenets of the Helsinki protocol. Informed consent was obtained from all study participants.
Results
Expression of chemokine receptors on CD8 T-cell subsets
To begin to understand the homing patterns of human CD8 T-cell subsets, we defined the chemokine receptor profile on naive (CCR7+CD45RAhigh), central memory (CM) (CCR7+CD45RA–), effector memory (EM) (CCR7–CD45RA–), and CD45RA re-expressing effector memory CD8 T cells (EMRA) (CCR7–CD45RAhigh) from healthy donors. The relative proportions of these CD8 T-cell subsets were as follows: naive, 53% ± 9%; CM, 15% ± 4%; EM, 20% ± 7%; EMRA, 12% ± 4% (n = 8). These subsets were examined for cell-surface expression of CCR1–CCR6, CCR9, CXCR1–CXCR6, CX3CR1, and the cytotoxic effector molecule perforin with the use of flow cytometry (Figure 1A). Several different patterns of expression were found. CXCR4 was expressed on more than 90% of naive CD8 T cells, but fewer than 50% of antigen-experienced CD8 T cells. In contrast, CCR5 was absent from naive CD8 T cells, but expressed on approximately 70% of EM CD8 T cells and only 20% to 40% of CM and 20% to 40% of EMRA CD8 T cells. CXCR3 expression was not selective for any subset, while CCR4 was selectively expressed on CM and EM CD8 T cells, but not expressed on naive or EMRA CD8 T cells. CCR6 and CXCR6 were both expressed at high levels (ie, bright stain; data not shown), but on only a small percentage of CM and EM CD8 T cells, and not on EMRA CD8 T cells. In contrast, CX3CR1 and CXCR1 were preferentially expressed on EMRA CD8 T cells. The percentages of CXCR1+ CD8 T cells within CD8 T-cell subsets were as follows: naive, 0.8% ± 0.5%; CM, 0.3% ± 0.4%; EM, 4.5% ± 2.8%; and EMRA, 28.1% ± 11.1% (n = 12). These same CD8 T-cell subsets were sorted by means of flow cytometry and, with the use of quantitative PCR (QPCR), examined for levels of chemokine receptor mRNA (Figure 1A). A generally tight association of mRNA levels and chemokine receptor expression was observed. Representative flow cytometry data demonstrating the selective expression of CXCR1 on EMRA, and CCR4 on CM and EM CD8 T cells are shown in Figure 1B. Down-regulation of CD27 and CD28 has also been used to distinguish memory- and effector-type CD8 T cells.20,21 Consistent with our findings demonstrating the enrichment of CXCR1+ CD8 T cells in a subset with effector function defined by CCR7 and CD45RA, CXCR1 was highly enriched in the effector-type CD8 T-cell subsets defined by loss of CD27 or CD28 expression (Figure 1C).
CXCR1 is functional on CD8 T cells
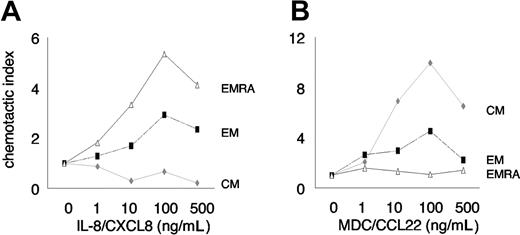
Antigen-experienced CD8 T cells with effector function respond quickly to chemotactic signals in order to efficiently find and eliminate invading pathogens. We therefore assessed the chemotactic response of CD8 T cells to gradients of IL-8 (CXCL8, CXCR1 ligand) and (as an internal control) MDC (CCL22, CCR4 ligand), using a transwell chemotaxis assay. CXCR1+ CD8 T cells and CCR4+ CD8 T cells could not be directly tracked since exposure to their ligands induced rapid and complete internalization of their respective receptors. Since expression of CCR7 and CD45RA was not affected by exposure to IL-8 and MDC (data not shown), we determined chemotaxis of CD8 T-cell subsets defined by these markers along a gradient of IL-8 and MDC. We found a selective and dose-dependent enrichment of EMRA greater than EM CD8 T cells (expressing CXCR1) (Figure 1A-B) in response to a chemotactic gradient of IL-8 (Figure 2A), whereas CM and EM CD8 T cells (expressing CCR4) (Figure 1A-B) selectively migrated in response to a chemotactic gradient of MDC (Figure 2B).
Chemotaxis of CD8 T-cell subsets. Chemotaxis of CD8 T-cell subsets in response to IL-8 (A) and MDC (B). Migration of CM, EM, and EMRA CD8 T cells is shown relative to background migration of naive CD8 T cells. Migration of naive CD8 T cells (CCR7+CD45RAhigh) was not affected by IL-8 or MDC. Subset migration relative to migration of naive CD8 T cells in the absence of chemokine is defined as a chemotactic index of 1. Note that the selective migration of EMRA is greater than that of EM CD8 T cells in response to IL-8, versus the selective migration of CM that is greater than that of EM CD8 T cells in response to MDC. Representative data from 3 independent experiments are shown.
Chemotaxis of CD8 T-cell subsets. Chemotaxis of CD8 T-cell subsets in response to IL-8 (A) and MDC (B). Migration of CM, EM, and EMRA CD8 T cells is shown relative to background migration of naive CD8 T cells. Migration of naive CD8 T cells (CCR7+CD45RAhigh) was not affected by IL-8 or MDC. Subset migration relative to migration of naive CD8 T cells in the absence of chemokine is defined as a chemotactic index of 1. Note that the selective migration of EMRA is greater than that of EM CD8 T cells in response to IL-8, versus the selective migration of CM that is greater than that of EM CD8 T cells in response to MDC. Representative data from 3 independent experiments are shown.
Rapid internalization of many chemokine receptors upon ligand binding is thought to allow a cell to continuously sense small changes in ligand concentration gradients,22,23 and ligand-induced chemokine receptor internalization and chemotaxis can occur independently.24 As another test of CXCR1 responsiveness in CD8 T-cell subsets, CD8 T cells isolated from healthy donors were incubated with increasing concentrations of IL-8 and (as an internal control) MDC. Subsets of CD8 T cells were then examined for cell-surface expression of CXCR1 and CCR4. In a specific and dose-dependent manner, IL-8 induced internalization of CXCR1 on EMRA and EM CD8 T cells, whereas MDC induced internalization of CCR4 on CM and EM CD8 T cells (Figure 3). No effect of IL-8 and MDC on cell surface staining of their respective receptors was observed when experiments were repeated at 4°C, thus excluding competition of IL-8 and MDC for antibody binding (data not shown). Thus, EMRA CD8 T cells selectively migrate toward IL-8, and IL-8 selectively induces CXCR1 internalization on EMRA CD8 T cells.
Cytotoxicity and IFNγ production of CXCR1+ CD8 T cells
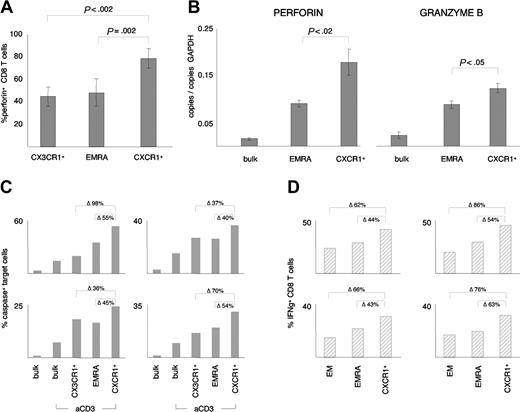
To determine if CXCR1 defined a unique CD8 T-cell subset, we compared expression of perforin in CXCR1+ CD8 T cells with the entire population of EMRA CD8 T cells. Perforin was expressed in approximately 60% more CXCR1+ CD8 T cells than EMRA CD8 T cells, suggesting that CXCR1+ CD8 T cells are more immediately cytotoxic (Figure 4A). Likewise, when mRNA levels of perforin and granzyme B were compared in sorted bulk CD8 T cells, EMRA CD8 T cells, and CXCR1+ CD8 T cells, the highest amount of perforin and granzyme B message was detected in the CXCR1+ CD8 T-cell subset (Figure 4B). Since CX3CR1 is also preferentially expressed on CD8 T cells with an effector phenotype,10 we also compared expression of perforin in CX3CR1+ CD8 T-cell with expression in CXCR1+ CD8 T cells. As was true for EMRA CD8 T cells, approximately 60% more CXCR1+ CD8 T cells expressed perforin compared with the CX3CR1+ subset (Figure 4A). Thus, in contrast to the CXCR1+ subset, the CX3CR1+ subset was not enriched for perforin compared with the bulk EMRA cell population. To directly assess cytotoxic activity, we compared ex vivo cytotoxicity of sorted EMRA CD8 T cells, CX3CR1+ CD8 T cells, CXCR1+ CD8 T cells, and bulk CD8 T cells in an apoptosis assay based on detection of caspase-3 activity at the single-cell level. As shown in Figure 4C, cytotoxic activity varied significantly among individuals, but was always highest in the CXCR1+ subset of CD8 T cells. Cytotoxicity of the CX3CR1+ subset was not higher than cytotoxicity of EMRA CD8 T cells, although both were more cytotoxic than bulk CD8 T cells. In addition to perforin/granzyme–mediated cytotoxicity, IFNγ is also an important component of the CD8 T cell–mediated immune response.25 Consistent with increased cytotoxicity of the CXCR1+ CD8 T-cell subset, there was a significantly higher percentage of IFNγ-producing CD8 T cells in the CXCR1+ subset compared with the EMRA subset (Figure 4D). As was true for cytotoxicity, the number of IFNγ-producing cells varied among individuals, but was always highest in the CXCR1+ subset of CD8 T cells (Figure 4D). These data demonstrate that CXCR1 uniquely defines a subset of IL-8–responsive CD8 T cells with increased cytotoxicity and IFNγ production.
Perforin, granzyme B, and IFNγ expression and ex vivo cytotoxic activity of CD8 T-cell subsets. (A) The percentage of EMRA CD8 T cells and CX3CR1+ CD8 T cells expressing perforin was compared with the percentage of CXCR1+ CD8 T cells expressing perforin. Significantly more CXCR1+ CD8 T cells expressed perforin than either EMRA CD8 T cells (77% ± 9% versus 48% ± 12%) or CX3CR1+ CD8 T cells (77% ± 9% versus 44% ± 8%). Data represent the mean (± SD) from at least 3 independent experiments. (B) Comparison of perforin and granzyme B mRNA expression levels of bulk CD8 T cells, EMRA CD8 T cells, and CXCR1+ CD8 T cells. The mRNA levels of perforin and granzyme B were 2-fold and 0.25-fold higher, respectively, in the CXCR1+ CD8 T-cell subset than in the EMRA CD8 T-cell subset. Data represent the mean (± SD) from 3 independent experiments. (C) Direct ex vivo cytotoxic activity of bulk CD8 T cells, CX3CR1+ CD8 T cells, EMRA CD8 T cells, and CXCR1+ CD8 T cells was compared in 6 individuals, by means of a sensitive caspase-activity assay. Representative data from 4 independent experiments are shown, and data are expressed as the percentage of caspase-positive target cells induced by each indicated group. The relative difference between CXCR1+ CD8 T cells and EMRA CD8 T cells and between CXCR1+ CD8 T cells and CX3CR1+ CD8 T cells is indicated in the figure (Δ). Statistical analysis of the pooled data (n = 6 individuals; 2 of them tested twice) confirmed that cytotoxicity was significantly higher in the CXCR1+ CD8 T-cell subset (42% ± 15% caspase-positive target cells) than in bulk CD8 T cells (21% ± 14% caspase-positive target cells), EMRA CD8 T cells (30% ± 12% caspase-positive target cells), or CX3CR1+ CD8 T cells (28% ± 6% caspase-positive target cells) (P < .005). In the absence of anti-CD3 antibody stimulation, fewer than 5% of target cells were caspase-positive. (D) IFNγ production of anti-CD3–activated EM CD8 T cells, EMRA CD8 T cells, and CXCR1+ CD8 T cells was analyzed by intracellular cytokine staining. Four independent experiments are shown, and data are expressed as the percentage of IFNγ+ cells within the indicated CD8 T-cell subset. The relative difference between cytotoxic activity of CXCR1+ CD8 T cells and EMRA CD8 T cells and between CXCR1+ CD8 T cells and EM CD8 T cells is indicated in the figure (Δ). Statistical analysis of the pooled data (n = 4) confirmed that IFNγ production was significantly higher in the CXCR1+ CD8 T-cell subset (37% ± 7% IFNγ+ CD8 T cells) than in EMRA CD8 T cells (25% ± 5% IFNγ+ CD8 T cells) and EM CD8 T cells (19% ± 4% IFNγ+ CD8 T cells) (P < .005). No IFNγ production was observed in absence of anti-CD3 antibody stimulation (data not shown).
Perforin, granzyme B, and IFNγ expression and ex vivo cytotoxic activity of CD8 T-cell subsets. (A) The percentage of EMRA CD8 T cells and CX3CR1+ CD8 T cells expressing perforin was compared with the percentage of CXCR1+ CD8 T cells expressing perforin. Significantly more CXCR1+ CD8 T cells expressed perforin than either EMRA CD8 T cells (77% ± 9% versus 48% ± 12%) or CX3CR1+ CD8 T cells (77% ± 9% versus 44% ± 8%). Data represent the mean (± SD) from at least 3 independent experiments. (B) Comparison of perforin and granzyme B mRNA expression levels of bulk CD8 T cells, EMRA CD8 T cells, and CXCR1+ CD8 T cells. The mRNA levels of perforin and granzyme B were 2-fold and 0.25-fold higher, respectively, in the CXCR1+ CD8 T-cell subset than in the EMRA CD8 T-cell subset. Data represent the mean (± SD) from 3 independent experiments. (C) Direct ex vivo cytotoxic activity of bulk CD8 T cells, CX3CR1+ CD8 T cells, EMRA CD8 T cells, and CXCR1+ CD8 T cells was compared in 6 individuals, by means of a sensitive caspase-activity assay. Representative data from 4 independent experiments are shown, and data are expressed as the percentage of caspase-positive target cells induced by each indicated group. The relative difference between CXCR1+ CD8 T cells and EMRA CD8 T cells and between CXCR1+ CD8 T cells and CX3CR1+ CD8 T cells is indicated in the figure (Δ). Statistical analysis of the pooled data (n = 6 individuals; 2 of them tested twice) confirmed that cytotoxicity was significantly higher in the CXCR1+ CD8 T-cell subset (42% ± 15% caspase-positive target cells) than in bulk CD8 T cells (21% ± 14% caspase-positive target cells), EMRA CD8 T cells (30% ± 12% caspase-positive target cells), or CX3CR1+ CD8 T cells (28% ± 6% caspase-positive target cells) (P < .005). In the absence of anti-CD3 antibody stimulation, fewer than 5% of target cells were caspase-positive. (D) IFNγ production of anti-CD3–activated EM CD8 T cells, EMRA CD8 T cells, and CXCR1+ CD8 T cells was analyzed by intracellular cytokine staining. Four independent experiments are shown, and data are expressed as the percentage of IFNγ+ cells within the indicated CD8 T-cell subset. The relative difference between cytotoxic activity of CXCR1+ CD8 T cells and EMRA CD8 T cells and between CXCR1+ CD8 T cells and EM CD8 T cells is indicated in the figure (Δ). Statistical analysis of the pooled data (n = 4) confirmed that IFNγ production was significantly higher in the CXCR1+ CD8 T-cell subset (37% ± 7% IFNγ+ CD8 T cells) than in EMRA CD8 T cells (25% ± 5% IFNγ+ CD8 T cells) and EM CD8 T cells (19% ± 4% IFNγ+ CD8 T cells) (P < .005). No IFNγ production was observed in absence of anti-CD3 antibody stimulation (data not shown).
CXCR1 expression on influenza-, EBV-, and HIV-1–specific CD8 T cells
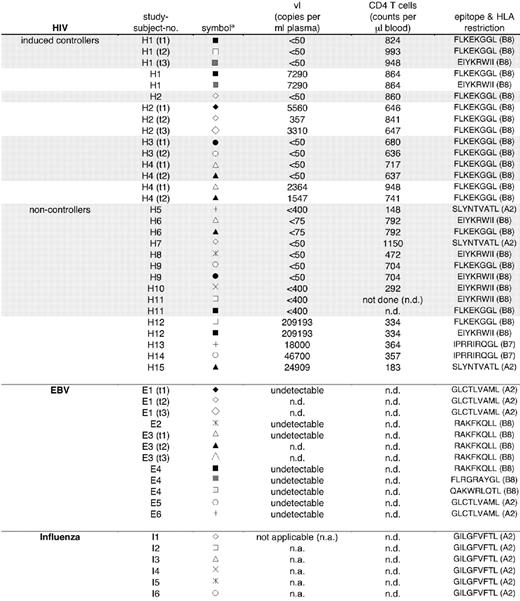
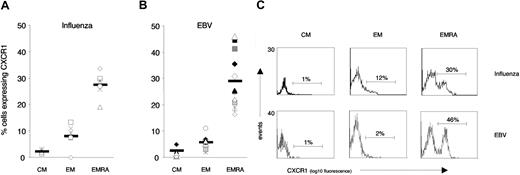
We next examined CXCR1 expression on antigen-specific CD8 T cells directed against influenza, EBV, and HIV-1 epitopes in individuals with known responses as determined by enzyme-linked immunospot (ELISpot) analyses. Patient characteristics are summarized in Figure 5. Major histocompatibility complex (MHC) class I tetramers were used to identify antigen-specific CD8 T cells. Distribution of influenza-specific CD8 T-cell maturation subsets (CM, EM, EMRA) was as follows: CM, 34 ± 22; EM, 39 ± 15; EMRA, 27 ± 11. Distribution of EBV-specific CD8 T-cell subsets was as follows: CM, 8 ± 6; EM, 49 ± 5; EMRA, 44 ± 11. Similarly to the distribution on bulk CD8 T cells, on EBV- and influenza-specific CD8 T cells, CXCR1 was expressed on 25% to 30% of antigen-specific EMRA CD8 T cells, while CXCR1 was detected on only approximately 10% of EM and approximately 2% of CM CD8 T cells. This expression pattern was observed for antigen-specific EMRA CD8 T cells targeting an HLA-A2–restricted matrix-derived influenza epitope (GILGFVFTL), as well as 2 latent and 2 lytic EBV epitopes (latent, HLA-B8–restricted FLRGRAYGL [EBNA3A] and QAKWRLQTL [EBNA3A]; lytic, HLA-A2–restricted GLCTLVAML [BMLF1] and HLA-B8–restricted RAKFKQLL [BZLF1]) (Figure 6A-B). As expected, no EBV DNA was detectable by PCR in the plasma of any of the individuals studied (data not shown). Representative flow-cytometry profiles of CXCR1 expression on influenza- and EBV-specific CD8 T-cell subsets are shown in Figure 6C.
Summary of clinical, virologic, and immunologic parameters of study participants. Shaded indicates patient on highly active antiretroviral therapy (HAART); not shaded indicates off HAART. — indicates undetectable; ND, not done; NA, not applicable. *Symbols indicate study subjects within clinical category and correspond to symbols used in Figures 6A-B and 7A.
Summary of clinical, virologic, and immunologic parameters of study participants. Shaded indicates patient on highly active antiretroviral therapy (HAART); not shaded indicates off HAART. — indicates undetectable; ND, not done; NA, not applicable. *Symbols indicate study subjects within clinical category and correspond to symbols used in Figures 6A-B and 7A.
CXCR1 expression on subsets of EBV- and influenza-specific CD8 T cells. The percentage of antigen-specific CD8 T-cell subsets expressing CXCR1 was assessed by means of HLA class I tetramers combined with antibody staining. CD8 T-cell responses were identified by ELISpot analyses using optimal epitope peptides and are given in Figure 5. (A) Percentage of CXCR1 expression on subsets of influenza-specific CD8 T cells. (B) Percentage of CXCR1 expression on subsets of EBV-specific CD8 T cells. Both lytic and latent antigen-specific CD8 T-cell responses were analyzed (Figure 5). (C) Representative flow-cytometry profiles of CXCR1 expression on influenza- and EBV-specific CD8 T-cell subsets.
CXCR1 expression on subsets of EBV- and influenza-specific CD8 T cells. The percentage of antigen-specific CD8 T-cell subsets expressing CXCR1 was assessed by means of HLA class I tetramers combined with antibody staining. CD8 T-cell responses were identified by ELISpot analyses using optimal epitope peptides and are given in Figure 5. (A) Percentage of CXCR1 expression on subsets of influenza-specific CD8 T cells. (B) Percentage of CXCR1 expression on subsets of EBV-specific CD8 T cells. Both lytic and latent antigen-specific CD8 T-cell responses were analyzed (Figure 5). (C) Representative flow-cytometry profiles of CXCR1 expression on influenza- and EBV-specific CD8 T-cell subsets.
For our HIV studies, we analyzed individuals belonging to 2 clinical categories: (i) persons able to control HIV-1 replication at relatively low levels (fewer than 7500 copies per milliliter plasma) without highly active antiretroviral therapy (HAART) (controllers), and (ii) persons unable to control viral replication off HAART (noncontrollers). The group of controllers was recruited from the Boston, MA, acute–structured treatment interruption (STI) cohort, which is following persons induced to control HIV-1 replication through treatment of acute HIV-1 infection, followed by supervised treatment interruptions (induced controllers, H1-H4).26 These induced controllers offered the unique opportunity to study persons able to control HIV-1 replication both on and off HAART. The group of noncontrollers was subdivided into persons on HAART (H5-H11) and persons off HAART (H12-H15). The following tetramers were used to analyze HIV-1–specific CD8 T cells: HLA-B8–restricted, FLKEKGGL (nef); HLA-B8–restricted, EIYKRWII (p24); HLA-B7–restricted, IPRRIRQGL (gp41); and HLA-A2–restricted, SLYNTVATL (p17).
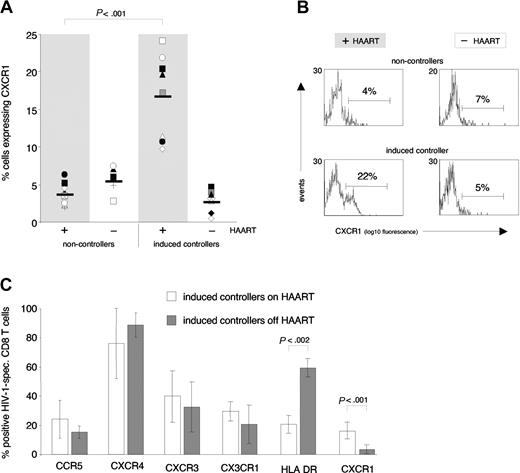
In noncontrollers (both on and off HAART), a mean of only approximately 5% of HIV-1–specific CD8 T cells expressed CXCR1 (Figure 7A, left panels). In contrast, a significant percentage of HIV-1–specific CD8 T cells isolated from induced controllers on HAART (viral loads fewer than 50 copies per milliliter plasma) expressed CXCR1 (mean 16%) (Figure 7A, right shaded panel). However, when these same persons were off HAART and viral loads increased (range, 357-7290 copies per milliliter plasma), the percentage of CXCR1+ HIV-1–specific CD8 T cells decreased to a mean of 3% (Figure 7A, right nonshaded panel). Expression of CXCR1 on HIV-1–specific CD8 T cells in medically controlled HIV-1 infection thus differentiated persons able to control HIV-1 replication from persons unable to do so when HAART was discontinued. Representative flow-cytometry profiles of CXCR1 expression on HIV-1–specific CD8 T cells in noncontrollers and induced controllers, both on and off HAART, are shown in Figure 7B.
CXCR1 expression on HIV-1–specific CD8 T cells in noncontrollers and controllers. (A) The percentage of antigen-specific CD8 T cells expressing CXCR1 was assessed by means of HLA class I tetramers combined with antibody staining. The 2 left columns compare CXCR1 expression on HIV-1–specific CD8 T cells in noncontrolling individuals on HAART (shaded column, H5-H11; viral loads below detection limit) with noncontrolling individuals off HAART (nonshaded column, H12-H15; viral load range, 18 000-209 193 copies per mL plasma) (cross-sectional comparison). The 2 right columns longitudinally compare CXCR1 expression on HIV-1–specific CD8 T cells in induced controllers (H1-H4) on HAART (shaded column, viral loads below detection limit) and off HAART (nonshaded column; viral load range, 357-7290 copies per mL plasma). Significant expression of CXCR1 on HIV-1–specific CD8 T cells was observed only in persons on HAART with treated acute HIV-1 infection (induced controllers). (B) Representative flow-cytometry profiles of CXCR1 expression on HIV-1–specific CD8 T cells in noncontrollers and induced controllers, both on and off HAART. (C) In contrast to CXCR1, no significant differences were observed in the percentage of HIV-1–specific CD8 T cells that expressed CCR5, CXCR4, CXCR3, or CX3CR1 when induced controllers were studied on or off HAART. The percentage of HIV-1–specific CD8 T cells that expressed HLA-DR, however, was significantly higher when these were analyzed while people were off, as opposed to on, HAART (60% ± 6% versus 21% ± 6%). Data represent the mean (± SD) of at least 4 independent measurements.
CXCR1 expression on HIV-1–specific CD8 T cells in noncontrollers and controllers. (A) The percentage of antigen-specific CD8 T cells expressing CXCR1 was assessed by means of HLA class I tetramers combined with antibody staining. The 2 left columns compare CXCR1 expression on HIV-1–specific CD8 T cells in noncontrolling individuals on HAART (shaded column, H5-H11; viral loads below detection limit) with noncontrolling individuals off HAART (nonshaded column, H12-H15; viral load range, 18 000-209 193 copies per mL plasma) (cross-sectional comparison). The 2 right columns longitudinally compare CXCR1 expression on HIV-1–specific CD8 T cells in induced controllers (H1-H4) on HAART (shaded column, viral loads below detection limit) and off HAART (nonshaded column; viral load range, 357-7290 copies per mL plasma). Significant expression of CXCR1 on HIV-1–specific CD8 T cells was observed only in persons on HAART with treated acute HIV-1 infection (induced controllers). (B) Representative flow-cytometry profiles of CXCR1 expression on HIV-1–specific CD8 T cells in noncontrollers and induced controllers, both on and off HAART. (C) In contrast to CXCR1, no significant differences were observed in the percentage of HIV-1–specific CD8 T cells that expressed CCR5, CXCR4, CXCR3, or CX3CR1 when induced controllers were studied on or off HAART. The percentage of HIV-1–specific CD8 T cells that expressed HLA-DR, however, was significantly higher when these were analyzed while people were off, as opposed to on, HAART (60% ± 6% versus 21% ± 6%). Data represent the mean (± SD) of at least 4 independent measurements.
Other chemokine receptors expressed on HIV-1–specific CD8 T cells isolated from induced controllers (eg, CX3CR1, CXCR3, CCR5, CXCR4) did not vary significantly with viral load. In contrast, HLA-DR, which is commonly used as a CD8 T-cell activation marker,27,28 displayed an expression pattern inverse to that of CXCR1, being expressed on approximately 3-fold more HIV-1–specific CD8 T cells at times when persons were off HAART, compared with when they were on HAART (Figure 7C). Thus, CXCR1 appears to be uniquely regulated on HIV-1–specific CD8 T cells.
Antigen-induced down-regulation of CXCR1
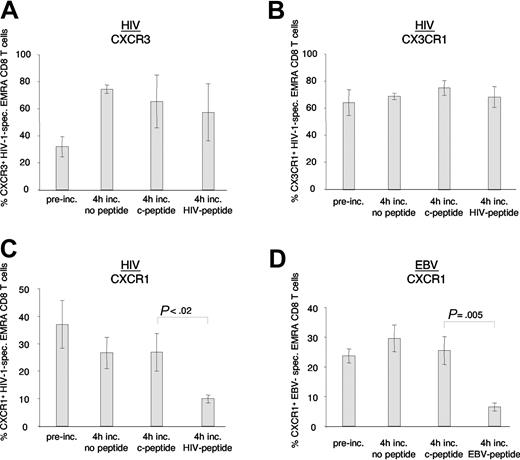
We hypothesized that antigen exposure and hence activation in vivo, as suggested by increased expression of HLA-DR off HAART, down-modulated CXCR1 on antigen-specific effector CD8 T cells of induced controllers. To confirm this in vitro, we pulsed autologous antigen-presenting cells of study participants H1, H3, H4, and E3 with optimal epitope peptides, and examined the effect of antigen-specific activation on levels of CXCR1, CX3CR1, and CXCR3 expression on antigen-specific EMRA CD8 T cells (Figure 8). The percentage of EMRA CD8 T cells that expressed CXCR3 on HIV-1–specific CD8 T cells increased after a 4-hour incubation period, irrespective of addition of antigen, control peptide, or no peptide (Figure 8A). The percentage of EMRA CD8 T cells that expressed CX3CR1 did not significantly change following 4 hours of incubation with antigen, control peptide, or no peptide (Figure 8B). In contrast, the percentage of both HIV-1–specific and EBV-specific EMRA CD8 T cells (but not bulk CD8 T cells; data not shown) that expressed CXCR1 on their cell-surface was markedly decreased following a 4-hour incubation with their cognate antigen, but not following incubation with control peptide or no peptide (Figure 8C-D). These data demonstrate that cell-surface expression of CXCR1 is uniquely down-modulated upon antigen-specific activation of EMRA CD8 T cells.
Antigen-specific stimulation of HIV-1– and EBV-specific CD8 T cells in vitro. PBMCs from study subjects H1, H3, H4 (all HIV-1), and E3 (EBV) were pulsed with antigen (HIV-1 or EBV peptide) or control peptide (c-peptide) or were left unpulsed (no peptide). After a 4-hour incubation, expression of CXCR3 (A), CX3CR1 (B), and CXCR1 (C-D) was assessed on antigen-specific EMRA CD8 T cells. Note that CXCR3 cell-surface expression increased, while CX3CR1 levels did not change following the 4-hour incubation, irrespective of incubation conditions. In contrast, CXCR1 expression decreased on HIV-1– and EBV-specific EMRA CD8 T cells stimulated with cognate antigen. Data represent the mean (± SD) of 3 and 2 independent experiments for HIV-1 and EBV, respectively.
Antigen-specific stimulation of HIV-1– and EBV-specific CD8 T cells in vitro. PBMCs from study subjects H1, H3, H4 (all HIV-1), and E3 (EBV) were pulsed with antigen (HIV-1 or EBV peptide) or control peptide (c-peptide) or were left unpulsed (no peptide). After a 4-hour incubation, expression of CXCR3 (A), CX3CR1 (B), and CXCR1 (C-D) was assessed on antigen-specific EMRA CD8 T cells. Note that CXCR3 cell-surface expression increased, while CX3CR1 levels did not change following the 4-hour incubation, irrespective of incubation conditions. In contrast, CXCR1 expression decreased on HIV-1– and EBV-specific EMRA CD8 T cells stimulated with cognate antigen. Data represent the mean (± SD) of 3 and 2 independent experiments for HIV-1 and EBV, respectively.
Discussion
Chemokine receptor expression is tightly controlled during T-cell development, differentiation, and activation, controlling homing of lymphocyte subsets.12,29-31 To begin to understand the molecular basis for the different trafficking patterns of CD8 T-cell subsets, we screened CD8 T cells phenotypically characterized as naive, central memory (CM), effector memory (EM), and CD45RA re-expressing effector memory (EMRA) cells, using a panel of 16 chemokine receptor monoclonal antibodies. We found that chemokine receptors were differentially expressed on CD8 T-cell subsets. CXCR4 was preferentially expressed on naive cells; CCR4 and CCR6 on CM cells; CCR5 and CXCR6 on EM cells; and CXCR1 and CX3CR1 on EMRA cells. In addition to the functional implications of CD8 T cells with effector function that respond to IL-8 (discussed in the next few paragraphs), our study identified CXCR1 as defining a novel subset of CD8 T cells with uniquely high levels of IFNγ, perforin, and cytotoxic activity.
CXCR1-ligand (IL-8/CXCL8 and granulocyte chemotactic protein-2 [GCP-2]/CXCL6) responsiveness will allow this subset of highly cytotoxic CD8 T cells to respond to signals derived from innate immune responses. Toll-like receptors (TLRs) have recently been shown to play an important role in innate immune recognition of pathogens.32 Upon activation, TLRs lead to a signal transduction cascade that results in cellular activation and chemokine release, with one of the earliest and most abundantly produced chemokines being IL-8.13,33 CXCR1 thus defines a “rapid-responder” subset of CD8 T cells that bridges the gap between the innate and acquired immune responses. CXCR1+ CD8 T cells may provide highly cytotoxic antigen-specific effector function early at sites of infection, prior to the generation of a new wave of effector cells that first needs to be induced to proliferate and differentiate from CM and EM pools.
Several earlier reports provided evidence for IL-8 responsiveness of CD8 T cells; however, the notion that IL-8 can act as a direct T-cell chemoattractant has been controversial.34-39 Our analysis offers a possible explanation for these seemingly contradictory studies, by demonstrating that functional CXCR1 is expressed on only a relatively small subset of highly cytotoxic CD8 T cells. High levels of CXCR1 expression on neutrophils and NK cells make it difficult to identify expression and function of this receptor on CD8 T cells in samples that contain even small amounts of these other cell types. Furthermore, as demonstrated in our study, rapid down-modulation of CXCR1 by both ligand and antigen may have further complicated the analysis of CXCR1 expression and function on CD8 T cells.
As was true for bulk CD8 T cells, CXCR1 was also preferentially expressed on influenza- and EBV-specific EMRA CD8 T cells. The small possibility that certain viruses could alter the expression pattern of CXR1 on maturation subsets therefore seems unlikely. To begin to assess the physiologic importance of CXCR1+ CD8 T cells in the control of chronic viral infections, the percentage of CXCR1+ CD8 T cells was compared in persons who were able to control HIV-1 replication and persons who were unable to control HIV-1 replication. Interestingly, significant expression of CXCR1 on HIV-1–specific CD8 T cells in individuals on HAART was restricted to persons who were able to control HIV-1 replication when taken off HAART (Figure 7A; for viral loads, see Figure 5). These data suggest that HIV-1–specific CXCR1+ CD8 T cells are poised to deliver highly cytotoxic antigen-specific effector function early at sites of infection, and therefore may play a role in limiting the spread and/or formation of viral reservoirs, thus influencing viral load set point and outcome of HIV-1 infection.
Off HAART, little expression of CXCR1 on HIV-1–specific CD8 T cells was observed (Figure 7A, nonshaded panels). Several factors might account for the absence of HIV-1–specific CXCR1+ CD8 T cells in controllers studied off HAART. CXCR1+ CD8 T cells might be preferentially recruited into sites of viral replication, thus being absent from the peripheral blood. Alternatively, CXCR1 expression might be down-regulated via antigen-specific activation. Consistent with this second hypothesis, we found that CXCR1 was selectively down-modulated on HIV-1–and EBV-specific CD8 T cells following antigen-specific activation in vitro. In neutrophils, in addition to ligand-induced internalization, proinflammatory stimuli, such as tumor necrosis factor (TNF) and lipopolysaccharide (LPS), have been shown to down-modulate CXCR1 through proteolytic cleavage.40 It is intriguing to note that levels of CXCR1 on both neutrophils and effector CD8 T cells are tightly controlled, suggesting that differential responsiveness to CXCR1 agonists is an important feature in fine-tuning the immune response.
In summary, we have identified an IL-8–responsive, CXCR1+ subset of highly cytotoxic CD8 T cells, presumably poised to rapidly deliver an antigen-specific cytotoxic response to sites of innate immune system activation. In HIV-1 infection, expression of CXCR1 was characteristic of persons who, when taken off HAART, were able (at least transiently) to control HIV-1 replication. Antigen-driven shaping of migratory characteristics of CD8 T-cell subsets, as demonstrated here for CXCR1, provides a novel mechanism whereby the immune system may adapt to changing requirements during differing stages of an ongoing immune response.
Prepublished online as Blood First Edition Paper, August 3, 2004; DOI 10.1182/blood-2004-03-1067.
Supported by the National Institutes of Health (A.D.L., B.D.W., C.B., M.A., M.M.A., T.W., P.A., and T.K.M.); the Doris Duke Charitable Foundation (B.D.W. and M.A.); the FAIR-foundation (A.D.L. and M.A.); and the Swiss National Science Foundation (C.H.).
The publication costs of this article were defrayed in part by page charge payment. Therefore, and solely to indicate this fact, this article is hereby marked “advertisement” in accordance with 18 U.S.C. section 1734.
We thank L. M. Henry for excellent technical assistance.

This feature is available to Subscribers Only
Sign In or Create an Account Close Modal