Abstract
Resistance of leukemic cells to chemotherapeutic agents is associated with an unfavorable outcome in pediatric acute lymphoblastic leukemia (ALL). To investigate the underlying mechanisms of cellular drug resistance, the activation of various apoptotic parameters in leukemic cells from 50 children with ALL was studied after in vitro exposure with 4 important drugs in ALL therapy (prednisolone, vincristine, l-asparaginase, and daunorubicin). Exposure to each drug resulted in early induction of phosphatidylserine (PS) externalization and mitochondrial transmembrane (Δψm) depolarization followed by caspase-3 activation and poly(ADP-ribose) polymerase (PARP) inactivation in the majority of patients. For all 4 drugs, a significant inverse correlation was found between cellular drug resistance and (1) the percentage of cells with PS externalization (< .001 < P < .008) and (2) the percentage of cells with Δψm depolarization (.002 < P < .02). However, the percentage of cells with caspase-3 activation and the percentage of cells with PARP inactivation showed a significant inverse correlation with cellular resistance for prednisolone (P = .001; P = .001) and l-asparaginase (P = .01; P = .001) only. This suggests that caspase-3 activation and PARP inactivation are not essential for vincristine- and daunorubicin-induced apoptosis. In conclusion, resistance to 4 unrelated drugs is associated with defect(s) upstream or at the level of PS externalization and Δψm depolarization. This leads to decreased activation of apoptotic parameters in resistant cases of pediatric ALL. (Blood. 2003;102:4541-4546)
Introduction
Although combination chemotherapy has improved the prognosis of childhood acute lymphoblastic leukemia (ALL) over the last few decades, relapse still occurs in 20% to 30% of the cases.1 Cellular drug resistance measured at initial diagnosis is associated with an increased relapse risk and unfavorable clinical outcome in childhood ALL.2,3 In addition, the presence of adverse clinical prognostic factors such as older age (> 10 years) and pro-B and T-lineage immunophenotype have been shown to be associated with cellular resistance to drugs in children with ALL.4 These findings indicate that cellular drug resistance (measured in vitro) can be used as a tool to identify patients at higher risk of treatment failure.
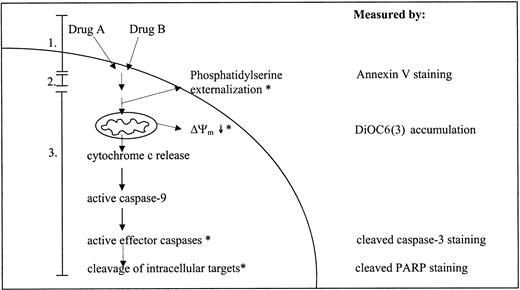
Chemotherapeutic agents have been described to induce apoptosis in malignant cells.5 There are 2 major routes by which apoptosis can be induced: the extrinsic or death receptor-associated route and the intrinsic or mitochondrial route. Although there is disagreement concerning the role of the extrinsic route in chemotherapy-induced apoptosis,6,7 there is a general agreement regarding the importance of the intrinsic route. The intrinsic route can be subdivided into 3 general phases:8 (1) insult generation, (2) signal transduction, and (3) execution. During the insult generation phase, chemotherapeutic agents interact with and cause damage to their specific cellular targets. The signal transduction phase is the least-defined phase and is thought to involve integration of pro- and antiapoptotic signals. The relative abundances of pro- and antiapoptotic signals, that can be influenced by anticancer drugs,9 ultimately determines if the execution phase is initiated.10 The execution phase is initiated by release of cytochrome c and other polypeptides from the mitochondrial intermembrane space.11 This release is accompanied by a dissipation of mitochondrial inner transmembrane potential (Δψm).12 Once released in the cytoplasm, cytochrome c interacts with Apaf-1 (apoptotic protease-activating factor-1), adenosine triphosphate-deoxyadenosine triphosphate (ATP/dATP), and procaspase-9 to form a complex known as the apoptosome.13 In the apoptosome, caspase-9 is activated which in turn activates effector caspases, like procaspase-3 and -7.14 The effector caspases cleave a number of structural and regulatory cellular proteins (eg, poly(ADP-ribose) polymerase [PARP], lamins) and are responsible for the typical morphologic and biochemical features of an apoptotic cell.15,16 A simplified overview of the events taking place during chemotherapy-induced apoptosis is given in Figure 1.
Simplified overview of the events taking place during drug-induced activation of apoptotic parameters. Drugs A and B represent 2 structurally unrelated drugs. Numbers 1, 2, and 3 refer to the 3 phases of the drug-induced apoptotic route as described in “Introduction”: 1 indicates insult generation; 2, signal transduction; and 3, execution. Parameters with an asterisk (*) are measured in this study using flow cytometry; the right column indicates the detection method used.
Simplified overview of the events taking place during drug-induced activation of apoptotic parameters. Drugs A and B represent 2 structurally unrelated drugs. Numbers 1, 2, and 3 refer to the 3 phases of the drug-induced apoptotic route as described in “Introduction”: 1 indicates insult generation; 2, signal transduction; and 3, execution. Parameters with an asterisk (*) are measured in this study using flow cytometry; the right column indicates the detection method used.
The fact that a point of convergence in the cellular response to cytotoxic drugs appears to be apoptosis and that leukemic cells display cross-resistance to drugs with different mechanisms of action has led to the hypothesis that cellular drug resistance may be related to defects in the apoptotic route. Aberrations at various levels of the apoptotic route have been linked to a drug-resistant phenotype in cell lines: absence of cytochrome c release,17,18 defective Apaf-1 activity,19-21 and caspase deficiency.22-24 However, the occurrence of apoptotic defects has not been studied in children with ALL. Therefore, the aim of this study was to determine whether cellular drug resistance is associated with defects in drug-induced apoptosis in pediatric ALL. To this aim, leukemic cells of 50 children with newly diagnosed ALL were exposed in vitro to 4 structurally unrelated drugs used in induction therapy of ALL, and activation of various apoptotic parameters was evaluated (Figure 1).
Materials and methods
Patient samples
Bone marrow (BM) and/or peripheral blood (PB) were obtained from children with newly diagnosed ALL who entered the Sophia Children's Hospital or one of the hospitals participating in the German Cooperative Acute Lymphoblastic Leukemia (COALL) study. Within 24 hours after sampling, mononuclear cells were isolated by density gradient centrifugation with a Ficoll-Isopaque gradient (Lymphoprep 1.077 mg/mL; Nycomed Pharma, Oslo, Norway). Cells were resuspended in culture medium consisting of RPMI 1640 Dutch modification without l-glutamine (Gibco BRL, Breda, The Netherlands) supplemented with 20% fetal calf serum (FCS; Integro, Zaandam, The Netherlands), 2 × 10³ μmol/L l-glutamine, 900 μmol/L gentamycin (Gibco BRL), 100 IU/mL penicillin, 100 μg/mL streptomycin, 0.125 μg/mL fungizone (Gibco BRL), and 827 pmol/L insulin, 5 × 10⁻³ g/L transferrin, and 2.89 × 10⁻⁵ μmol/L sodium selenite (ITS media supplement; Sigma Aldrich, Zwijndrecht, The Netherlands). If necessary, the lymphoid cells were further purified to at least 90% leukemic blasts by removing nonmalignant cells with immunomagnetic beads (DynaBeads, Dynal, Oslo, Norway).
In vitro drug resistance assay
In vitro drug resistance for daunorubicin (DNR; Cerubidine, Rhône- Poulenc Rorer, Amstelveen, The Netherlands), vincristine (VCR; TEVA Pharma, Mijdrecht, The Netherlands), l-asparaginase (ASP; Paronal, Christiaens, Breda, The Netherlands), and prednisolone (PRED; Bufa Pharmaceutical Products, Uitgeest, The Netherlands) was determined using the 4-day MTT (3-[4,5-dimethylthiazol-2-yl]-2,5-diphenyltetrazoliumbromide) assay as described previously by Pieters et al.25 Briefly, round-bottomed 96-well microculture plates were filled with 20 μL of different dilutions of a drug and stored at -20°C. Six concentrations of each drug were tested in duplicate. The ranges of the final concentrations of these drugs were as follows: DNR: 0.002 μg/mL to 2.0 μg/mL; VCR: 0.05 μg/mL to 50 μg/mL; ASP: 0.003 IU/mL to 10 IU/mL; and PRED: 0.008 μg/mL to 250 μg/mL.
Aliquots of 80 μL cell suspension (2 × 10⁶ cells/mL) were added to each well. Four wells contained 100 μL culture medium without drugs or cells for blanking the plate reader and 8 wells contained 100 μL culture medium with cells and without drug for measuring control cell viability. After incubating plates for 4 days at 37°C in a humidified incubator in 5% CO2, 10 μL MTT (5 mg/mL; Sigma) was added and the plates were incubated for an additional 6 hours. During these 6 hours, the living cells present in each well will reduce the yellow MTT tetrazolium salt to purple-blue formazan crystals. The formazan crystals were dissolved with 100 μL 0.04 N HCl-isopropanyl alcohol (acidified isopropanol). The optical density (OD) of the wells, which is linearly related to cell number,26 was measured spectrophotometrically at 562 nm. Leukemic cell survival (LCS) was calculated by the equation: LCS = (ODday4 treated well/mean ODday4 control wells) × 100%. The drug concentration lethal to 50% of the ALL cells, the LC50 value, was used as a measure for cellular drug resistance. MTT-assay results were only used if the drug-free control wells contained at least 70% leukemic cells after 4 days of culture.
In vitro drug exposure for measuring apoptotic features
Fresh leukemic cells (2.0 × 10⁶ cells/mL) with a purity of at least 90% leukemic blasts were cultured in the presence of drugs at 37°C in a humidified incubator in 5% CO2. The ranges of the final drug concentrations were as follows: PRED: 0.061 μg/mL to 250 μg/mL; VCR: 0.195 μg/mL to 50 μg/mL; ASP: 0.016 IU/mL to 10 IU/mL; and DNR: 0.008 μg/mL to 2.0 μg/mL.
Measurement of aberrant phosphatidylserine externalization on the outer cell membrane
During the early stages of apoptosis, phosphatidylserine (PS) is translocated from the inner side of the plasma membrane to the outer leaflet of the cell membrane. Annexin V is a Ca2+-dependent phospholipid-binding protein with high affinity for PS and can therefore be used to detect apoptotic cells. Leukemic cells were resuspended in 200 μL Annexin V-Alexa 488 Reagent (Nexins Research BV, Kattendijke, The Netherlands) and incubated for 15 minutes at 4°C. A total of 5000 events was analyzed by flow cytometry (FACSCalibur, Becton Dickinson, Erembodegem, Belgium). Drug-induced apoptosis was calculated according to the following formula: percentage of apoptotic cells = 100% × (D-C)/(100-C), where D represents the percentage of Annexin V-positive cells in the presence of a drug and C is the percentage of Annexin V-positive cells in the absence of a drug (spontaneous apoptosis). The intra-assay coefficient of variation for measurements of PS externalization was 3.4%.
Detection of apoptosis-associated alterations in Δψm
Disruption of Δψm was determined using 3,3′-dihexyloxacarbocyanine iodide (DiOC6(3); Molecular Probes, Eugene, OR), a lipophilic cationic dye that accumulates in the mitochondrial matrix driven by Δψm.27 Loss of Δψm was visualized as a reduction in the signal in the FL1 channel. Leukemic cells were incubated in 200 μL phosphate-buffered saline (PBS) containing 40 nM DiOC6(3) solution and incubated in a humidified incubator for 30 minutes at 37°C in 5% CO2. A total of 5000 events was analyzed by flow cytometry. Percentage of cells with decreased mitochondrial transmembrane depolarization (Δψm↓) was calculated with the following formula: 100% × (D-C)/(100-C), where D represents the percentage of cells with reduced DiOC6(3) accumulation in drug-treated samples and C represents the percentage of cells with reduced DiOC6(3) accumulation in untreated samples. The intra-assay coefficient of variation for measurements of disruption of Δψm was 4.5%.
Measurement of caspase-3 and PARP cleavage
Leukemic cells were fixed using 2% (vol/vol) 37% formaldehyde solution in 100% acetone. Fixed cells were washed twice with PBS/0.1% bovine serum albumin (BSA) and incubated with an antibody directed against cleaved caspase-3 (Cell Signalling Technology, Beverly, MA) or cleaved PARP (Cell Signalling Technology) at room temperature for 30 minutes. Both antibodies recognize an epitope exposed only when both proteins are cleaved during apoptosis. Subsequently, cells were washed and incubated with fluorescein isothiocyanate (FITC)-conjugated rabbit antirabbit F(ab')2 (DAKO, Glostrup, Denmark) for caspase-3 and FITC-conjugated pork antimouse F(ab')2 (DAKO) for PARP at room temperature for 30 minutes. A total of 5000 events was measured by flow cytometry. Caspase-induced PARP cleavage leads to PARP inactivation,15 hence we measured caspase-3 activation and PARP inactivation. The percentage of cells with caspase-3 activation or PARP inactivation was determined with the following formula: 100% × (D-C)/(100-C), where D represents the percentage of cells that stain positive for the antibody in drug-treated samples, and C is the percentage of cells that stain positive for the antibody in untreated samples. Intra-assay variation of caspase-3 and PARP cleavage measurements was 11.2% and 11.8%, respectively.
Statistics
Correlations between different apoptotic parameters as well as between the LC50 values and apoptotic parameters were calculated using the Spearman rank (rs) correlation test. Statistical tests were performed at a 2-tailed significance level of 0.05.
Results
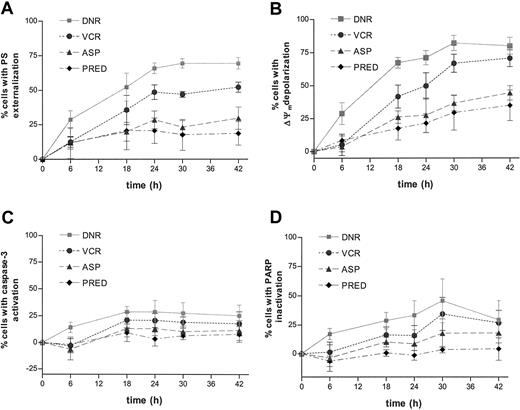
Time-dependent induction of apoptotic parameters was studied in 5 children with ALL in order to determine the most suitable time point for testing a larger group of children with ALL. In vitro exposure to each of the 4 drugs tested caused a time-dependent activation of apoptotic parameters in ALL cells as assessed by an increase of cells with PS externalization, Δψm depolarization, caspase-3 activation, and PARP inactivation (Figure 2). In only one patient were sufficient cells available to perform an extensive concentration series. The data indicated a concentration-dependent increase in the activity of all apoptotic parameters (data not shown).
Time-dependent drug-induced apoptosis in ALL. Freshly isolated ALL cells were cultured in the presence of 2.0 μg/mL daunorubicin (DNR;  ), 50 μg/mL vincristine (VCR; •), 10 IU/mL l-asparaginase (ASP; ▵), or 250 μg/mL prednisolone (PRED; ♦) for the indicated time points. Drug-induced PS externalization (A), mitochondrial transmembrane disruption (B), caspase-3 activation (C), and PARP inactivation (D) were determined by flow cytometry and calculated by the formula described in “Materials and methods.” Results are expressed as mean ± SD of 5 patients with ALL.
Time-dependent drug-induced apoptosis in ALL. Freshly isolated ALL cells were cultured in the presence of 2.0 μg/mL daunorubicin (DNR;  ), 50 μg/mL vincristine (VCR; •), 10 IU/mL l-asparaginase (ASP; ▵), or 250 μg/mL prednisolone (PRED; ♦) for the indicated time points. Drug-induced PS externalization (A), mitochondrial transmembrane disruption (B), caspase-3 activation (C), and PARP inactivation (D) were determined by flow cytometry and calculated by the formula described in “Materials and methods.” Results are expressed as mean ± SD of 5 patients with ALL.
Although exposure to all 4 drugs resulted in activation of similar apoptotic parameters, a difference in apoptosis kinetics was observed. Whereas daunorubicin and vincristine trigger a relatively fast activation of apoptotic parameters, l-asparaginase and prednisolone consistently induced apoptosis more slowly (Figure 2). After 18 hours of daunorubicin or vincristine exposure the mean percentage of cells with PS externalization in the 5 ALL samples is 52% ± 23% and 36% ± 21%, respectively. In contrast, the mean percentage of cells with PS externalization after 18 hours of l-asparaginase and prednisolone exposure was 20% ± 15% and 21% ± 31% compared with 30% ± 18% and 19% ± 19%, respectively, after 42 hours. The 2 types of kinetics could be confirmed in subsequent experiments; the mean percentage of cells with PS externalization in the 50 patients measured in this study after 18 hours of daunorubicin or vincristine treatment are 60% ± 24% and 42% ± 25%, respectively, compared with 31% ± 19% and 30% ± 30% after 42 hours l-asparaginase and prednisolone exposure, respectively. To be able to study the relationship between apoptosis and cellular drug resistance in a large group of patients, activation of apoptotic parameters was measured after 18 hours of incubation with daunorubicin and vincristine and after 42 hours of incubation with l-asparaginase and prednisolone in further experiments.
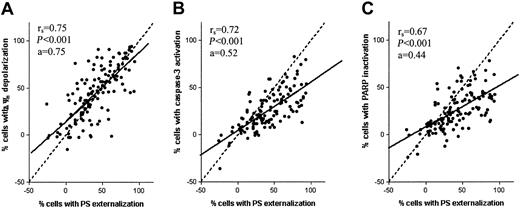
Figure 3 shows that the percentage of cells with PS externalization is proportional to the percentage of cells with reduction in mitochondrial transmembrane potential (rs = 0.75, P < .001), caspase-3 activation (rs = 0.72, P < .001), and the percentage of cells with PARP inactivation (rs = 0.67, P < .001). Significant correlations were also found when analyzing data from each of the 4 drugs separately (Table 1). The slopes of the regression lines in Figure 3A-C are a = 0.75, a = 0.52, and a = 0.44, respectively. The closer the slope of the regression line approaches a = 1.0, the closer the event probably follows after PS externalization. This indicates that upon drug exposure, PS externalization and Δψm depolarization are early events, whereas caspase-3 activation and PARP inactivation are occurring relatively later.
Correlation between drug-induced apoptotic parameters in pediatric ALL. Correlation between the percentage of cells with PS externalization and Δψm depolarization (A), activated caspase-3 (B), or inactivated PARP (C) in leukemic cells in vitro incubated with prednisolone, vincristine, l-asparaginase, or daunorubicin in 50 children with ALL. The dashed line represent the line x = y and the solid line represents the linear regression line.
Correlation between drug-induced apoptotic parameters in pediatric ALL. Correlation between the percentage of cells with PS externalization and Δψm depolarization (A), activated caspase-3 (B), or inactivated PARP (C) in leukemic cells in vitro incubated with prednisolone, vincristine, l-asparaginase, or daunorubicin in 50 children with ALL. The dashed line represent the line x = y and the solid line represents the linear regression line.
Correlation between PS externalization and the downstream apoptotic parameters upon drug exposure in pediatric ALL
Drug . | Δψm depolarization . | Caspase-3 activation . | PARP inactivation . |
|---|---|---|---|
| Prednisolone | |||
| Correlation coefficient | .81 | .76 | .76 |
| P | <.001 | <.001 | <.001 |
| N | 31 | 29 | 29 |
| Vincristine | |||
| Correlation coefficient | .80 | .56 | .64 |
| P | <.001 | <.001 | <.001 |
| N | 30 | 32 | 32 |
| l-asparaginase | |||
| Correlation coefficient | .42 | .49 | .56 |
| P | .017 | .006 | .002 |
| N | 32 | 30 | 29 |
| Daunorubicin | |||
| Correlation coefficient | .63 | .50 | .41 |
| P | <.001 | .005 | .029 |
| N | 29 | 31 | 29 |
Freshly isolated ALL cells were cultured for 18 hours in the presence of 50 μg/mL vincristine or 2.0 μg/mL daunorubicin or 42 hours in the presence of 250 μg/mL prednisolone or 10 IU/mL l-asparaginase. Drug-induced activation of apoptotic parameters was determined by flow cytometry. Correlation between apoptotic parameters was calculated using the Spearman rank correlation test.
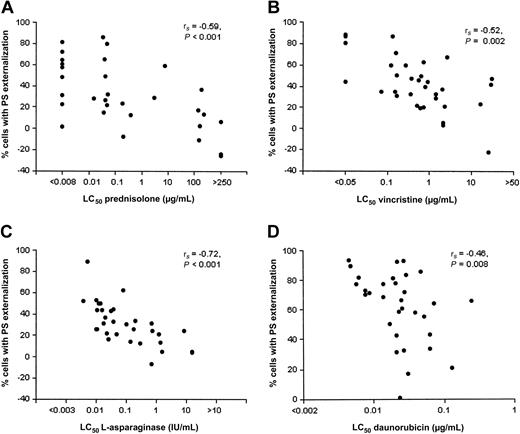
Large interindividual variability in the extent of drug-induced activation of apoptotic parameters was observed between patients. For instance, prednisolone-induced PS externalization after 42 hours ranged between -26% and 86% (median: 27%). Figure 4 and Table 2 show for each individual drug highly significant inverse correlations between the LC50 and (1) the percentage of cells with PS externalization and (2) the percentage of cells with Δψm depolarization. However, caspase-3 activation and PARP inactivation showed a less-consistent inverse correlation pattern with cellular drug resistance. A significant inverse correlation between cellular drug resistance and the percentage of cells with caspase-3 activation was observed for prednisolone (rs = -0.60, P = .001) and l-asparaginase (rs = -0.46, P = .01) but not for vincristine and daunorubicin. Likewise, PARP inactivation was inversely correlated to cellular drug resistance for prednisolone (rs = -0.58, P = .001) and l-asparaginase (rs = -0.58, P = .001) only (Table 2).
Drug-induced apoptosis inversely correlates with cellular drug resistance in pediatric ALL. Freshly isolated ALL cells were incubated in the presence of vincristine (B) or daunorubicin (D) for 18 hours or prednisolone (A) or l-asparaginase (C) for 42 hours at 37°C in a humidified incubator in 5% CO2. See Figure 2 for drug concentrations used. Each dot corresponds to a patient with ALL.
Drug-induced apoptosis inversely correlates with cellular drug resistance in pediatric ALL. Freshly isolated ALL cells were incubated in the presence of vincristine (B) or daunorubicin (D) for 18 hours or prednisolone (A) or l-asparaginase (C) for 42 hours at 37°C in a humidified incubator in 5% CO2. See Figure 2 for drug concentrations used. Each dot corresponds to a patient with ALL.
Inverse correlation between cellular drug resistance and the activation of parameters along the effector route of apoptosis in pediatric ALL
Apoptotic parameter . | LC50 prednisolone . | LC50 vincristine . | LC50l-asparaginase . | LC50 daunorubicin . |
|---|---|---|---|---|
| PS externalization | ||||
| Correlation coefficient | −.59 | −.52 | −.72 | −.46 |
| P | <.001 | .002 | <.001 | .008 |
| N | 32 | 33 | 32 | 32 |
| ΔΨm depolarization | ||||
| Correlation coefficient | −.43 | −.45 | −.45 | −.54 |
| P | .016 | .014 | .010 | .002 |
| N | 31 | 30 | 32 | 29 |
| Caspase-3 activation | ||||
| Correlation coefficient | −.60 | −.28 | −.46 | −.27 |
| P | .001 | .118 | .011 | .146 |
| N | 29 | 32 | 30 | 31 |
| PARP inactivation | ||||
| Correlation coefficient | −.58 | −.34 | −.58 | −.27 |
| P | .001 | .059 | .001 | .160 |
| N | 29 | 32 | 29 | 29 |
See legend of Table 1.
Discussion
Cellular drug resistance may reflect disruptions in the apoptotic route.17-24 Low caspase-3 activity has been previously linked to a poor prognosis in adult chronic myelogenous leukemia (CML)28 and high levels of caspase-3 with improved survival in adult acute myeloid leukemia (AML).29 In addition, loss of spontaneous caspase-3 activation in vivo is associated with relapse in adults with ALL.30 However, the presence and clinical significance of these disruptions in the apoptotic route have not been studied well in pediatric ALL. In the present study, we have analyzed drug-induced activation of apoptotic parameters in leukemic cells taken at initial diagnosis of ALL. PS externalization, Δψm disruption, caspase-3 activation, and PARP inactivation were measured after in vitro exposure to 4 cytotoxic drugs that form the backbone of ALL therapy: prednisolone, vincristine, l-asparaginase, and daunorubicin.
Time series experiments showed a fast activation of apoptotic parameters for daunorubicin and vincristine and a slower activation for l-asparaginase and prednisolone (Figure 2). One may speculate that this reflects differences in primary cellular targets of the different drugs. Hypothetically, a cell is likely to respond quickly to the direct damaging effect of daunorubicin and vincristine treatment, that is, DNA damage and microtubule damage, respectively. In contrast, it may take a cell relatively longer to respond to the indirect effects of l-asparaginase and prednisolone treatment, that is, induction of gene expression or depletion of the intracellular stock of the amino acid asparagine.
Our data suggest that PS externalization and disruption of Δψm are both early features of apoptosis induced by 4 structurally unrelated drugs in childhood ALL (Figures 2-3). The spread of data points around the line x = y in Figure 3 indicates that in half of the patients, disruption of Δψm appears to precede PS externalization (dots above the line x = y). However, in the other half of the patients, disruption of Δψm follows or coincides with PS externalization. No consensus is reached in literature concerning the sequence of these 2 apoptotic events. Conflicting reports have been published showing that disruption of Δψm either preceded or coincided with or followed PS externalization.31-34 An explanation for this phenomenon is proposed by Denecker et al,33 who suggest that both Δψm disruption and PS externalization are not necessarily 2 dependent but rather parallel events initiated after an apoptotic stimulus. Consequently, the sequence of these 2 apoptotic events may be cell type-, stimulus-, and apparently also patient-specific.
The present data show that resistance of leukemic cells to each of 4 unrelated drugs is associated with decreased PS externalization and Δψm depolarization compared with sensitive cells. Caspase-3 activation or PARP inactivation was linked to cellular resistance to prednisolone and l-asparaginase, but not with cellular resistance toward vincristine and daunorubicin (Table 2). A possible explanation for this observation is that caspase-3 and PARP cleavage may be an epiphenomenon, which is not essential for vincristine- and daunorubicin-induced apoptosis. Multiple caspases, which are redundant in function, are expressed in acute leukemic cells.35 Possibly, in case of vincristine- and daunorubicin-induced apoptosis, a caspase other than caspase-3 may function as the main effector caspase in primary ALL cells.
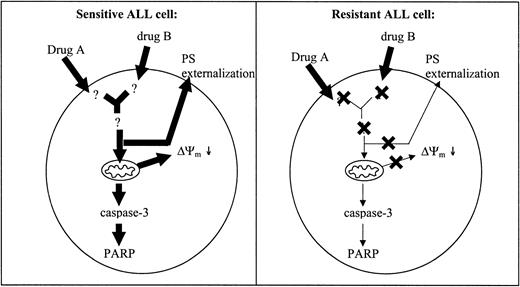
We found that cellular drug resistance is associated with decreased PS externalization and Δψm depolarization compared with sensitive cells. Decreased activation of these apoptotic parameters is likely to result from a defect upstream or at the level of both PS externalization and disruption of Δψm (Figure 5). Aberrations in the expression of various molecules associated with cellular drug resistance in mainly adult leukemia and cell lines have been described in literature.36-49 Treatment with chemotherapeutic drugs increases intracellular ceramide levels.36 Significantly reduced ceramide levels have been linked to drug resistance in adult patients with ALL, CML, and AML.37 Deficient up-regulation of CD95 ligand and down-regulation of CD95 receptor expression has been shown to confer drug resistance in leukemic cell lines.6,38 Aberrant expression of both anti- and proapoptotic Bcl-2 family members is known to prevent mitochondrial permeability transition pore opening and release of apoptogenic proteins from mitochondria.39 Data regarding the role of the expression levels of Bcl-2 family members and clinical outcome in ALL are contradictory.40-43 Overexpression of the p53 regulator MDM2 has been associated with early relapse, adriamycin resistance, and failure to respond to reinduction therapy in childhood leukemia.44 In addition, constitutive activation of antiapoptotic proteins such as both Akt/PKB45 and c-Raf46 as well as inactivation of the proapoptotic protein PTEN47 have been linked to drug resistance in various types of cancers. Other proteins whose overexpression is associated with resistance to apoptosis in acute leukemia are members of the heat shock protein family, including Hsp2748 and Hsp70.49 To find out (1) which molecules play an actual role in cellular drug resistance in children with ALL and (2) whether resistance to different drugs is associated with drug-specific defects, we currently perform gene expression studies using high-density oligonucleotide microarrays.
Impaired apoptosis in resistant compared with sensitive ALL cells. A defect localized upstream of the mitochondria may lead to decreased activation of downstream apoptotic parameters in resistant patients with ALL. Potential sites of defects are indicated with a cross. Decreased activation of apoptotic parameters is illustrated by the decreased size of the arrows in resistant compared with sensitive patients.
Impaired apoptosis in resistant compared with sensitive ALL cells. A defect localized upstream of the mitochondria may lead to decreased activation of downstream apoptotic parameters in resistant patients with ALL. Potential sites of defects are indicated with a cross. Decreased activation of apoptotic parameters is illustrated by the decreased size of the arrows in resistant compared with sensitive patients.
In conclusion, the present study shows that decreased PS externalization and Δψm depolarization are found in children with ALL who are in vitro-resistant to structurally unrelated drugs. These data suggest that cellular resistance to these drugs is caused by defects upstream or at the level of mitochondrial function. Caspase-3 activation and PARP inactivation are suggested to play a role in prednisolone- and l-asparaginase-induced apoptosis, but are not essential to vincristine- and daunorubicin-induced apoptosis. The nature of the defects upstream or at the level of PS externalization and Δψm depolarization in resistant cells of children with ALL are not elucidated and will be the subjects of further research.
Prepublished online as Blood First Edition Paper, August 14, 2003; DOI 10.1182/blood-2002-11-3612.
The publication costs of this article were defrayed in part by page charge payment. Therefore, and solely to indicate this fact, this article is hereby marked “advertisement” in accordance with 18 U.S.C. section 1734.
All hospitals involved in the COALL study are gratefully acknowledged for the supply of bone marrow and peripheral blood samples from patients with ALL.

This feature is available to Subscribers Only
Sign In or Create an Account Close Modal