Abstract
Alas2 encodes the erythroid-specific δ-aminolevulinate synthase (ALAS2 or ALAS-E), the first enzyme in heme biosynthesis in erythroid cells. Mice with theAlas2-null phenotype showed massive cytoplasmic, but not mitochondrial, iron accumulation in their primitive erythroblasts. Because these animals died by day 11.5 in utero, studies of iron metabolism in definitive erythroblasts were not possible using the in vivo model. In this study, embryonic stem (ES) cells lacking theAlas2 gene were induced to undergo differentiation to the definitive erythroblast stage in culture, and the phenotype ofAlas2-null definitive erythroblasts was examined.Alas2-null definitive erythroblasts cell pellets were entirely colorless due to a marked deficiency of heme, although their cell morphology was similar to that of the wild-type erythroblasts. The level of expression of erythroid-specific genes inAlas2-null definitive erythroblasts was also similar to that of the wild-type erythroblasts. These findings indicate thatAlas2-null definitive erythroblasts developed to a stage similar to that of the wild-type erythroblasts, which were also shown to be very similar to the bone marrow erythroblasts in vivo. In contrast, Alas2-null definitive erythroblasts contained 15 times more nonheme iron than did the wild-type erythroblasts, and electron microscopy found this iron to be distributed in the cytoplasm but not in mitochondria. Consistent with the aberrant increase in iron,Alas2-null definitive erythroblasts were more peroxidized than wild-type erythroblasts. These findings suggest that ALAS2 deficiency itself does not interfere with the development of definitive erythroid cells, but it results in a profound iron accumulation and a peroxidized state in erythroblasts.
Introduction
Heme, the prosthetic group of hemeproteins, is essential for the function of all aerobic cells. Approximately 85% of heme in the body is synthesized by erythroid cells and utilized for hemoglobin formation.1 Besides its main function as an oxygen carrier in the hemoglobin molecule, heme also plays an important role in erythroid cellular development, and its deficiency has been associated with dysregulation of protein synthesis,2apoptosis of cells,3 and X-linked sideroblastic anemia (XLSA).4-7
The erythroid-specific δ-aminolevulinate synthase, ALAS2 (or ALAS-E), is the first enzyme in the heme biosynthetic pathway and is exclusively expressed in erythroid cells.8,9 In human beings, various mutations of the ALAS2 gene, which is located at Xp11.21, have been reported in patients with XLSA, an X chromosome–linked hypochromic and microcytic anemia characterized by the presence of ring sideroblasts in bone marrow.4-7 It is thought that ALAS2 deficiency in patients with XLSA results in a decreased supply of protoporphyrin IX, which in turn causes an excessive accumulation of iron in erythroblasts, ultimately resulting in the formation of ring sideroblasts. Such an iron overload is likely to disturb cellular reduction-oxidation state and may result in the shortening of the cellular lifetime. These findings point to the critical role of ALAS2 in the cellular differentiation and survival of erythroid cells. In our previous in vivo study of mice with ALAS2 deficiency, we found a maturation arrest and a massive iron accumulation in Alas2-null primitive erythroid cells.10 This iron accumulation was observed exclusively in the cytoplasm, and not in mitochondria, which is the typical site of iron accumulation in patients with XLSA. These mice died by day 11.5 in utero; therefore, studies on iron metabolism in erythroblasts at a later stage, such as definitive erythroblasts, were not possible, and it remained unclear whether the absence of sideroblasts in mice was due to the fact that only the primitive erythroblasts were examined10 or other reasons.
In this study, we prepared Alas2-null definitive erythroblasts from Alas2-null embryonic stem (ES) cells in culture and compared their characteristics with those of the wild-type definitive erythroblasts and of mature bone marrow erythroblasts isolated from mice. Our results demonstrate that ALAS2 deficiency leads to excessive iron accumulation in the cytoplasm of definitive erythroblasts, similar to the finding inAlas2-null primitive erythroblasts.10 These findings are, however, in contrast to the mitochondrial iron accumulation seen in bone marrow erythroblasts of patients with XLSA.
Materials and methods
Cell culture, sorting, and transmission electron microscopy
Alas2-null ES cells10 and the wild-type ES cells were cultivated with OP9, a macrophage colony-stimulating factor (M-CSF)–deficient mouse stromal cell line, and were induced to undergo erythroid differentiation as described previously, with only minor modifications.11 Namely, ES cells were plated onto confluent OP9 cells at a concentration of 5 × 10³ cells per well in a 6-well plate using minimum essential medium alpha medium (α-MEM; Gibco BRL, Grand Island, NY) supplemented with 20 μM β-mercaptoethanol, 2 U/mL human erythropoietin, 50 ng/mL murine stem cell factor (SCF) (Gibco Lifetec Oriental, Rockville, MD), and 10 ng/mL vascular endothelial growth factor (VEGF) (Peprotech, Rocky Hill, NJ). Human erythropoietin was kindly provided by Chugai Pharmaceutical, Tokyo, Japan. On day 3 of culture, one half volume of the culture media was replenished with fresh medium, and incubation was continued to day 5 when total cells were harvested by trypsinization. They were transferred to a P100 culture dish, which had been covered with confluently grown OP9 cells, and incubated in the same culture media but without VEGF. Primitive erythroblasts were collected by harvesting all floating cells by centrifugation on day 8. To collect definitive erythroblasts, total cells collected on day 10 by pipetting were transferred to a new OP9 cell–plated culture dish, and then the incubation was continued to day 14 when all floating cells were collected. TER119+ bone marrow erythroid cells were isolated from the normal mouse bone marrow and sorted by using a magnetic cell sorting system (MACS; Miltenyi Biotec, Gladbach, Germany). Transmission electron microscopy (TEM) was performed using H-7600 Transmission Electron Scope (Horiba, Kyoto, Japan) as described previously.10
Reverse-transcriptase polymerase chain reaction (RT-PCR)
Total RNA was extracted from cells by the guanidine-phenol method.12 Complementary DNA was synthesized from 2 μg total RNA in 20 μL of the reaction mixture containing 0.5 μg oligo(dT)12-18, 200 units of Moloney murine leukemia virus reverse transcriptase (SuperscriptTMII, Gibco, Gaithersburg, MD), 20 mM Tris (tris(hydroxymethyl)aminomethane) HCl (pH 9.4), 50 mM KCl, 2.5 mM MgCl2, 0.5 mM of each deoxyribonucleoside triphosphate (dNTP), and 10 mM dithiothreitol (DTT). Target genes were then amplified by PCR with a set of specific primers using 1 μL cDNA solution as a template. PCR was performed using an appropriate number of cycles for amplification where the linearity had been verified. Durations for denaturation, annealing, and extension were 1 minute each except for ALAS1, for which 20 seconds, 5 seconds, and 1 minute were used for those processes, respectively. Temperature for denaturation and extension were 94°C and 72°C, respectively, for all PCRs. Temperature for annealing was 60°C for ALAS1 and β-actin and 56°C for other genes. Sequences of each primer used are as follows: ALAS1 sense: 5′-CATCTTCACCACCTCCTTGCCACCA, antisense: 5′-CTATGTGGGTATGGTAATGGCCTGGG; ALAS2 sense: 5′-GATCCAAGGCATTCGCAACA, antisense: 5′-GATGGCCTGCACATAGATGC; β-actin sense: 5′-GTGACGAGGCCCAGAGCAAG, antisense: 5′-AGGGGCCGGACTCATCGTAC; β-major globin sense: 5′-ATGGTGCACCTGACTGATGCTG, antisense: 5′-GGTTTAGTGGTACTTGTGAGCC; DMT1 sense: 5′-GGTTCTGACATGCAGGAAGT, antisense: 5′-CAAAGACATTGATGATGAAG; εy globin sense: 5′-AACCCTCATCAATGGCCTGTGG, antisense: 5′-TCAGTGGTACTTGTGGGACAGC; GATA-1 sense: 5′-ACTCGTCATACCACTAAGGT, antisense: 5′-AGTGTCTGTAGGCCTCAGCT; HO-1 sense: 5′-ACGCAT- ATACCCGCTACCTG, antisense: 5′-AAGCTGAGAGTGAGGACCCA; NF-E2 sense: 5′-AACTTGCCGGTAGATGACTTTAAT, antisense: 5′-CACCAAATACTCCCAGGTGATATG.
Flow cytometric analysis
Floating cells collected on day 8 and day 14 were incubated with TER119 (Pharmingen, San Diego, CA), an antibody against the mature erythroid-specific antigen,13 and anti-CD71, an antibody for transferrin receptor (Caltag, Burlingame, CA). For apoptosis analysis, floating cells harvested on day 14 were incubated with annexin V and propidium iodide (PI), according to the manufacturer's protocol (MBL, Nagoya, Japan). Flow cytometric analysis was performed using FACSCalibur (Becton Dickinson, Lincoln Park, NJ).
Heme assay
Heme content was determined fluorometrically using 105 cells per assay as described previously.14All determinations were made in triplicates, and heme contents were expressed as picomoles per 106 cells.
Iron content
Cells were dissolved in nitric acid, and iron content in the solution was determined by atomic absorption spectrometry using Z-5010 type polarized Zeeman Atomic Absorption Spectrometer (Hitachi High Technology, Hitachinaka, Japan).10
Measurement of intracellular reactive oxygen intermediates
Redox state of cells was determined as described previously15 but in the absence of H2O2 in the assay mixture. 2′,7-dichlorodihydrofluorescein (DCFHDA, Sigma, St Louis, MO) was used as a fluorogenic substrate for an oxidation reaction with cells. The intensity of fluorescence corresponds to the amount of cellular peroxidized substances. Bone marrow cells and floating cells harvested on day 14 from culture were washed in phosphate-buffered saline (PBS) and first reacted with phycoerythrin (PE)–conjugated TER119 for 15 minutes. After washing with PBS, cells were incubated with 10 μM DCFHDA in PBS containing 2% fetal bovine serum (FBS) for 30 minutes at room temperature. Fluorescence generated by the cellular oxidation of DCFHDA was determined by flow cytometry.
Immunostaining
Immunostaining for hemoglobin was performed as described previously.16 Briefly, floating cells harvested on day 8 and day 14 were centrifuged using Cytospin 3 (Shandon, Pittsburgh, PA). After fixation in acetone-methanol, cells were incubated with rabbit antimouse β-major globin antibody (Research Plus, Bayonne, NJ) or rabbit antimouse εy globin antibody17 at 4°C for overnight and then incubated with horseradish peroxidase (HRP)–conjugated goat antirabbit antibody at 4°C for 6 hours. Positive signals were visualized by incubation with diaminobenzidine (DAB).
Results
Morphology of Alas2-null erythroblasts
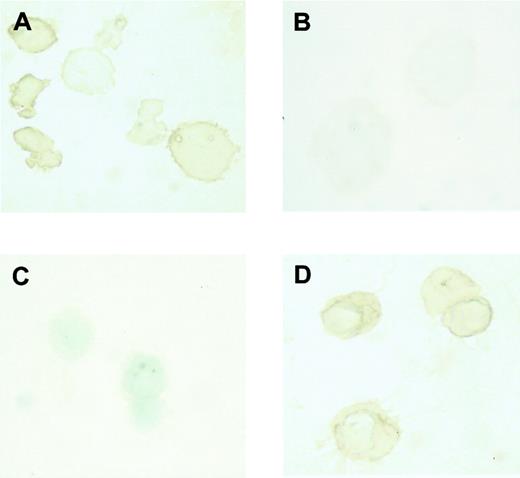
The type of globin expressed in erythroblasts collected on day 8 and day 14 was examined by immunostaining. It was found that β-major globin, an adult globin, was expressed in erythroblasts harvested on day 14 (Figure 1D), while εy globin, an embryonic globin, was expressed in erythroblasts harvested on day 8 (Figure 1A). Conversely, β-major globin was not detected in erythroblasts harvested on day 8 (Figure 1B), while εy globin was not detected in erythroblasts harvested on day 14 (Figure 1C). These findings indicate that the erythroblasts harvested on day 8 and on day 14 did indeed correspond to primitive and definitive erythroblasts, respectively.
Expression of embryonic and adult globin in erythroblasts derived from ES cells in vitro.
Immunostaining of εy and β-major globin was described in “Materials and methods.” (A) Incubation of day 8 erythroblasts with rabbit antimouse εy globin. (B) Incubation of day 8 erythroblasts with rabbit antimouse β-major globin. (C) Incubation of day 14 erythroblasts with rabbit antimouse εy globin. (D) Incubation of day 14 erythroblasts with rabbit antimouse β-major globin. Original magnification × 1000.
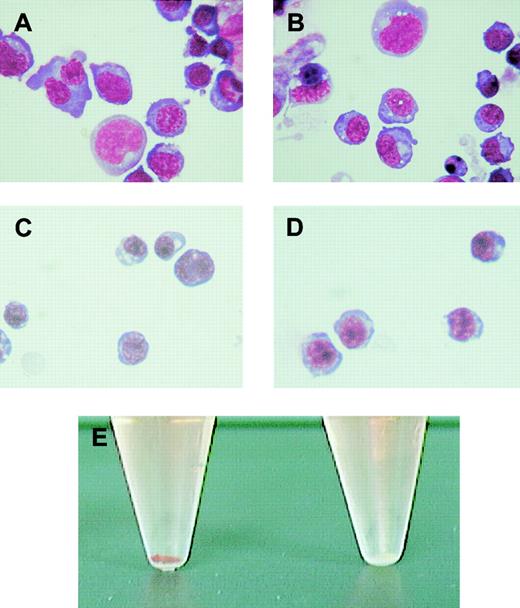
Morphologic examination of these cells was performed using May-Grünwald Giemsa stain. The wild-type (Figure2A) and Alas2-null primitive erythroblasts (Figure 2B) were both significantly larger and more basophilic than their corresponding definitive erythroblasts collected on day 14 (Figure 2C and D, respectively). Both Alas2-null and the wild-type definitive erythroblasts were also smaller than normal proerythroblasts in the bone marrow in size, contained denser chromatin (data not shown), and were thus considered to correspond to polychromatophilic or orthochromatophilic erythroblasts. While the morphology of Alas2-null definitive erythroblasts was similar to that of the wild-type definitive erythroblasts, the cell pellet collected from Alas2-null erythroblasts was entirely colorless (the right tube in Figure 2E).
Morphology of erythroblasts derived from ES cells in vitro.
The wild-type and Alas2-null ES cells were cultured on a feeder layer of OP9 cells, and floating cells on day 8 and day 14 were collected as primitive and definitive erythroblasts, respectively. (A) The wild-type primitive erythroblasts. (B) Alas2-null primitive erythroblasts. (C) The wild-type definitive erythroblasts. (D) Alas2-null definitive erythroblasts. Original magnification, × 400 for panels A-D. (E) Cell pellet of the wild-type (left, red) and Alas2-null (right, white) definitive erythroblasts.
Heme content in these cells, determined by fluorometry, was 1620 ± 45 pmol/106 cells and 120 ± 15 pmol/106 cells for the wild-type and Alas2-null definitive erythroblasts, respectively (P < .001, n = 3). Interestingly, the heme content of the wild-type erythroblasts collected from culture was only slightly less than that of TER119+ erythroid cells isolated from normal mouse bone marrow (2430 ± 114 pmol/106 cells), indicating that the wild-type definitive erythroblasts differentiated to a stage very close to the mature erythroblasts in the bone marrow.
Next, iron content was determined by atomic absorption spectrometry. In contrast to heme content, Alas2-null definitive erythroblasts contained a significantly larger amount of iron (6946 ± 200 pmol/106 cells, n = 3) than the wild-type definitive erythroblasts cells (2053 ± 200 pmol/106cells, n = 3) (P < .001). Thus, the nonheme iron amounts, calculated on the basis of total iron and heme content, were 433 pmol/106 cells and 6826 pmol/106 cells for the wild-type and Alas2-null erythroblasts, respectively. Hence, the nonheme iron content in Alas2-null erythroblasts was nearly 16-fold that of wild-type erythroblasts and accounted for most of the total iron content in the cell. Total and nonheme iron content in TER119+ bone marrow erythroid cells was 3210 pmol/106 cells and 780 pmol/106 cells, respectively. These findings indicate that Alas2-null definitive erythroblasts had accumulated an excessive amount of nonheme iron in the cell and were markedly deficient in heme.
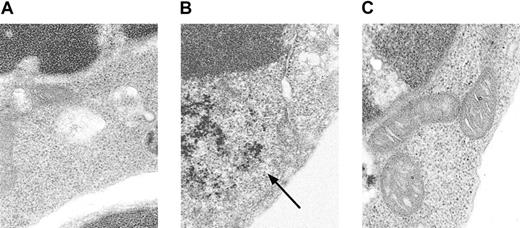
Conventional Prussian blue staining for iron did not detect an increase in iron in Alas2-null definitive erythroblasts (data not shown). When TEM, a more sensitive technique than the conventional iron staining, was used for examination of cellular iron, it was found that there was a diffuse accumulation of ferritin iron in the cytoplasm (Figure 3B), but not in mitochondria (Figure 3C), in Alas2-null definitive erythroblasts, as compared with the wild-type definitive erythroblasts (Figure 3A).
Electron microscopic analysis of
Alas2-null definitive erythroblasts. The wild-type and Alas2-null definitive erythroblasts were examined by TEM. (A) The wild-type definitive erythroblasts. (B)Alas2-null definitive erythroblasts (ferritin aggregates indicated by an arrow). (C) Alas2-null definitive erythroblasts (no iron granules in mitochondria). The original magnification was × 50 000 for all panels.
Expression of erythroid-specific genes or genes involved in iron metabolism
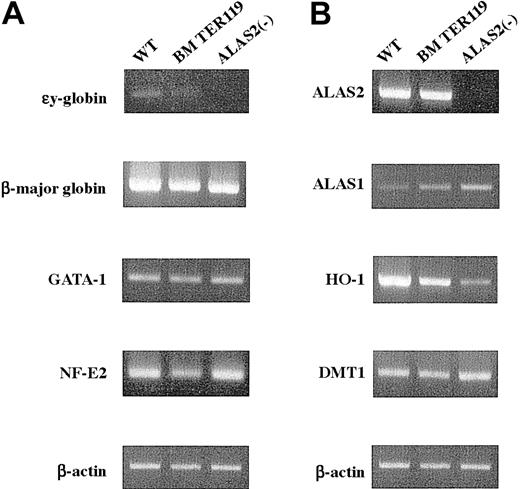
Next, the level of expression of erythroid-specific genes was examined by RT-PCR. The εy globin mRNA was virtually absent in TER119+ erythroblasts from bone marrow and inAlas2-null definitive erythroblasts, while it was barely detected in the wild-type definitive erythroblasts (Figure4A). Its level was, however, markedly lower than that in primitive erythroblasts (data not shown). Similar amounts of β-major globin mRNA were expressed both inAlas2-null and the wild-type definitive erythroblasts as well as in TER119+ bone marrow erythroid cells (Figure 4A). The levels of GATA-1 and NF-E2 mRNA were similar for bothAlas2-null and the wild-type definitive erythroblasts (Figure 4A) and comparable to GATA-1 and NF-E2 mRNA levels observed in TER119+ bone marrow erythroid cells (Figure 4A), suggesting that both Alas2-null and the wild-type definitive erythroblasts had been fully differentiated to a stage comparable to mature bone marrow erythroblasts.
Expression of erythroid-specific genes and genes involved in heme biosynthesis and catabolism.
Total RNA was extracted from the wild-type and Alas2-null definitive erythroblasts or TER119+ bone marrow erythroid cells, and 2 μg total RNA was reverse transcribed. Then, target genes were amplified by PCR with a set of specific primers using 1 μL cDNA solution as a template. (A) Erythroid-specific genes. (B) Genes involved in heme biosynthesis, catabolism, and iron metabolism. Although the Alas2 gene is both an erythroid-specific and a heme pathway gene, its expression is shown in panel B.
Heme and iron metabolism in Alas2-null definitive erythroblasts
In addition to the erythroid-specific genes, expression of genes involved in heme synthesis and iron metabolism was also examined. ALAS2 mRNA was expressed both in the wild-type definitive erythroblasts and in TER119+ bone marrow erythroblasts, and their levels were very similar (Figure 4B). ALAS2 mRNA was not detectable inAlas2-null erythroblasts, reflecting the fact that exons 8 through 10 of the Alas2 gene had been replaced by a neomycin-resistant cassette that abolished amplification, because primersanneal to exon 7 and exon 10 (Figure 4B).18Interestingly, ALAS1 mRNA was markedly increased inAlas2-null definitive erythroblasts, while the level was decreased in the wild-type definitive erythroblasts, compared with that in TER119+ bone marrow erythroid cells (Figure4B). An elevated expression of ALAS1 mRNA had also been observed in Alas2-null primitive erythroblasts (data not shown). In contrast, HO-1 mRNA, which encodes the rate-limiting enzyme in the heme catabolic pathway and is known to be inducible by heme, was markedly expressed in the wild-type definitive erythroblasts compared with Alas2-null definitive erythroblasts (Figure 4B), suggesting a heme-mediated induction of HO-1. The level of HO-1 mRNA in the wild-type definitive erythroblasts collected from culture was also higher than that in TER119+ bone marrow erythroid cells. Because HO-1 is a stress-responsive gene and is known to respond to various oxidative stimuli,19 this finding may reflect a more highly oxidized condition in the erythroblasts that were collected from culture compared with those that were isolated from the bone marrow of normal mice. In contrast to the rate-limiting enzymes in heme synthesis and catabolism, the level of mRNA for DMT1, an iron transporter, was similar for both Alas2-null and the wild-type definitive erythroblasts (Figure 4B).
Expression of TER119 and transferrin receptor inAlas2-null definitive erythroblasts
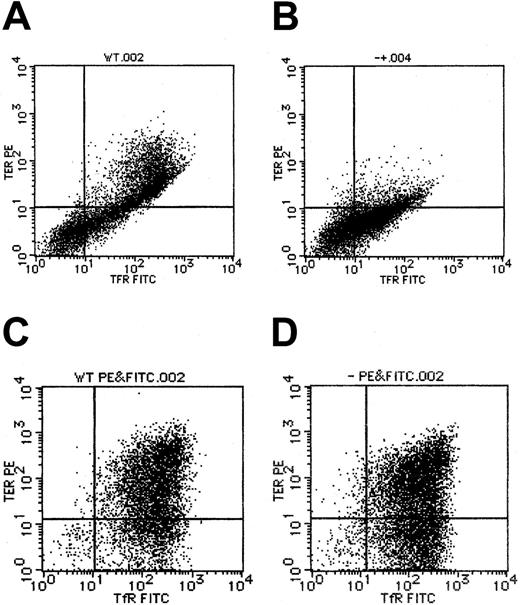
By flow cytometry, TER119, a marker for erythroblasts that have differentiated to the erythroid colony-forming unit (CFU-E) stage and beyond CFU-E, was also found to be expressed inAlas2-null definitive erythroblasts (Figure5D), at a level similar to that in the wild-type definitive erythroblasts (Figure 5C). This situation was quite different from that in primitive erythroblasts in that TER119 expression was suppressed in Alas2-null primitive erythroblasts (Figure 5B), as compared with the wild-type primitive erythroblasts (Figure 5A), but consistent with the findings in primitive erythroblasts from Alas2-targeted mice in vivo.10 Similar to TER119 expression, transferrin receptor expression levels were similar between the wild-type andAlas2-null definitive erythroblasts (Figure 5C and D, respectively) and lower in Alas2-null primitive erythroblasts than in wild-type primitive erythroblasts (Figure 5B and A, respectively). These findings suggest that while ALAS2 deficiency results in a maturation arrest in primitive erythropoiesis, it does not interfere with the normal development of definitive erythropoiesis.
Expression of TER119 and transferrin receptor in ES-derived erythroblasts.
Flow cytometry for TER119 and transferrin receptor expression was described in “Materials and methods.” (A) The wild-type primitive erythroblasts. (B) Alas2-null primitive erythroblasts. (C) The wild-type definitive erythroblasts. (D) Alas2-null definitive erythroblasts. TER119 expression is shown on the ordinate (y-axis), while transferrin receptor expression is shown on the abscissa (x-axis).
Redox status of Alas2-null erythroblasts
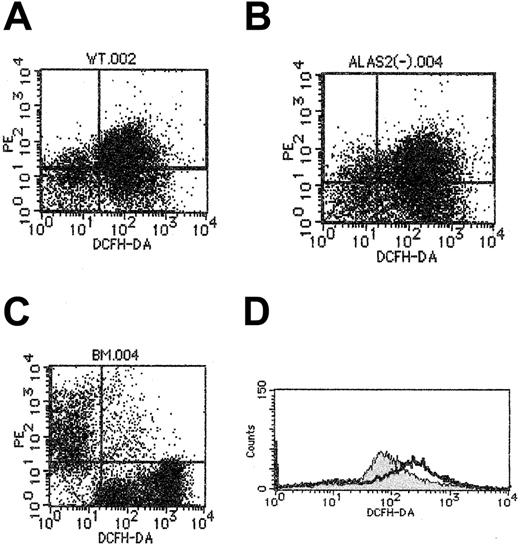
Because iron is known to facilitate peroxidation of lipids in the cell membrane,20Alas2-null definitive erythroblasts may be more oxidized than the wild-type definitive erythroblasts. We examined the oxidation-reduction state of wild-type and Alas2-null definitive erythroblasts harvested on day 14, as well as TER119+ bone marrow erythroid cells, using flow cytometry with DCFHDA as the fluorogenic substrate. As shown in Figure6, the fluorescence intensity, indicating the oxidation of DCFHDA following incubation with cells, was higher inAlas2-null definitive erythroblasts than in wild-type definitive erythroblasts. The fluorescence intensity in TER119+ bone marrow erythroid cells was much lower than in wild-type definitive erythroblasts (Figure 6C), suggesting that erythroblasts collected from culture are significantly more oxidized than mature erythroblasts isolated from bone marrow of live animals.
Redox state analysis of definitive erythroblasts derived from ES cells.
Redox state of cells was assayed as described in “Materials and methods,” using DCFHDA as a fluorogenic substrate, but in the absence of H2O2, and cellular fluorescence intensity was examined by flow cytometry. (A) The wild-type definitive erythroblasts. (B) Alas2-null definitive erythroblasts. (C) Mouse bone marrow cells. TER119 fluorescence is shown on the ordinate (y-axis), while DCFHDA-mediated fluorescence is shown on the abscissa (x-axis). Note in the bone marrow TER119+ cells (C), cell population at the upper left exhibited a significantly lower level of DCFHDA fluorescence than the wild-type (A) andAlas2-null definitive erythroblasts (B). (D) Histogram of DCFHDA-mediated fluorescence: the wild-type definitive erythroblasts (filled curve); Alas2-null definitive erythroblasts (open curve). The open curve was shifted more to the right than the filled curve, suggesting that Alas2-null definitive erythroblasts are more peroxidized than the wild-type definitive erythroblasts.
Finally, to study the effect of such an oxidized status on cell aging, an apoptosis assay was performed by flow cytometry using annexin V as a marker for apoptosis. A significant fraction of bothAlas2-null and the wild-type definitive erythroblasts was found to be apoptotic, presumably reflecting the fact that they have completed cell differentiation, as indicated by their floating nature off from the OP9 feeder layer. This finding also suggests that bothAlas2-null and the wild-type definitive erythroblasts collected on day 14 in culture were so peroxidized that they could not be differentiated from each other.
Discussion
Various mutations of the Alas2 gene have been reported in patients with XLSA and are thought to be responsible for the development of hypochromic anemia with ring sideroblasts. Most of these mutations were found in the catalytic domain of the ALAS2 protein and suggest that functional ALAS deficiency is responsible for the development of XLSA.4-7 Our previous study inAlas2-targeted mice provided the experimental proof that ALAS2 deficiency in fact results in abnormal iron accumulation in primitive erythroblasts in vivo.10 However, the iron accumulation in these cells was diffusely distributed in the cytoplasm10 and was quite distinct from the mitochondrial iron accumulation, known as ring sideroblasts, seen in patients with XLSA. Because Alas2-null mice died by embryonic day 11.5 before definitive erythropoiesis developed, it was not possible to examine the iron status in definitive erythroblasts.
To examine iron metabolism in definitive erythroblasts, we preparedAlas2-null definitive erythroblasts from ES cells using an in vitro differentiation system with OP9 stromal cells.11ES cells were allowed to differentiate to a stage comparable to definitive erythroblasts, as judged by morphologic and gene expression studies. Namely, the wild-type ES cells, which were differentiated to the erythroid lineage for 8 days and 14 days in culture, produced floating cells that corresponded to primitive and definitive erythroblasts, respectively, as judged by the presence of εy and β-major hemoglobin (Figure 1A,D). Alas2-null definitive erythroblasts also differentiated to a stage similar to the wild-type cells, as judged by their similar morphology and similar expression of erythroid-specific genes (Figure 4A). In contrast, the color of cell pellets of Alas2-null definitive erythroblasts was white, suggesting a major lack of heme, while the color of cell pellets of the wild-type definitive erythroblasts was intensely red, indicating active hemoglobin synthesis (Figure 2E). This finding was confirmed by chemical quantification of cellular heme by fluorometry, which demonstrated that Alas2-null definitive erythroblasts contained less than 10% heme found in the wild-type definitive erythroblasts. Conversely, the total iron content of theAlas2-null definitive erythroblasts was more than 3-fold compared with that of wild-type erythroblasts. The increase in total iron content was largely accounted for by a marked increase in nonheme iron content that was about 16-fold higher in Alas2-null definitive erythroblasts than in the wild-type definitive erythroblasts. These findings clearly establish the fact that ALAS2 deficiency results in aberrant iron accumulation both in primitive10 and definitive erythropoiesis.
An important difference in the findings between mice and human patients with XLSA should be noted. Namely, no ring sideroblasts were found in the mouse models of ALAS2 deficiency in culture, while ring sideroblasts are the cytologic hallmark of XLSA in human beings. The reason for the observed discrepancy remains unclear, but several possibilities can be speculated. First, mice with ALAS2 deficiency may not be as prone to form sideroblasts as do human patients with XLSA. However, this is unlikely because transient siderocyte formation with mitochondrial iron deposits has been reported in flexed-tail (f/f) mice.21Secondly, the lack of sideroblasts in culture might reflect a limitation inherent in the tissue culture method that may not allow sideroblast formation. However, there have been occasional reports of successful sideroblast formation in culture from bone marrow cells of patients with primary acquired sideroblastic anemia.22 23Thirdly, the observed difference between Alas2-null definitive erythroblasts and sideroblasts in patients with XLSA might reflect incomplete differentiation of Alas2-null definitive erythroblasts. However, our study showed that Alas2-null definitive erythroblasts developed to a stage comparable to that of normal mature erythroblasts. Fourthly, the red-ox state in cultured cells may be significantly different from that of the normal erythroblasts in the bone marrow. In fact, our findings indicate thatAlas2-null definitive erythroblasts are significantly more perxidized than bone marrow erythroblasts, and this may restrict the development of sideroblasts. Lastly, other factors along with ALAS2 deficiency may be necessary for the development of sideroblasts. This is an intriguing possibility that is currently being explored by culturing definitive erythroblasts that express a low level of ALAS2 activity. Such cells should mimic the condition of the bone marrow erythroblasts in patients with XLSA better than Alas2-null erythroblasts.
It should be noted that ALAS1, the nonspecific form of δ-aminolevulinate synthase, was up-regulated inAlas2-null definitive but down-regulated in the wild-type definitive erythroblasts, as compared with TER119+ mature erythroblasts from bone marrow (Figure 4B). During erythroid differentiation of MEL cells, the level of ALAS1 mRNA has been shown to decline in synchrony with an increase in intracellular heme content, reflecting the well-known feedback repression of ALAS1 by heme.24 Thus, both ALAS1 down-regulation in the wild-type definitive erythroblasts and its up-regulation in Alas2-null definitive erythroblasts appear to be under heme-mediated negative feedback control as in the liver and in MEL cells,25-27and the loss of the feedback repression by heme of ALAS1 inAlas2-null definitive erythroblasts may be a compensatory mechanism for their heme deficiency. However, mature erythroblasts must make an enormous amount of heme for hemoglobin formation, and limited contribution by ALAS1 would be insignificant.
Iron is known to produce reactive oxygen radicals that are highly toxic to cells.28 It has been shown that ferritin iron, if accumulated in excess, can also participate in the generation of reactive oxygen species and cause oxidative tissue damages.29,30 In this study, we found thatAlas2-null definitive erythroblasts were more capable of oxidation of a fluorogenic substrate, DCFHDA, than were the wild-type definitive erythroblasts. It is also known that erythrocytes in patients with sickle cell anemia and thalassemia contain excess amounts of iron and peroxidative lipids in the membrane.31Erythroid cells in patients with XLSA may also be more susceptible to oxidative damages than are normal erythroid cells, and such a mechanism may aggravate anemia. If this is the case, treatment of XLSA with iron-chelating agents and/or antioxidants might be of use and should merit clinical evaluation.
The authors thank Ms C. Suzuki, Ms Y. Nishiyama, Ms K. Sato, Ms K. Kozawa, Ms A. Aizawa, Dr T. Miura, and Dr H. Ohtsu for their technical assistance. We are also grateful to Dr T. Nakano for providing OP9 cells and to Dr A. P. Doke for reviewing the manuscript.
Prepublished online as Blood First Edition Paper, October 3, 2002; DOI 10.1182/blood-2002-01-0309.
Supported in part by Grant-in-Aid from the Ministry of Education, Science and Culture of Japan (H.H.) and by NIH NIDDK grant DK 32890 (S.S.).
The publication costs of this article were defrayed in part by page charge payment. Therefore, and solely to indicate this fact, this article is hereby marked “advertisement” in accordance with 18 U.S.C. section 1734.
References
Author notes
Hideo Harigae, Department of Molecular Diagnostics, Tohoku University School of Medicine, 1-1 Seiryo-machi, Aoba-ku, Sendai 980-8574, Japan; e-mail:harigae@mail.cc.tohoku.ac.jp.

This feature is available to Subscribers Only
Sign In or Create an Account Close Modal