Abstract
Interaction of platelets with collagen under conditions of blood flow is a multi-step process with tethering via glycoprotein IbIXV (GPIbIXV) over von Willebrand factor, adhesion by direct interaction with the integrin GPIaIIa, and signaling via GPVI. GPVI can be specifically agonized by cross-linked collagen-related peptide (CRP-XL), which results in a signaling cascade very similar to that evoked by native collagen. The GPVI gene has 2 common alleles that differ by 3 replacements in the glycosylated stem and 2 in the cytoplasmic domain. We used CRP-XL to elucidate the variation in responses observed in platelet function in different individuals. We observed a 3-fold difference in the response to CRP-XL in platelet aggregation when comparing platelets from 10 high-frequency allele homozygotes with 8 low-frequency ones (2-way analysis of variance [ANOVA], P < .0001). The difference in functional responses was reflected in fibrinogen binding and in downstream signaling events as measured by tyrosine phosphorylation, the expression of P-selectin, and the binding of annexin V and the generation of thrombin on the platelet surface (2-way ANOVA, P < .001). Platelets homozygous for the low-frequency allele tended to be less able to form a thrombus on a collagen surface in flowing whole blood or in the platelet function analyzer–100 (t test, P = .065 and P = .061, respectively). The functional difference was correlated to a difference in total and membrane-expressed GPVI measured by monoclonal and polyclonal antibodies. This study demonstrates for the first time that platelet function may be altered by allelic differences in GPVI.
Introduction
Glycoprotein VI (GPVI) is a 63-kDa type I transmembrane platelet glycoprotein and is the major signaling receptor for collagen on platelets.1,2 Deficiency of GPVI is associated with a bleeding phenotype, a major reduction in the response to collagen in stirred aggregation, and a reduction in thrombus formation on a collagen surface at high shear rate.3,4 The mature GPVI protein consists of 319 amino acids.1,5,6 The 249-residue extracellular domain contains 2 immunoglobulin (Ig)–like C2-type folds attached to a highly glycosylated pericellular stem. The 19–amino acid transmembrane region contains an arginine residue, critical for interaction with the Fc receptor γ (FcR γ) chain with which GPVI forms a functional complex.7,8 The 51–amino acid cytoplasmic domain contains binding sites for calmodulin and Src homology 3 (SH3)–binding proteins.9,10
Previously, we have shown that collagen-related peptide (CRP), a triple-helical peptide containing a 10-fold glycine-proline-hydroxyproline repeat motif, when chemically cross-linked (CRP-XL), activates platelets specifically via GPVI.7,11,12 With CRP-XL, we have observed reduced responses in platelet aggregation with platelets from some individuals. We postulated that these differences may be associated with the presence of the different GPVI alleles.13 To address this question, we produced a high-resolution single nucleotide polymorphism (SNP) map of the GPVI gene by sequencing the exons encoding the mature form of GPVI from 188 different chromosomes. This confirmed the earlier study13 describing 2 common alleles. We term these “a” and “b” and observed frequencies of 0.85 and 0.13, respectively, with the remaining alleles being additional rare alleles (N.A.W. et al, manuscript submitted, 2003). The 2 common alleles differ by 5 amino acid replacements, 3 in the stem (Ser199Pro, Lys217Glu, Thr229Ala) and 2 in the cytoplasmic domain (Gln297Leu and His302Asn), with allele “a” encoding amino acids SKTQH and allele “b” encoding PEALN. Genotyping of 1153 white blood donors for all 5 replacement SNPs identified 28 individuals homozygous for the lowfrequency “b” allele. We compared the level of platelet GPVI expression in donors homozygous for either of the 2 alleles and determined the functional responses to CRP-XL by measuring platelet aggregation, platelet activation (by whole blood flow cytometry), and thrombin generation. In addition, we studied tyrosine phosphorylation of platelet proteins after CRP-XL stimulation. In all assays, significant differences were observed between “a” and “b” homozygous donors. Similar trends were revealed in platelet adhesion to collagen under flow conditions both in a flowing whole blood model and in the platelet function analyzer–100 (PFA-100) analyzer.
Materials and methods
Samples
Samples were obtained from donors at the Cambridge Blood Centre (United Kingdom) who either undergo regular platelet apheresis or donate whole blood. The apheresis donors have platelet counts exceeding 250 × 109/L and are biased toward A and O blood groups. In total, 1153 random donors were genotyped for the GPVI SNPs in order to identify adequate numbers of donors homozygous for each allele (N.A.W. et al, manuscript submitted, 2003). Homozygotes for the high-frequency GPVI allele (encoding amino acids SKTQH) are labeled “aa,” and for the low-frequency allele (encoding amino acids PEALN) “bb.” From these, a study group consisting of 29 (23 male, 6 female) donors, of whom 27 were platelet apheresis donors, was used. These donors were not selected on any basis other than their availability to donate and their GPVI genotype. All experiments were performed on paired (“aa” versus “bb”) samples, freshly drawn with 19-gauge needles. An additional “aa” sample from one donor was used for calibration of the flow cytometry, platelet aggregation, and flow perfusion studies. The project has approval from the local regional ethics committee and is in accordance with the National Blood Service guidance for the use of donor blood for research. All the donors gave written consent, and none of them had used aspirin in the 5 days preceding donation.
SNP testing for GPVI and GPIa (C–52T, T807C) SNPs by TaqMan
Antibodies and other reagents
The following monoclonal antibodies (moAbs) or single-chain variable-domain antibody fragments (scFvs) were used: scFvs 1C3 and 10B12 against GPVI (P.A.S., et al, manuscript submitted, 2002), scFv 2D4 (anti–human leukocyte antigen A2 [anti–HLA-A2]),16 scFv Fog-1 (anti–Rhesus D [anti-RhD]),17 and the murine moAbs NBS-P16 (CD49, anti-GPIaIIa)18 and 9E10 (anti-myc tag).19 Detection of platelet protein tyrosine phosphorylation in Western blots used moAb 4G10 (Upstate Biotechnology, Lake Placid, NY). The binding of scFvs to platelets was carried out as previously described in a 3-step assay using moAb 9E10 and fluorescein isothiocyanate (FITC)–conjugated goat antimouse IgG (Dako, Cambridge, United Kingdom).16 The binding of the murine moAbs was assessed by a 2-step assay.18 Platelet expression of P-selectin (CD62P) and the binding of fibrinogen were measured with a FITC-conjugated anti-CD62P moAb (Pharmingen, Becton Dickinson, San Diego, CA), and a FITC-conjugated polyclonal rabbit antihuman fibrinogen (Dako), respectively. Phosphatidylserine expression on platelets was assessed by the binding of FITC-labeled annexin V (Molecular Probes, Eugene, OR). Phycoerythrin (PE)–labeled anti-CD61 moAb (Pharmingen) was used to gate for platelets. CRP-XL was generated in our laboratory as previously described.20 Adenosine diphosphate (ADP) and GPRP peptide (an inhibitor of fibrin polymerization) was from Sigma Chemical (St Louis, MO). All the buffers for flow cytometry were passed through a 0.22-μm filter. Plasma von Willebrand factor (VWF) and fibrinogen levels were measured as described previously.21
Flow cytometry for GPVI platelet surface expression
Samples were tested for platelet surface expression of GPVI by the platelet immunofluorescence test,16 except that 150-μL test sample was used. For all experiments, antibodies were used at saturating concentrations. The following concentrations were used: scFv 1C3 at 20 μg/mL, scFv 10B12 at 50 μg/mL, scFv 2D4 at 20 μg/mL, moAb NBS-P16 at 1 μg/mL, and moAb 9E10 at 30 μg/mL. The median fluorescence intensities (MFIs) of 10 000 events were analyzed by means of a flow cytometer (Coulter XL; Luton, United Kingdom), calibrated daily with proprietary fluorospheres. The fluorescence for the negative control (moAb 9E10) obtained with each sample was subtracted from that obtained with each test antibody to give the corrected MFI (MFI Corr).
Western blotting for GPVI total expression
Sodium dodecyl sulfate–polyacrylamide gel electrophoresis (SDS-PAGE), Western blotting, and detection was performed as described previously.22 A rabbit polyclonal antiserum raised against recombinant human GPVI (residues 1-185) was used as primary antibody, with donkey antirabbit–horseradish peroxidase (HRP) (Amersham, Little Chalfont, United Kingdom) as secondary. Blots were reprobed with monoclonal anti–β-actin (AbCam) and sheep antimouse-HRP (Amersham).
Platelet aggregation
Platelet-rich plasma (PRP) was prepared from fresh citrate (0.38% wt/vol trisodium citrate) anticoagulated whole blood by centrifuging at 1200 rpm for 12 minutes. PRP was adjusted to a platelet concentration of 200 × 109/L with autologous platelet-poor plasma (PPP) obtained from PRP by centrifugation at 7000 rpm for 10 minutes. Platelet aggregation was determined from light transmission in PRP (250 μL at 200 × 109/L) measured at 37°C in a PAP-4 4-channel aggregometer (Bio/Data, Horsham, PA) over 10 minutes. The results with each treatment were expressed either as the percentage of maximum aggregation (100% transmission) defined with the use of autologous PPP or as the maximum rate of aggregation or “slope” (calculated by the instrument). Platelet aggregation was induced by addition of either CRP-XL (0.01 to 2.0 μg/mL) or ADP (1.25 to 20 μM).
Platelet activation in whole blood with the use of flow cytometry
Whole blood flow cytometry was used to determine platelet activation in whole blood by CRP-XL and ADP.23,24 Citrate (0.38% wt/vol trisodium citrate) anticoagulated whole blood (5 μL) was added to HEPES (N-2-hydroxyethylpiperazine-N′-2-ethanesulfonic acid)–buffered saline (HBS) (145 mM NaCl, 5 mM KCl, 1 mM MgSO4, 10 mM HEPES at pH 7.4; final volume 70 μL) containing PE-labeled anti-CD61, CRP-XL (0.05 to 10 μg/mL) or ADP (1 to 100 μM), and FITC-labeled activation marker. Activation of GPIIbIIIa was determined from the binding of fibrinogen, analyzed with polyclonal rabbit antifibrinogen (2 μL per test). The extent of platelet degranulation was determined from expression of P-selectin with the use of anti-CD62P (10 μL per test). Surface expression of a negatively charged, procoagulant surface on the platelets was measured by the binding of annexin V (5 μL per test). After incubation for 20 minutes at room temperature (RT), the cells were fixed for 10 minutes with 200 μL 0.2% formaldehyde (BDH Laboratory Supplies, Poole, United Kingdom) in 0.9% NaCl. For annexin V staining, the HBS contained 1 mM CaCl2 and GPRP, and the samples were not fixed. Only CD61+ events (5000 to 10 000) were analyzed for a green fluorescence signal. Analysis was as reported before,24 and carried out with software Expo32 (Applied Cytometry Systems, Sheffield, United Kingdom). Data were expressed as the percentage of fluorescence-positive platelets.
Thrombin generation
Thrombin generation, initiated by CRP-XL, was investigated with the use of a modification of the method of Thomas et al (manuscript submitted, 2002). PRP was prepared from 30 mL blood anticoagulated with 15% vol/vol acid-citrate-glucose formula A (ACD-A), (70 mM sodium citrate, 40 mM citric acid, 120 mM D-glucose, pH 5.0) by centrifugation at 1200 rpm for 10 minutes. The PRP was acidified by the addition of 10% vol/vol ACD-A and centrifuged at 3480 rpm for 5 minutes. The platelet pellet was resuspended in defibrinated normal plasma (DNP) to 50 × 106/mL (platelet plasma). DNP was freshly prepared by thawing aliquots of frozen 6-donor–pooled normal plasma at 37°C and defibrinated with 0.5 IU/mL ancrod (1st International Reference Preparation, 74/581, National Institute for Biological Standards and Control [NIBSC], Potters Bar, United Kingdom) for 20 minutes at 37°C. The fibrin was removed, followed by centrifugation at 3480 rpm for 5 minutes. To initiate thrombin generation, we added various concentrations of CRP-XL (at 25 μL) and 100 mM CaCl2 (at 175 μL) to 800 μL platelet plasma, maintained at 37°C by means of heating blocks (Techne, Cambridge, United Kingdom). The final concentrations of CRP-XL ranged from 0 to 5 μg/mL. Every minute, 30 μL platelet plasma incubation mixture was subsampled into the collection buffer (Tris EDTA [tris(hydroxymethyl)aminomethane] [ethylenediaminetetraacetic acid], pH 8.4) on a 96-well microtiter plate. At the end of each 32-minute time course, a chromogenic assay was used to measure the thrombin concentration of the subsamples in collection buffer. The chromogenic substrate S2238 (40 μL of 3 mM) (Chromogenix, Mölndal, Sweden) was added to each well, and after 3 minutes the reaction was stopped with 80 μL 50% acetic acid (Merck, Poole, United Kingdom). The optical density was read at 405 nm with the use of a Thermomax plate reader (Molecular Devices, Menlo Park, CA). The optical density data were converted into thrombin units by means of standard curves prepared with the 1st International Standard for α-thrombin, 89/588 (NIBSC, Potters Bar, United Kingdom). As the biologically inactive thrombin-α2 macroglobulin complex can still cleave this substrate, the data were then analyzed by means of a program that calculates and subtracts the amidolytic activity of this complex.25 The resultant data were used to create a curve of thrombin concentration against time, and the total amount of thrombin generated was quantified by calculation of area under the curve (AUC). The amount of thrombin generated by platelet plasma in the absence of CRP-XL was taken to be 100% for each assay condition. The differences between the time taken in the absence and in the presence of CRP-XL to reach peak thrombin generation (Tmax) was calculated as a ratio, with the shortening of the time represented by a ratio less than 1.0.
Tyrosine phosphorylation of platelet proteins
PRP was prepared from citrate (0.38% wt/vol trisodium citrate) anticoagulated whole blood by centrifugation (1200 rpm, 12 minutes). After addition of 10% vol/vol ACD (39 mM citric acid, 75 mM trisodium citrate, 135 mM D-glucose, pH 4.5) and apyrase (0.25 U/mL), platelets were pelleted (2000 rpm, 12 minutes), followed by washing in 4 mL loading buffer (LB) (145 mM NaCl, 5 mM KCl, 10 mM glucose, 1 mM MgSO4, 0.5 mM EGTA [ethylene glycol tetraacetic acid], 10 mM HEPES, pH 7.36), 10% vol/vol ACD, and apyrase. Platelets were pelleted by centrifugation and resuspended in LB at 5 × 10⁸/mL. Washed platelets were allowed to rest for 1 hour, before stimulation with CRP-XL at the appropriate concentration for the time indicated. Samples were stopped with the use of 2 × Laemmli buffer (130 mM Tris, 69.3 mM SDS, 0.37 mM bromophenol blue, 20% vol/vol glycerol, 10% vol/vol 2-mercaptoethanol, pH 6.8) and boiled for 5 minutes. Washed platelets for the maximum and basal standard samples were prepared from platelet concentrates as described previously.22 The maximum sample was stimulated with CRP-XL (10 μg/mL) for 90 seconds. Samples were analyzed by SDS-PAGE and Western blotting, followed by detection of tyrosine phosphorylated proteins with the use of antiphosphotyrosine (4G10) and visualization by enhanced chemiluminescence. Whole-lane tyrosine phosphorylation was quantified densitometrically by means of a Leica Q500 image analyzer (Milton Keynes, United Kingdom) and expressed as a percentage of the maximum sample to allow comparison between membranes.
Whole blood flow perfusion under high shear rate on collagen type III surface
The flow perfusion experiments were essentially performed as described previously.21,26 Here, the blood was anticoagulated with 20 U/mL pentasaccharide (a generous gift from Dr D. Meuleman, Organon, Oss, The Netherlands) and 5 μM PPACK (Bachem, Budendorf, Switzerland). Thermanox coverslips (Nunc, Naperville, IL) were sprayed with human placental collagen type III (Sigma) solubilized in 50 mM acetic acid, and frozen at –20°C for not longer than 10 days. The whole blood was drawn through a minichamber for 2.5 minutes at 37°C at a constant shear rate of 1600 s–1. Each sample was studied in parallel in 3 separate chambers. Platelet adhesion on the fixed and stained coverslip was quantified by means of a light microscope with 400 × magnification. We sampled a minimum of 20 distinct fields per coverslip, from which the mean surface coverage (percentage) was calculated.
Platelet function analyzer, PFA-100
In the PFA-100 method,27 platelets in citrate (0.38% wt/vol trisodium citrate) anticoagulated whole blood are exposed to high shear rate within a capillary that is coated with fibrillar collagen type I and either epinephrine (COL/EPI cartridge) or ADP (COL/ADP cartridge). Samples were tested in triplicate by means of both cartridges according to the manufacturer's instructions (Dade Behring, Marburg, Germany).
Statistical analysis
Arithmetic mean, standard deviation (SD), and standard error of the mean (SEM) were calculated for most variables. The data are presented as mean ± 1 SD if not stated otherwise. The Spearman correlation coefficient was calculated, and the χ2 test, 2-way analysis of variance (ANOVA), unpaired t test, or the Mann-Whitney U test was used when appropriate. The statistical analysis was performed by means of GraphPad Prism version 3.0a (GraphPad Software, San Diego, CA).
Results
The study group consisted of 29 donors, 18 homozygous for the “a” allele (SKTQH) and 11 homozygous for the “b” allele (PEALN). For the functional studies, 8 “aa” donors (7 male, 1 female; aged 45.6 ± 3.1 years) and 8 “bb” donors (6 male, 2 female; aged 46.5 ± 2.3 years) were used. There was no significant difference in their levels of plasma VWF (“aa,” 10.3 ± 1.4 μg/mL; “bb,” 10.8 ± 2.4 μg/mL) or plasma fibrinogen (“aa,” 3.0 ± 0.2 g/L; “bb,” 3.3 ± 0.2 g/L).
Expression of GPVI on “aa” and “bb” platelets
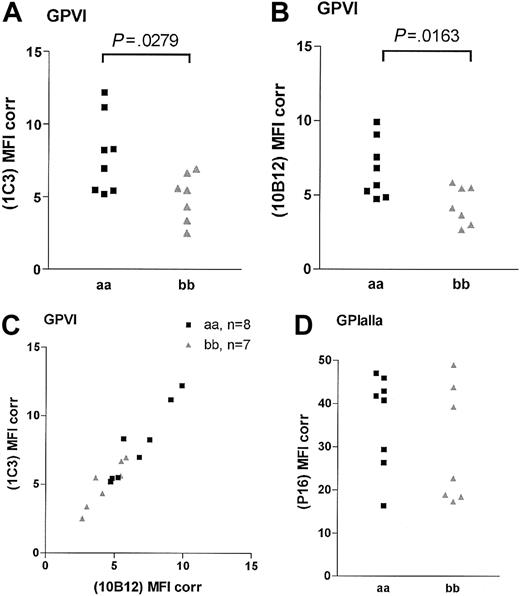
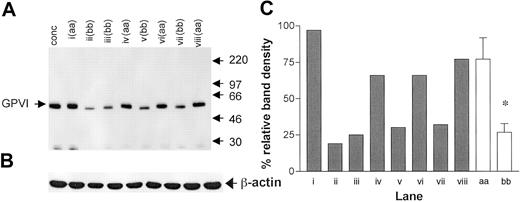
The binding of the 2 noncompeting GPVI scFvs 1C3 and 10B12 and the anti-GPIaIIa moAb NBS-P16 was determined in 15 homozygous samples (8 “aa” and 7 “bb”; Figure 1). An additional “aa” sample was included in each analysis to control for interassay variation. The binding of both GPVI antibodies was significantly lower in the “bb” group than in the “aa” group (Figure 1). For 1C3, the “aa” and the “bb” donors had corrected MFIs of 8.0 ± 0.9 and 5.0 ± 0.6 (unpaired t test, P = .028; Figure 1A), respectively, and for 10B12, 6.7 ± 0.70 and 4.3 ± 0.50 (P = .0163; Figure 1B), respectively. A high degree of correlation between the results obtained with both GPVI antibodies was observed (Spearman correlation, P < .005, r = 0.92; Figure 1C). The binding of the anti-GPIa moAb NBS-P16 also varied over a 3-fold range (Figure 1D), but there was no significant difference between the 2 groups (P = .33; unpaired t test). There was no correlation between the surface expression of GPIaIIa and GPVI (Spearman correlation, r = 0.46, P = .09). When total GPVI levels were compared by Western blotting of platelet lysates (Figure 2A), we observed a significant lower density of the GPVI band in the “bb” group when compared with the “aa” group (Figure 2B; P < .001; unpaired t test) and a slightly faster mobility of the “b” over the “a” form.
GPVI and GPIaIIa surface expression in homozygous “aa” and “bb” donors. Platelets were analyzed in flow cytometry assay with GPVI-specific scFv 1C3 (A) and scFv 10B12 (B) and GPIaIIa-specific moAb NBS-P16 (D). The levels are presented as MFI, with binding of the negative control antibody (moAb 9E10) for each sample subtracted (MFI Corr). Panel C shows the correlation between the fluorescence produced by the 2 GPVI-specific scFvs.
GPVI and GPIaIIa surface expression in homozygous “aa” and “bb” donors. Platelets were analyzed in flow cytometry assay with GPVI-specific scFv 1C3 (A) and scFv 10B12 (B) and GPIaIIa-specific moAb NBS-P16 (D). The levels are presented as MFI, with binding of the negative control antibody (moAb 9E10) for each sample subtracted (MFI Corr). Panel C shows the correlation between the fluorescence produced by the 2 GPVI-specific scFvs.
Total GPVI expression compared by Western blotting. (A) A Western blot of platelet lysates (equivalent to 107 platelets per lane) probed with rabbit anti-GPVI polyclonal antiserum. An arbitrary control was prepared from a platelet concentrate pooled from 4 donors (conc). Each of the lanes i-viii represents the platelets of study donor samples, with the GPVI genotype indicated. Molecular weights (kDa) of protein markers are shown to the right. (B) To control for loading, blots were reprobed with anti–β-actin. (C) Densitometric analysis relative to the control (conc = 100%) for the GPVI band in each of the other lanes (▦), as well as pooled by genotype (□). *P < .001, for the difference between pooled values. Error bars indicate SEM.
Total GPVI expression compared by Western blotting. (A) A Western blot of platelet lysates (equivalent to 107 platelets per lane) probed with rabbit anti-GPVI polyclonal antiserum. An arbitrary control was prepared from a platelet concentrate pooled from 4 donors (conc). Each of the lanes i-viii represents the platelets of study donor samples, with the GPVI genotype indicated. Molecular weights (kDa) of protein markers are shown to the right. (B) To control for loading, blots were reprobed with anti–β-actin. (C) Densitometric analysis relative to the control (conc = 100%) for the GPVI band in each of the other lanes (▦), as well as pooled by genotype (□). *P < .001, for the difference between pooled values. Error bars indicate SEM.
Platelet aggregation induced by CRP-XL
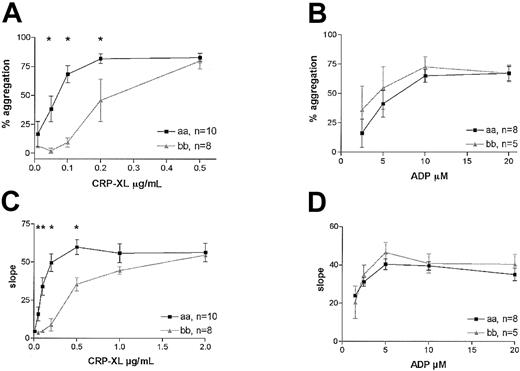
We investigated the effect of the GPVI alleles on the aggregation response in platelets activated with CRP-XL or with ADP, agonists that use different activation pathways.28 A highly significant difference in the response to CRP-XL was observed between the 2 groups in platelet aggregation. The platelets from 8 “bb” donors required 3 times higher concentrations of CRP-XL than platelets from the “aa” donors to achieve maximum aggregation (2-way ANOVA, P < .0001; Figure 3A). This difference was also evident when the maximum rates of aggregation were measured in the same experiments (Figure 3C). Although there appeared to be a trend of greater sensitivity to ADP of platelets from “bb” donors, no significant difference between the groups was observed, either in the extent of aggregation (2-way ANOVA, P = .27; Figure 3B) or the rate (Figure 3D).
Platelet aggregation in “aa” and “bb” donors. Platelet aggregation in subjects homozygous for “aa” (▪) or “bb” (▴) was induced by CRP-XL, and the extent of aggregation (A) as well as the maximum rate of aggregation (C) is shown with respect to dose. Samples from the same subjects were also treated with ADP, and the extent of aggregation (B) and maximum rate (D) are also shown. Data are expressed as the mean ± SEM, and statistically significant differences between the “aa” and the “bb” groups (Mann-Whitney U test, P < .05) are marked by an asterisk.
Platelet aggregation in “aa” and “bb” donors. Platelet aggregation in subjects homozygous for “aa” (▪) or “bb” (▴) was induced by CRP-XL, and the extent of aggregation (A) as well as the maximum rate of aggregation (C) is shown with respect to dose. Samples from the same subjects were also treated with ADP, and the extent of aggregation (B) and maximum rate (D) are also shown. Data are expressed as the mean ± SEM, and statistically significant differences between the “aa” and the “bb” groups (Mann-Whitney U test, P < .05) are marked by an asterisk.
GPVI allele–specific differences in platelet activation studied with whole blood flow cytometry
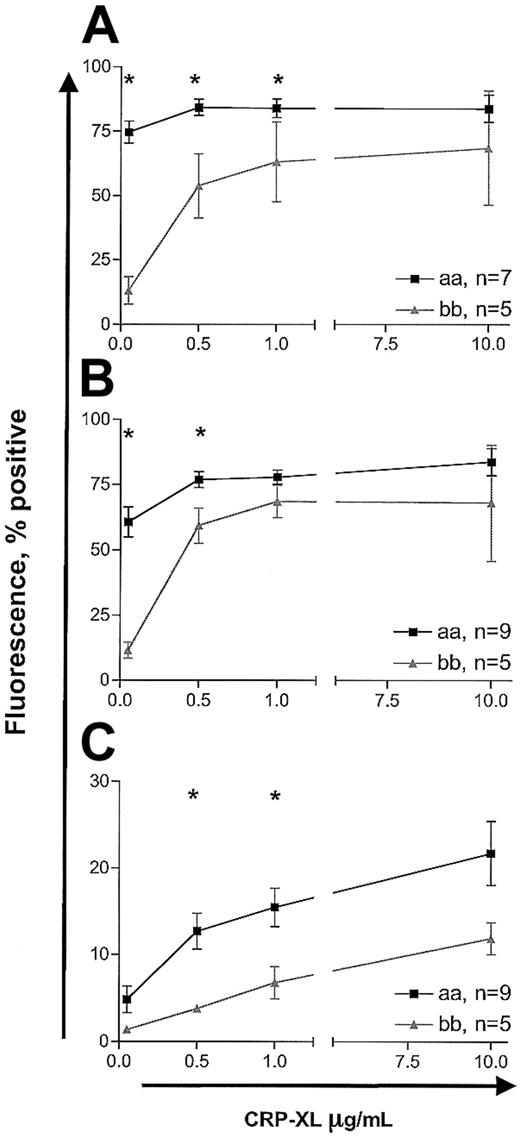
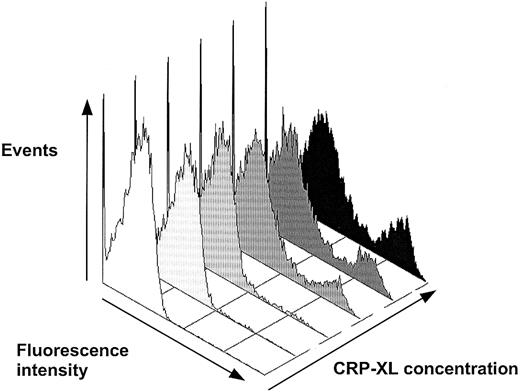
Measurement of platelet activation by whole blood flow cytometry showed similar attenuation of response in “bb” homozygotes relative to “aa” homozygotes. In the detection of fibrinogen binding, CD62P expression, and annexin V binding, the “bb” samples required higher concentrations of CRP-XL than the “aa” samples to achieve similar responses (2-way ANOVA, P < .0001; Figure 4). Interestingly, the pattern of annexin V binding was different from that of fibrinogen binding and expression of CD62P. Even at CRP-XL levels of 10 μg/mL, only up to 10% to 20% of platelets were annexin V+, whereas maximal fibrinogen binding and CD62P expression (70% to 90% positive) were achieved at 1 μg/mL CRP-XL (Figure 4). Further, even at 10 μg/mL CRP-XL, only a subpopulation of platelets became annexin V+ while the remaining cells did not show any binding (Figure 5). The baseline levels of platelet activation for 3 markers did not differ in the 2 groups (data not shown). The response to ADP resulted in dose-dependent changes in expression of all 3 markers, but there were no significant differences in the 2 groups (data not shown).
Platelet activation induced by CRP-XL studied by whole blood flow cytometry. Platelet fibrinogen binding (A), P-selectin expression (B), and annexin V binding (C) were measured in CRP-XL–stimulated blood samples from donors homozygous for “aa” or “bb.” Activation markers were analyzed on CD61+ events. Data are expressed as the mean ± SEM, and statistically significant differences between the “aa” and the “bb” groups (Mann-Whitney U test, P < .05) are marked by asterisk.
Platelet activation induced by CRP-XL studied by whole blood flow cytometry. Platelet fibrinogen binding (A), P-selectin expression (B), and annexin V binding (C) were measured in CRP-XL–stimulated blood samples from donors homozygous for “aa” or “bb.” Activation markers were analyzed on CD61+ events. Data are expressed as the mean ± SEM, and statistically significant differences between the “aa” and the “bb” groups (Mann-Whitney U test, P < .05) are marked by asterisk.
Detection of phosphatidylserine expression with FITC-labeled annexin V on platelets activated in whole blood by CRP-XL. The annexin V+ events comprised a distinct population of platelets, increasing in number dose-dependently. The first and second histograms, from the left, are without CRP-XL and annexin V and without CRP-XL, respectively, and then 0.05, 0.5, 1.0, and 10 μg/mL CRP-XL.
Detection of phosphatidylserine expression with FITC-labeled annexin V on platelets activated in whole blood by CRP-XL. The annexin V+ events comprised a distinct population of platelets, increasing in number dose-dependently. The first and second histograms, from the left, are without CRP-XL and annexin V and without CRP-XL, respectively, and then 0.05, 0.5, 1.0, and 10 μg/mL CRP-XL.
Thrombin generation evoked by CRP-XL
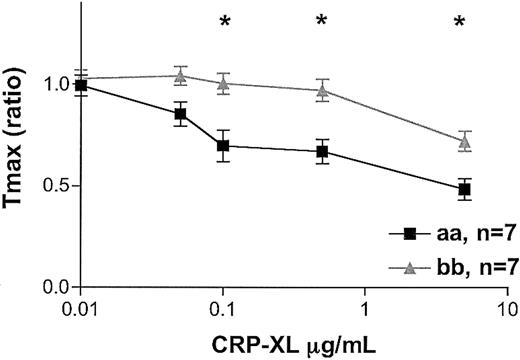
When comparing thrombin generation in “aa” and “bb” donors, we observed the same profound difference. At the same platelet concentrations, the “bb” samples showed significantly lower thrombin-generating potential than the “aa” samples. Significantly lower AUCs were obtained with the “bb” than with the “aa” platelets (data not shown; 2-way ANOVA, P = .04). A significant delay in the time to reach peak thrombin generation, as indicated by the Tmax ratio, was observed with the “bb” platelets (2-way ANOVA, P < .0001; Figure 6).
Thrombin generation induced by CRP-XL. CRP-XL–induced thrombin generation was studied in 7 “aa” and 7 “bb” donors. The amount of thrombin generated by platelet plasma in the absence of CRP-XL was taken to be 100% for each assay condition. The differences between the time taken in the absence and in the presence of CRP-XL to reach peak thrombin generation (Tmax) was calculated as a ratio, with the shortening of the time represented by a ratio less than 1.0. Data are expressed as the mean ± SEM, and statistically significant differences between the “aa” and the “bb” groups (P < .05, Mann-Whitney U test) are marked by asterisk.
Thrombin generation induced by CRP-XL. CRP-XL–induced thrombin generation was studied in 7 “aa” and 7 “bb” donors. The amount of thrombin generated by platelet plasma in the absence of CRP-XL was taken to be 100% for each assay condition. The differences between the time taken in the absence and in the presence of CRP-XL to reach peak thrombin generation (Tmax) was calculated as a ratio, with the shortening of the time represented by a ratio less than 1.0. Data are expressed as the mean ± SEM, and statistically significant differences between the “aa” and the “bb” groups (P < .05, Mann-Whitney U test) are marked by asterisk.
Tyrosine phosphorylation of platelet proteins
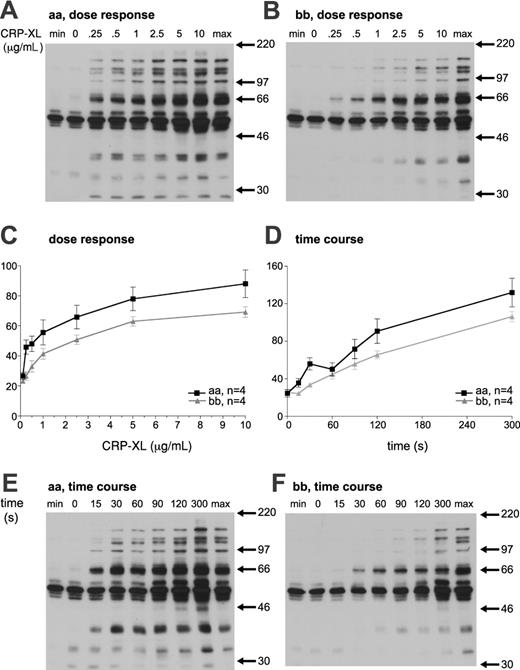
Stimulation of platelets with CRP-XL leads to time- and dose-dependent tyrosine phosphorylation. The magnitude of tyrosine phosphorylation in response to CRP-XL was analyzed in 4 “aa” and 4 “bb” donors, and expressed as a percentage of the standard maximum sample. The dose-response curve of “bb” platelets was shifted to the right in comparison with “aa” platelets. In addition, the responses of “bb” platelets to CRP-XL were significantly lower than those of “aa” platelets (2-way ANOVA, P < .0001; Figure 7A-C). Platelets from “bb” donors showed delayed tyrosine phosphorylation in response to CRP-XL (at 5 μg/mL), and the response was significantly lower than that of “aa” platelets (Mann-Whitney U test, P < .0001). At 60 seconds, the tyrosine phosphorylation of “aa” platelets showed a characteristic decrease relative to that at 30 seconds. However, this is not observed in platelets from “bb” donors, perhaps suggesting a mechanistic difference in the tyrosine phosphorylation signaling (Figure 7D-F).
Platelet tyrosine phosphorylation in response to CRP-XL. Platelets from an “aa” (A) and a “bb” (B) donor were stimulated with the indicated CRP-XL concentration for 90 seconds and analyzed for tyrosine phosphorylation. Time dependence of tyrosine phosphorylation induced by 5 μg/mL CRP-XL was also determined (E-F). Basal (min) and maximum (max) standard samples were prepared independently. (C-D) Whole-lane tyrosine phosphorylation was quantified by means of densitometry and expressed as a percentage of the maximum sample. The magnitude of tyrosine phosphorylation in 4 “aa” and 4 “bb” platelets was determined and expressed as the mean ± SEM.
Platelet tyrosine phosphorylation in response to CRP-XL. Platelets from an “aa” (A) and a “bb” (B) donor were stimulated with the indicated CRP-XL concentration for 90 seconds and analyzed for tyrosine phosphorylation. Time dependence of tyrosine phosphorylation induced by 5 μg/mL CRP-XL was also determined (E-F). Basal (min) and maximum (max) standard samples were prepared independently. (C-D) Whole-lane tyrosine phosphorylation was quantified by means of densitometry and expressed as a percentage of the maximum sample. The magnitude of tyrosine phosphorylation in 4 “aa” and 4 “bb” platelets was determined and expressed as the mean ± SEM.
Collagen-induced activation of platelets
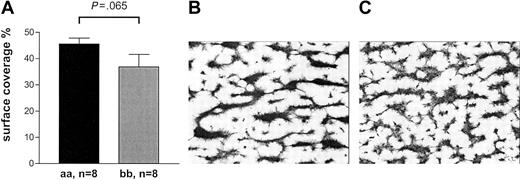
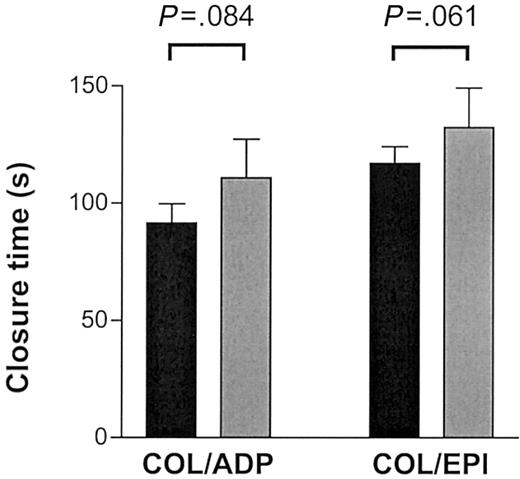
Collagen-mediated activation of platelets involves molecular pathways in addition to GPVI that are not mimicked by CRP-XL.29 We investigated whether the effect of the GPVI alleles was as pronounced when collagen was used for activation. We made similar observations when perfusing blood at high shear on pepsin-digested type III collagen or when testing for closure time in the PFA-100 in the presence of fibrillar type I collagen with ADP or epinephrine (Figures 8, 9). The thrombus formation under high shear rate after 2.5 minutes' perfusion appeared to be more pronounced in the 8 “aa” than in the 8 “bb” samples (45.6% ± 6.3% versus 36.9% ± 13.4%, respectively) although the difference did not quite reach statistical significance (Mann-Whitney U test, P = .065; Figure 8). In the “bb” group, 2 of the highest surface coverage values were obtained with donor samples with relatively high plasma VWF levels (26.4 μg/mL and 13.8 μg/mL). When analyzed in the PFA-100, longer closure times were observed in “bb” donors with both collagen/epinephrine (“bb,” 132 ± 41 seconds; “aa,” 117 ± 20 seconds) and collagen/ADP cartridges (“bb,” 111 ± 40 seconds; “aa,” 91 ± 24 seconds) than in “aa” donors although the difference did not quite reach statistical significance (unpaired t test, P = .061 and P = .084, respectively; Figure 9).
Thrombus formation on collagen type III surface under high shear. (A) The mean surface coverage after 2.5 minutes' perfusion tended to be higher with “aa” blood compared with “bb.” Data are expressed as the mean ± SEM and tested by Mann-Whitney U test. (B-C) Typical examples of coverslips representing the mean percentage of surface coverage are depicted for “aa” blood (B) and “bb” blood (C).
Thrombus formation on collagen type III surface under high shear. (A) The mean surface coverage after 2.5 minutes' perfusion tended to be higher with “aa” blood compared with “bb.” Data are expressed as the mean ± SEM and tested by Mann-Whitney U test. (B-C) Typical examples of coverslips representing the mean percentage of surface coverage are depicted for “aa” blood (B) and “bb” blood (C).
Thrombus formation on collagen type I surface under high shear. The closure time on the PFA-100 was measured in triplicate with 8 “aa” (▪) and 6 “bb” (▦) donors by means of both the COL/EPI (collagen type I and epinephrine) and the COL/ADP (collagen type I and ADP) cartridges. Data are expressed as the mean ± SEM and tested by unpaired t test.
Thrombus formation on collagen type I surface under high shear. The closure time on the PFA-100 was measured in triplicate with 8 “aa” (▪) and 6 “bb” (▦) donors by means of both the COL/EPI (collagen type I and epinephrine) and the COL/ADP (collagen type I and ADP) cartridges. Data are expressed as the mean ± SEM and tested by unpaired t test.
Discussion
The cross-linked collagen-related peptide, CRP-XL, activates platelets via GPVI, rather than other platelet receptors.11,12 Cross-linking of GPVI by CRP-XL evokes tyrosine phosphorylation via an immunoreceptor tyrosine-based activation motif (ITAM) of the FcR γchain by an Src family kinase.2 When testing the aggregation response of platelets of random donors to CRP-XL, we observed low responses with some samples. We reasoned that this difference was possibly based on different allelic forms of GPVI or on mutations in genes encoding downstream effectors.
We genotyped 1153 volunteers for all 5 SNPs (alleles Ser199Pro, Lys217Glu, Thr229Ala, Gln297Leu, and His302Asn) and identified 755 (65%) homozygotes for the high-frequency allele, 28 (2%) homozygotes for the low-frequency allele, and 290 heterozygotes. The remaining 80 were examples of rare hybrid alleles (N.A.W. et al, unpublished data, 2002). Platelets from 15 individuals selected as homozygous “aa” and “bb” revealed a significant difference in membrane expression of GPVI (Figure 1). It is unlikely that this difference is caused by mutations in the antibody-binding sites. First, the 2 antibodies bind in a noncompetitive manner to different epitopes on the 2 immunoglobulin-like domains (residues 1-185) (P.A.S. et al, unpublished data, 2002). Second, when sequencing exons 3 and 4 of the GPVI gene in 188 chromosomes, we did not observe any replacement mutations except a single rare one at position 83. However, none of the 15 donors carried the rare form of this Leu83Val mutation (N.A.W. et al, unpublished data, 2002). We also determined the overall GPVI content by Western blot with a rabbit polyclonal GPVI antiserum (Figure 2A). These results were in agreement with those of the flow cytometry experiments and showed a significant lower GPVI content in “bb” platelets when compared with “aa” ones (Figure 2C). It also shows that the reduced GPVI membrane expression in “bb” homozygous platelets is not caused by differences in the compartmentalization of GPVI.
Others have used the lectinlike snake venom convulxin (CVX) to probe blots to estimate total platelet GPVI content.30 They concluded that 23 individuals showed a 5-fold variation in GPVI content. Furihata et al30 found that total GPVI content was positively correlated with GPIaIIa membrane expression levels. We found a 3-fold variation in surface expression of GPVI and a split in the overall GPVI expression levels related to the GPVI alleles. We were unable to show a correlation of GPVI levels with GPIaIIa even when analyzing “aa” and “bb” samples separately (Figure 1D). Similarly, Chen et al31 showed a lower variation in GPVI surface expression levels and no correlation with GPIaIIa levels. There are possible reasons for these differences. First, we and Chen measured GPVI membrane and total expression with antibodies while Furihata et al used CVX. Interestingly, the antibody 6F1 against the I domain of the α-integrin does partially inhibit the action of CVX, raising the possibility that CVX is not entirely specific for GPVI.32
Aggregation of “aa” and “bb” platelets showed a 3-fold difference in the response to CRP-XL (Figure 3). This was highly significant, as was the difference in expression of markers of platelet activation by whole blood flow cytometry. In the latter experiments, activation of platelets was achieved with minimal sample manipulation by adding CRP-XL to whole blood. The binding of fibrinogen and the extent of α-granule release were significantly greater in platelets from subjects homozygous for “aa” compared with “bb” (Figure 4). This was also the case for expression of phosphatidylserine (as measured by annexin V binding), previously shown by us and others to be attributable to GPVI activation.33 Interestingly, at saturating levels of CRP-XL, bound fibrinogen and CD62P were increased throughout the whole platelet population; however, only a subset of platelets (10% to 20%) bound annexin V. This observation is consistent with other studies showing a clear dissociation between the α-granule release and annexin V binding.34,35 We and others have shown that CRP-XL and CVX alone do not result in the expression of phosphatidylserine detected with annexin V when gel-filtered platelets are used in suspension.33,34 In the present study, we showed subpopulations with annexin V positivity of 10% to 35% and 8% to 15% for “aa” and “bb” platelets, respectively (Figure 4). The most likely explanation for this is that during the time course of the experiment performed in whole blood, enough thrombin is generated to lead to the formation of dual agonized or collagen and thrombin (COAT) platelets.34,35 This is also compatible with the different plateaus of annexin V binding in the 2 allotypes. The lag time for thrombin generation in CRP-XL–treated platelets was delayed, and thrombin levels were reduced in the “bb” platelets when compared with the “aa” ones.
Measurement of tyrosine phosphorylation revealed clear differences between the “aa” and “bb” types in the platelet signaling response to CRP-XL, the dose curve for “bb” platelets being shifted 4-fold to the right (Figure 7). Interestingly, transformation of these data revealed logarithmic dose response (not shown), suggesting first-order kinetics of the activation process. Further, the 2 lines do not converge, indicating that the “bb” platelets are not capable of expressing the full signaling response to CRP-XL. The time course of activation of the “bb” platelets lacked the early wave of tyrosine phosphorylation seen in the “aa” platelets, attributed to a rapid activation of a subset of tyrosine kinases,36 possibly of the Src family.37 This might imply that specific activatory processes are lacking in the “bb” platelets.
Various mechanisms may account for the observed differences in response to CRP-XL. It is possible that the differences are due solely to variation in GPVI expression. However, structural changes can be expected to contribute to altered signaling. These may be made to the main polypeptide chain by Ser199Pro, by alteration of potential O-glycosylation sites at Ser199Pro and Thr229Ala, or by a charge reversal at Lys217Glu. From the Western blot, it may be concluded that the “b” form of GPVI has a reduced level of glycosylation. However, further study will be required to prove this. These changes could conceivably affect clustering of GPVI, which has been postulated to be important for ligand binding and signaling.38 Also, in the cytoplasmic domain, 1 of the 2 mutations flanks the class I polyproline motif (RPLPPLPPLP(Gln297Leu)T), which is a target for the SH3 domain of the Src family kinases.39 Recruitment of those proteins found to dock in this region10 may therefore be altered by this polymorphism. To what extent any of these proposed mechanisms contribute to the observed functional differences remains unanswered by this study. Experiments using the hybrid GPVI alleles uncovered in our high-resolution SNP detection study (N.A.W. et al, unpublished data, 2002) are currently being used to address these questions directly in human platelets.
Differences between “aa” and “bb” platelets were also observed in adhesion to type I collagen and subsequent activation in the PFA-100, and to type III collagen in a flow perfusion assay, although statistical significance was not reached (Figures 8, 9). This may reflect the relatively small cohort size in comparison with the inherent variability in these assays. The interaction of collagen with platelets involves several receptors and pathways other than GPVI, and each of these may compensate for reduced GPVI signaling. For instance, GPIaIIa is important in stirred platelet aggregation, as evidenced with GPIaIIa-deficient platelets and blocking antibodies.40 The GPIbIXV-VWF axis is known to be important for initial tethering of platelets to a collagen surface and subsequent thrombus formation.41 As platelet adhesion at high shear as well as recruitment of collagen to the cellular surface in stirred aggregation are known roles for GPIaIIa, there are other receptors, such as GPIV, with less well-defined roles in these processes.38 Interestingly, the 2 “bb” samples producing the highest level of surface coverage on collagen by flow perfusion were from donors with high VWF levels and high expression level of GPIaIIa. This is suggestive of molecular interplay between GPIaIIa and GPVI, which may need to be defined for each of the collagen types, since they may express different levels of receptor recognition motifs. We recently showed that VWF concentration is an independent factor in formation of thrombi when flowing blood is at high shear rate.21 In that study, we also confirmed the effect of GPIaIIa expression level on surface coverage. However, the number of samples that split on the GPIa SNP in this current study was too small to observe an effect of the GPIa alleles independent of the GPVI ones.
On the basis of the results in this study, we postulate that GPVI “bb” patients may be more prone to bleeding when their hemostatic system is challenged. Croft et al13 showed the GPVI “b” allele (defined in their study by one SNP, which encodes Ser199Pro) to be an independent risk factor for myocardial infarction in a subgroup of female patients who were older than 60 years of age and without a history of smoking. The relationship between this observation and our functional studies remains unclear. There remains the possibility that their observation was made by chance, as the power of the study is relatively limited.42
Prepublished online as Blood First Edition Paper, January 30, 2003; DOI 10.1182/blood-2002-08-2591.
Supported by the British Heart Foundation (P.A.S., R.W.F.); Medical Research Council (R.W.F.); National Blood Service R&D (L.J.-K.); Paavo Nurmi Foundation; and Finnish Association of Haematology.
The publication costs of this article were defrayed in part by page charge payment. Therefore, and solely to indicate this fact, this article is hereby marked “advertisement” in accordance with 18 U.S.C. section 1734.
Dr Jill Walton of the Cambridge donor clinic and staff of the National Blood Service Cambridge are acknowledged for their generous help in organizing the samples.

This feature is available to Subscribers Only
Sign In or Create an Account Close Modal