Abstract
The chemokine superfamily consists of small (8-10 kDa) molecules that function to attract, selectively, different subsets of leukocytes. Binding of chemokines to their appropriate G-protein–coupled receptors is necessary for primary immune responses and for homing of leukocytes to lymphoid tissues. Here, we have characterized the signaling pathways in primary T lymphocytes that regulate chemokine gene induction using an RNase protection assay. Dependence on stimulation through the coreceptor CD28 and sensitivity to the calcineurin inhibitors cyclosporine and tacrolimus were studied using purified human peripheral blood lymphocytes. Lymphotactin (Ltn), macrophage inflammatory protein (MIP)–1α, and MIP-1β were all rapidly induced and sensitive to cyclosporine treatment. At later time points, the expression of MIP-1α and MIP-1β, but not of Ltn, was restored despite the inhibition of calcineurin activity. By contrast, the induction of interleukin-8 was delayed and was found to be cyclosporine insensitive. Calcineurin activity of IP-10 mRNA induction was contingent on the specific T-cell stimulation conditions, suggesting that IP-10 expression is modulated by calcineurin-dependent and -independent signaling pathways. Differential chemokine expression profiles result from the engagement of T-cell coreceptors and the requirement for, and the dependence on, calcineurin phosphatase activity.
Introduction
The immune response is initiated by direct T-cell contact with antigen-presenting cells (APCs). The complex activation of T lymphocytes requires engagement of the T-cell receptor (TcR)–CD3 complex with peptide antigens within major histocompatibility complex (MHC) proteins presented on the APC and signaling with costimulatory receptors.1-5 CD28 is one well-characterized costimulatory receptor that has been shown to be capable of fostering persistent T-cell responsiveness.6 7
Intracellular signaling pathways, stimulated by the TcR-CD3 complex and by CD28, are initiated by the aggregation of signaling molecules into a large macromolecular complex8-12 and the concurrent activation of a number of intracellular signaling molecules. Central to T-cell activation is the hydrolysis of phosphatidyl inositol bisphosphate (PIP2), catalyzed by phospholipase C (PLCγ), to inositol 3,4,5 trisphosphate (IP3) and diacylglycerol; IP3 production results in calcium (Ca++) mobilization.13-15 An increase in intracellular Ca++, together with calmodulin, has been shown to stimulate the serine-threonine phosphatase activity of calcineurin (Cn, phosphatase 2B or PP2B),16 required for the activation and nuclear translocation of a number of transcription factors,17-21 including nuclear factor of activated T cells (NFAT).22,23 NFAT activity, in turn, has been shown to regulate the transactivation of a number of cytokine genes24-27 and is sensitive to inhibition by the immunosuppressive agents cyclosporine (CsA) and tacrolimus (FK506).
CsA and FK506 have been widely used in kidney and heart transplantation for the prevention of allograft rejection, in bone marrow and stem cell transplantation for the prevention of graft-versus-host disease (GVHD), and in therapy for chronic autoimmune inflammatory conditions.28-30 CsA and FK506 bind to members of families of intracellular immunophilin proteins termed cyclophilin (CyP) and FK506-binding protein (FKBP), respectively.29,31 The complexes of CsA/CyP and of FK506/FKBP bind to and inhibit calcineurin phosphatase activity.32 33 In T lymphocytes, calcineurin inhibition by CsA or FK506 results in the inhibition of cytokine (eg, interleukin-2 [IL-2]) production, stemming from the inhibition of NFAT-dependent nuclear translocation. Furthermore, CsA and FK506 inhibit T-cell proliferation secondary to their suppression of the cytokine production necessary for cell cycle progression. Importantly, engagement of the coreceptor CD28 in vitro has been shown to promote T-cell proliferation despite CsA or FK506 treatment by mechanisms that are as yet unclear.
In launching an immune response against infection, T lymphocytes and other leukocytes are recruited to sites of inflammation by chemoattractant gradients. This directed movement is mediated by the superfamily of small (8-10 kDa) chemotactic cytokines, termed chemokines, that act by way of G-protein–coupled receptors. Although more than 50 individual members have been identified, the chemokine superfamily of proteins is generally classified by the spacing of its signature cysteine residues near the amino terminus—CC, CXC, CC/CXC, C, and CX3C, where X represents any amino acid.34 In addition to their role in leukocyte trafficking, chemokines regulate other diverse biologic processes including angiogenesis, hematopoiesis, and organogenesis.35-37 Although chemokine-dependent homing of T lymphocytes to target tissues has been extensively studied,38,39 the regulation of chemokine production is less well understood. In solid organ transplantation, chemokines appear to play an important regulatory role in the infiltration of leukocytes into allografts.40 Better understanding of the regulatory mechanisms governing chemokine expression would provide novel insight into the regulation of allograft rejection.
Because chemokine expression is essential in directing the immune response and may be important in understanding tolerance (and autoaggression) in transplantation biology, we sought to explore the regulation of chemokine expression in purified, primary, human T lymphocytes. Specifically, the role of CD28 engagement and the sensitivity to calcineurin inhibitors CsA and tacrolimus was examined using an RNase protection assay (RPA) to analyze expression of members from the C, CC, and CXC chemokine classes. Our study demonstrated calcineurin-sensitive induction of lymphotactin (Ltn),1macrophage inflammatory protein (MIP)–1α, and MIP-1β in human peripheral blood lymphocytes (PBLs) following T-cell activation. In contrast, we demonstrated more complex regulation of the CXC chemokine IP-10 by CsA, dependent, in part, on the stimulating conditions; calcineurin-dependent and -independent signaling pathways modulate IP-10 gene expression. Differential chemokine expression profiles result from the engagement of T-cell coreceptors and the requirement for, and dependence on, calcineurin phosphatase activity.
Common or familiar names for the chemokines discussed in this manuscript are used throughout. Systematic names of each are: Lymphotactin, XCL1; RANTES, CCL5; IP-10, CXCL10; MIP-1β, CCL4; MIP-1α, CCL3; MCP-1, CCL2; IL-8, CXCL8; MIG, SCYB9; I-TAC, SCYB11.
Materials and methods
Cells and cell culture
Human PBLs, isolated from donors by apheresis, were subjected to reverse flow elutriation and Ficoll-Hypaque centrifugation and were washed with 1× phosphate-buffered saline (PBS). Immunophenotyping of PBLs across 8 different human donors revealed the cell subpopulations to be 67.3% ± 2.5% CD3+, 41.5% ± 1.5% CD4+, 34.7% ± 3.2% CD8+, 13.4% ± 1.3% CD8+CD56+, 4.0% ± 0.9% CD14+, 90.7% ± 3.2% CD45+, and 24.7% ± 2.7% CD56+. PBLs were resuspended in RPMI 1640 (MediaTech, Herndon, VA) supplemented with 10% heat-inactivated fetal calf serum (FCS) (Gibco-BRL, Life Technologies, Gaithersburg, MD), 2 mM l-glutamine, 10 mM HEPES (N-2-hydroxyethylpiperazine-N′-2-ethanesulfonic acid) pH 7.2, 100 U/mL penicillin, 100 μg/mL streptomycin (MediaTech), and 50 μM 2-mercaptoethanol (Bio-Rad, Hercules, CA), termed 10% RPMI, and incubated at 37°C, 5% CO2 in air. After overnight rest, cells either were not stimulated or were stimulated with 10 ng/mL phorbol 12-myristate-13-acetate (PMA; Calbiochem, La Jolla, CA), 1 μM ionomycin (Iono; Calbiochem), soluble (100 ng/mL) purified anti-CD3 monoclonal antibody (mAb) OKT3 (American Type Culture Collection, Rockville, MD), soluble (1 μg/mL) purified anti-CD28 mAb 9.3 (the kind gift of Carl June, University of Pennsylvania, Philadelphia), singly or in combination as indicated. Cells, where indicated, were pretreated with 1 μM cyclosporine (CsA; Sandoz, Basel, Switzerland) or 100 nM tacrolimus (FK506; Alexis, San Diego, CA) or 100 nM sirolimus (rapamycin; Calbiochem). CD4+ and CD8+ T lymphocytes were purified by negative selection using an indirect magnetic labeling system and the MidiMACS columns (Miltenyi Biotec, Auburn, CA) according to manufacturer's instructions. Briefly, non-CD4+ cells were magnetically depleted from PBLs using a cocktail of CD8, CD11b, CD16, CD19, CD36, and CD56 antibodies. The resultant purified CD4+ T-cell population was routinely 96% CD4+ assayed by direct immunofluorescence using an antihuman fluorescein isothiocyanate (FITC)–conjugated CD4+ antibody (clone RPA-T4; PharMingen, San Diego, CA; data not shown). Non-CD8+ cells were magnetically depleted from PBLs using a cocktail of CD4, CD11b, CD16, CD19, CD36, and CD56 antibodies. The resultant purified CD8+ T-cell population was routinely 89% CD8+assayed by direct immunofluorescence using a phycoerythrin (PE)–conjugated antibody (clone SFC121thyd3; Coulter, Fullerton, CA; data not shown).
RNase protection assay
Total RNA was prepared from PBLs using Trizol (Gibco-BRL, Life Technologies) according the manufacturer's recommended protocol, quantitated using OD260, and subsequently used for analysis of mRNA expression using the Riboquant RNase protection assay system (human CK5 probe set; PharMingen) according to the manufacturer's instructions. Briefly, a 32P-labeled antisense RNA probe was synthesized from the human chemokine 5 template by T7 RNA polymerase. The probe (at a concentration of approximately 3 × 10⁵ cpm/μL) was hybridized in solution overnight in excess to target RNA (2 μg total RNA/treatment) in a total reaction volume of 10 μL. Free probe and other single-stranded RNAs were digested with RNase A + T1, per the manufacturer's protocol. The remaining RNase-protected probes were precipitated, dissolved in 5 μL sample buffer (PharMingen), and resolved on denaturing polyacrylamide gels followed by autoradiography for 1 day at −70°C. Bands were quantitated by PhosphorImager analysis (Molecular Dynamics) using ImageQuant software, and chemokine mRNA levels were normalized to L32 mRNA levels.
RT-PCR
Total RNA was prepared from human PBLs using Trizol (Gibco-BRL, Life Technologies) and was quantitated using OD260 and the RiboGreen RNA quantitation kit (Molecular Probes, Eugene, OR) according to manufacturer's instructions. mRNA levels were assayed using the Onestep reverse transcription–polymerase chain reaction (RT-PCR) kit (Qiagen, Valencia, CA) using the following oligonucleotide purification cartridge (OPC)–purified primers (BioServe Biotechnologies, Laurel, MD): IP-10-F 5′-CGA TTC TGA TTT GCT GCC TT-3′, IP-10-R 5′-TCA GAC ATC TCT TCT CAC CCT TC-3′; Ltn-F 5′-CTG ATC CTG GCC CTC CTT-3′, Ltn-R 5′-GGC TTG GTC TGG ATC ATG TT-3′; MIP-1α-F 5′-CCT TGC TGT CCT CCT CTG CAC-3′, MIP-1α-R 5′-CAC TCA GCT CCA GGT CGC TGA-3′; MIP-1β-F 5′-TGT CCT CCT CAT GCT AGT AG-3′, MIP-1β-R 5′-GTA CTC CTG GCC CAG GAT TC-3′; β-actin-F 5′-ATC TGG CAC CAC ACC TTC TAC AAT GAG CTG CG-3′, β-actin-R 5′-CGT CAT ACT CCT GCT TGC TGA TCC ACA TCT GC-3′, where F is forward and R is reverse.
RT-PCR was performed using the following conditions: 50°C for 30 minutes; 95°C for 15 minutes; 30 cycles of 94°C for 1 minute, 55°C for 1 minute, and 72°C for 1 minute; and 72°C for 10 minutes. Samples were analyzed by gel electrophoresis, and bands were revealed using ethidium bromide staining. Bands were quantitated by PhosphorImager analysis (Molecular Dynamics, Amersham Biosciences; Uppsala, Sweden) using ImageQuant software, and mRNA levels were normalized to β-actin mRNA levels as indicated.
Cell surface and intracellular staining
Human PBLs, stimulated as described, were harvested by centrifugation for 5 minutes at 500g. For cell-surface–staining characterization of cell populations, cells were resuspended in 1× PBS and were incubated with a FITC-conjugated mouse anti–human CD3 antibody (UCHT1), PE-conjugated mouse anti–human CD4 (13B8.2), FITC- or PE-conjugated mouse anti–human CD8 (B9.11), FITC-conjugated mouse anti–human CD14 antibody (RMO52), PE-conjugated mouse anti–human CD45 (HI30), PE-conjugated mouse anti–human CD56 (NKH-1), or appropriate isotype control antibodies (Immunotech, Marseilles, France) for 30 minutes at 4°C in the dark. After 30 minutes, cells were washed twice with 1× PBS, resuspended in 1% paraformaldehyde (in 1× PBS), and analyzed by FACS using a Coulter cytometer. Intracellular staining was carried out using the Cytofix/Cytoperm intracellular staining kit (PharMingen) according to the manufacturer's instructions. Intracellular cytokine levels were determined using a goat anti–human IP-10 (AF226NA), mouse anti–human IL-8 (6217.111), mouse anti–human MIP-1α (14215), mouse anti–human MIP-1β (24006.111), and mouse anti–human Ltn (109001). Antibodies (all from R&D Systems, Minneapolis, MN) followed by the appropriate isotype-matched PE-conjugated secondary antibody were used.
Results
Induction of chemokine gene expression following activation of human peripheral blood T cells
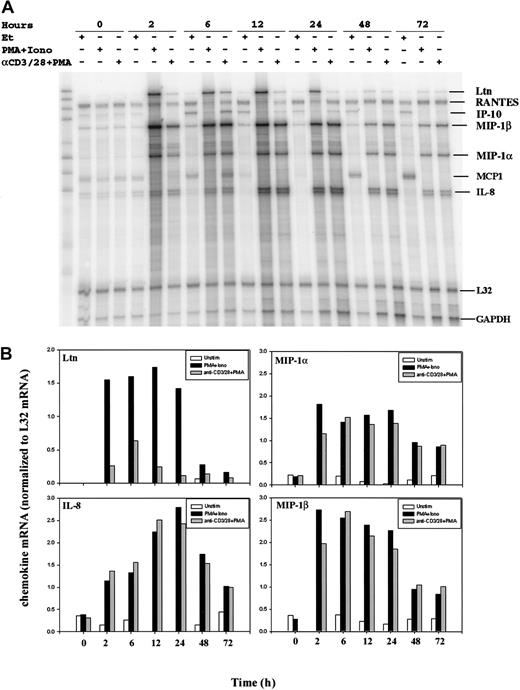
To determine chemokine transcriptional activation following T-cell stimulation, we compared resting and activated human peripheral blood T cells (PBLs) by RNase protection assay (RPA). Purified human PBLs were treated with an anti-CD3 (OKT3) mAb, an anti-CD28 (9.3) mAb, and phorbol 12-myristate 13-acetate (PMA), an agent used to activate classical forms of protein kinase C. Alternatively, cell surface receptor engagement was bypassed by incubation of the cells with PMA and the calcium ionophore ionomycin. RNA was prepared from purified human PBLs stimulated for 0, 2, 6, 12, 24, 48, and 72 hours. RNase protection assays revealed the rapid induction of lymphotactin (Ltn), macrophage inflammatory protein (MIP)–1α, MIP-1β, and interleukin (IL)–8 mRNA following T-cell activation (Figure1A). Conversely, mRNA levels of RANTES were unchanged after the stimulation of human PBLs at all time points examined. Bands were quantitated by PhosphorImager analysis (Molecular Dynamics) using ImageQuant software, and chemokine mRNA levels were normalized to L32 mRNA levels (Figure 1B). Notably, there was some variation in the chemokine (eg, IP-10) expression profiles among RNA isolated from different human donors; additional RPA analyses and RT-PCR were used, as discussed later in this report.
Modulation of chemokine gene expression following T-cell activation.
Human PBLs were unstimulated or stimulated with PMA+Iono or soluble anti–(α-)CD3 mAb, soluble α-CD28 mAb plus PMA for 0, 2, 6, 12, 24, 48, and 72 hours, as indicated. Total RNA was prepared using Trizol, quantitated using OD260, and analyzed by an RNase protection assay (RPA; see “Materials and methods”). (A) Results of 1 of 2 separate experiments, each using cells from different donors, are shown. MCP-1 was faintly detected but was not observed in subsequent experiments. (B) Chemokine mRNA levels normalized to levels of L32 mRNA were quantitated by PhosphorImager analysis using ImageQuant software.
Examination of the expression pattern of individual chemokines revealed distinct differences (Figure 1). Ltn mRNA was undetectable in resting PBLs but was dramatically induced early after stimulation of the cells with PMA plus ionomycin (PMA+Iono). Expression of Ltn mRNA remained robust for 24 hours and declined over the subsequent 48-hour time period examined (Figure 1B). The weaker induction of Ltn mRNA following cell stimulation with a combination of anti-CD3 and anti-CD28 (hereinafter termed anti–CD3/CD28) mAbs plus PMA was detectable at 2 hours, peaked at 6 hours, and declined thereafter. The expression profile of the chemokine MIP-1α was similar to that of MIP-1β after T-cell activation. Unlike Ltn, however, both methods of cell stimulation (PMA in the presence of either ionomycin or anti–CD3/CD28 mAb) were equivalent in their ability to induce MIP-1α and MIP-1β, and the attenuation of mRNA expression was less dramatic over time. Similarly, IL-8 mRNA was up-regulated by stimulation, but peak responses were observed 24 hours after stimulation. Although the magnitude of these differences was donor dependent, the pattern of sensitivity to the method of stimulation and to the response time was similar among the donors examined.
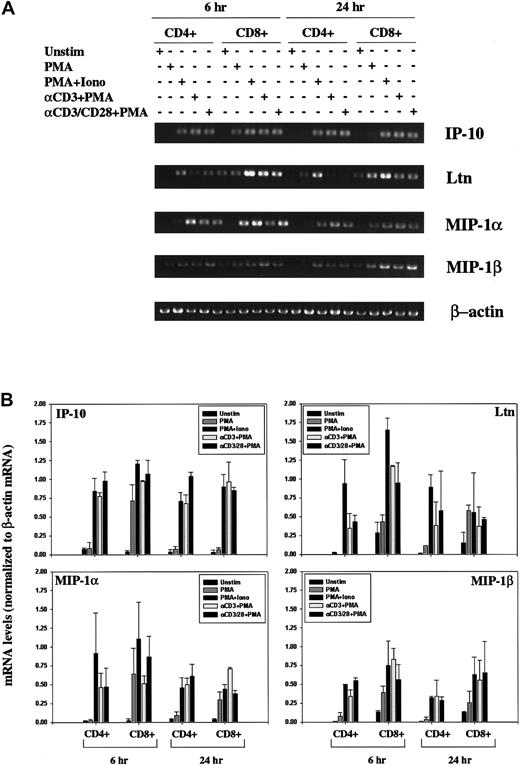
Isolated human PBLs contained low levels of contaminating natural killer (NK) cells and monocytes (as discussed in “Materials and methods”). We therefore isolated CD4+ and CD8+ T cells and again stimulated the cells using antibodies specific for the CD3 and CD28 cell surface receptors to rule out the possibility that the induced chemokine expression patterns were mediated by the Fc-receptors. As with the induction pattern noted using human PBLs, we observed an increase in IP-10, Ltn, MIP-1α, and MIP-1β mRNA in response to all stimulation conditions examined, at 6 hours and at 24 hours (Figure 2). Induction profiles were comparable in CD4+ and CD8+ T cells.
Modulation of chemokine gene expression following T-cell activation.
(A) Human CD4+ and CD8+ T lymphocytes were unstimulated or stimulated for 6 hours or 24 hours PMA, PMA+Iono, soluble anti–(α-)CD3 mAb plus PMA, or α-CD3 plus soluble α-CD28 mAb plus PMA, as indicated. Total RNA was prepared using Trizol, quantitated using OD260, and analyzed by RT-PCR using IP-10, Ltn, MIP1α, MIP1β, and β-actin–specific primers, as outlined in “Materials and methods.” (B) IP-10, Ltn, MIP1α, and MIP1β bands were quantitated and values normalized to β-actin mRNA levels using ImageQuant software and are graphically represented. Shown are mean values ± SEMs of 2 experiments performed using isolated CD4+ and CD8+ T lymphocytes from different human donors.
Induction of Ltn and MIP-1β mRNA expression and cyclosporine-dependent inhibition
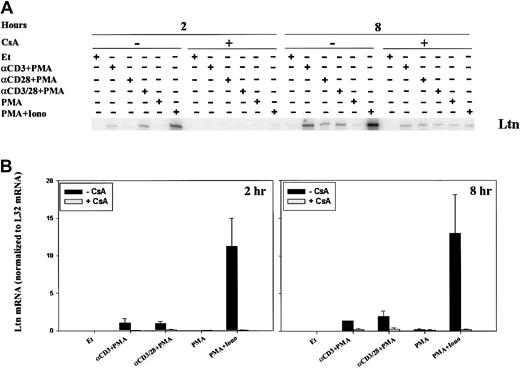
Because the time course for and relative intensity of chemokine mRNA induction differed, we sought to examine the regulation of mRNA expression. CsA and FK506 are robust inhibitors of the serine-threonine phosphatase activity of calcineurin, and, though calcineurin is known to inhibit cytokine induction, its role in chemokine regulation is less well appreciated. In addition, CsA and tacrolimus are commonly used in solid organ and stem cell transplantation, and an understanding of their effect on chemokine induction could have practical implications. For these reasons, we examined the effect of calcineurin inhibition on the expression of lymphotactin (Ltn) after T-cell activation. Two-hour stimulation of human PBLs with anti-CD3 mAb, anti–CD3/CD28 mAbs, or ionomycin, each in the presence of PMA, resulted in increased Ltn mRNA levels (Figure3), as previously observed. Neither PMA alone nor anti-CD28 plus PMA stimulation of human PBL for 2 hours was found to significantly alter the levels of Ltn mRNA (Figure 3A), despite the fact that the latter stimulatory condition is competent to induce T-cell proliferation (data not shown). Ltn mRNA induction was inhibited by 0.5-hour pretreatment of the cells with CsA (Figure 3, left panels). At 8 hours, all conditions of stimulation competent to induce T-cell proliferation (anti-CD3 + PMA, anti-CD28 + PMA, anti–CD3/CD28 + PMA, PMA+Iono), but not PMA alone, resulted in increased Ltn levels (Figure 3, right panels). Induction of Ltn mRNA remained dependent on calcineurin activity. Notably, the addition of anti-CD28 mAb did not overcome cyclosporine sensitivity.
Calcineurin- and activation-dependent regulation of Ltn mRNA in human peripheral blood T cells.
Ltn mRNA levels in human PBLs were assessed by RPA. Cells were treated for 2 and 8 hours with ethanol diluent, anti-CD3 mAb (α-CD3) plus PMA, anti-CD28 mAb (α-CD28) plus PMA, anti-CD3 and ant-CD28 mAb (αCD3/28) plus PMA, PMA alone, or PMA+Iono, in the absence or presence of CsA as indicated. Total RNA was prepared (Figure 1) and RPA carried out as outlined (“Materials and methods”). (A) Results of 1 of 3 separate experiments, each using cells from different donors, are shown. (B) Ltn bands were quantitated and values were normalized to L32 mRNA levels using ImageQuant software; mean values ± SEMs of 3 experiments are graphically represented. Differences between Ltn mRNA following PMA+Iono stimulation were significantly different (P < .01) from baseline at 2 and 8 hours.
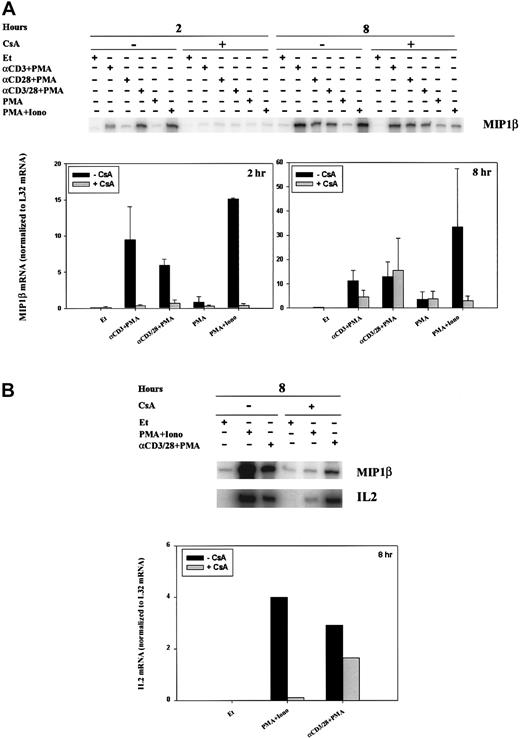
The pattern of stimulation for MIP-1β mRNA paralleled that of Ltn at 2 hours (Figure 4A, left panel) and 8 hours (Figure 4A, right panel; Figure 4B), and mRNA induction was inhibited by pretreatment of the cells with CsA. Activation of classical forms of protein kinase C by incubation with PMA only minimally induced MIP-1β mRNA at 2 hours (Figure 4A, left panel) and 8 hours (Figure 4A, right panel). This small increase in MIP-1β mRNA was not inhibited by CsA treatment, consistent with the inability of CsA to affect protein kinase C activity (Figure 4A). When cells were stimulated for 2 hours with anti-CD3 plus PMA, anti-CD28 plus PMA, anti–CD3/CD28 plus PMA, or PMA+Iono (Figure 4A, left panel), MIP-1β levels increased; this increase was attenuated by CsA pretreatment. Cells similarly stimulated for 8 hours showed up-regulated MIP-1β mRNA levels (Figure 4A, right panel; Figure 4B); however, sensitivity to inhibition by CsA remained evident only in cells treated with PMA+Iono. Like MIP-1β levels, IL-2 mRNA levels, as expected, were increased by cell stimulation at 8 hours (Figure 4B). Although CsA inhibited the ability of PMA and ionomycin (calcium–calcineurin-dependent stimulation) to induce IL-2 mRNA at 8 hours, the addition of anti-CD28 mAb to anti-CD3 plus PMA essentially reversed the ability of CsA to inhibit IL-2 mRNA.
Calcineurin- and activation-dependent regulation of MIP-1β and IL-2 mRNA.
MIP-1β (A-B) and IL-2 (B) mRNA levels were assessed by RPA in human PBLs. (A) Cells were treated for 2 and 8 hours with ethanol diluent, α–CD3+PMA, α–CD28+PMA, α–CD3/28+PMA, PMA, or PMA+Iono (Figure2) in the absence or presence of CsA as indicated. (B) Cells were treated for 8 hours with ethanol diluent, α–CD3/28+PMA, or PMA+Iono in the absence or presence of CsA as indicated. Results of 1 of 3 separate experiments, each using cells from different donors, are shown.
Regulation of MIP-1α and IL-8 mRNA expression
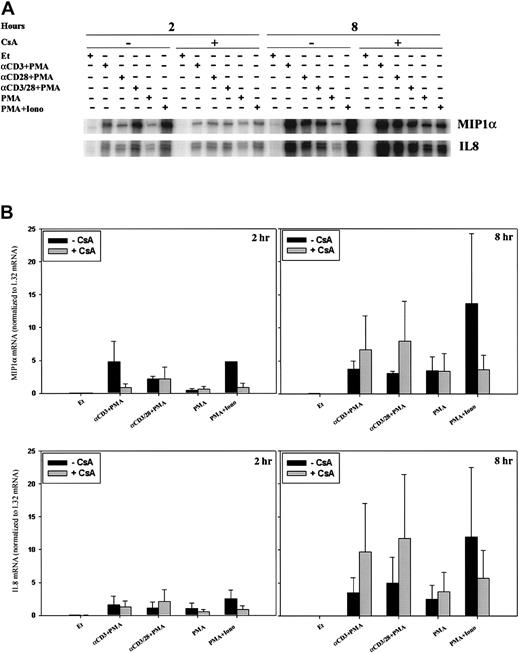
Expression profiles for MIP-1α and IL-8 differed, in part, from those discussed above. Uniquely, MIP-1α mRNA was modestly induced by anti-CD28 mAb plus PMA within 2 hours of stimulation in a CsA-insensitive fashion (Figure 5A, left panel). Two-hour stimulation with anti-CD3 plus PMA and PMA+Iono also induced MIP-1α; however, this induction was CsA sensitive. Furthermore, by 8 hours after stimulation, MIP-1α mRNA induction was essentially calcineurin independent (Figure 5A, right panel).
Differential regulation of MIP-1α and IL-8 mRNA.
MIP-1α and IL-8 mRNA levels were assessed by RPA in human PBLs. Cells were treated as in Figure 2. (A) Results of 1 of 3 separate experiments, each using cells from different donors, are shown. (B) MIP-1α and IL-8 bands were quantitated, and mean values ± SEMs normalized to L32 mRNA levels using ImageQuant software are graphically represented.
The time course for the induction of IL-8 mRNA was slower than that for MIP-1α. At 2 hours, only minimal IL-8 mRNA up-regulation was noted (Figure 5B, left panel). After 8 hours and under all stimulatory conditions, however, a more significant increase in IL-8 mRNA levels was noted (Figure 5B, right panel), and this induction was calcineurin independent. Calcineurin inhibition appeared to enhance IL-8 mRNA stimulated by anti-CD3 mAb in the presence of PMA or anti-CD28 plus PMA in certain donors, but this was not reproducibly found in all donors examined.
Modulation of IP-10 gene expression by immunosuppressive agents
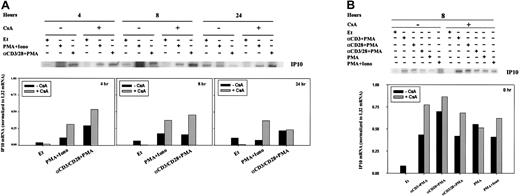
To determine whether the transcription of other chemokines was regulated by CsA, we sought to extend our initial observations of T-cell activation-dependent modulation of IP-10 gene expression (Figure1A). RPA analyses (Figure 6) were verified using RT-PCR (Figure 7). At both 4 and 8 hours, IP-10 mRNA was minimal and often indistinct by RPA (Figure 6A); CsA treatment did not affect the transcription of IP-10 in any stimulation condition (Figure 6). Twenty-four hours after stimulation, however, IP-10 mRNA levels appeared reduced in comparison with PBLs cultured in ethanol diluent alone (Figure 6A).
Regulation of IP-10 mRNA by CsA.
IP-10 mRNA levels were assessed by RPA in human PBLs. (A) Cells were treated for 4, 8, and 24 hours with ethanol diluent, PMA+Iono, anti-CD3, or anti-CD28 mAb (α-CD3/28) plus PMA, in the absence or presence of CsA as indicated. (B) Cells were treated for 8 hours with ethanol diluent, α–CD3+PMA, α–CD28+PMA, α–CD3/28+PMA, PMA, or PMA+Iono in the absence or presence of CsA as indicated. RPA was carried out as outlined in “Materials and methods.” IP-10 bands were quantitated and values normalized to L32 mRNA levels using ImageQuant software and are graphically represented. Results of 1 of 3 representative experiments, performed using human PBLs from different human donors, are shown.
Regulation of IP-10 mRNA by CsA, FK506, and rapamycin.
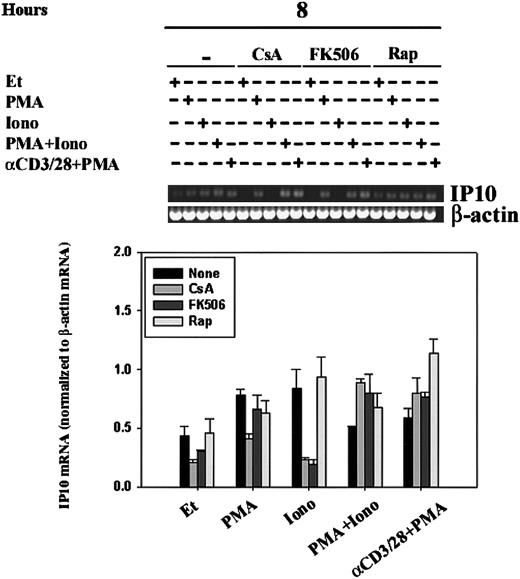
IP-10 mRNA levels were assessed by RT-PCR in human PBLs. Human PBLs were stimulated for 8 hours with ethanol diluent, PMA, Iono, PMA+Iono, or α–CD3/28+PMA in the absence or presence of CsA, FK506, or rapamycin (Rap). RT-PCR, using IP-10– and β-actin–specific primers, was carried out as outlined in “Materials and methods.” (A) Results of 1 experiment representative of 2 performed using human PBLs from different human donors are shown. (B) IP-10 bands were quantitated, and mean values ± SEMs of 2 experiments normalized to β-actin mRNA levels using ImageQuant software are graphically represented. Ionomycin-driven attenuation of IP10 mRNA by CsA and FK506, but not that of rapamycin, was significant (P < .05).
Like CsA, the immunosuppressive agent tacrolimus (FK506) binds to and inhibits the phosphatase activity of calcineurin, but its action is dependent on binding to FKBPs, a different family of immunophilin receptors than that which binds CsA. Sirolimus (rapamycin), a structural homologue of tacrolimus, also binds to FKBPs but fails to inhibit calcineurin; the molecular target of sirolimus is the mammalian target of rapamycin (mTOR).41 To verify our findings of the regulation of IP-10 expression, as measured by RPA, and to define the role of immunophilins and of calcineurin in the regulation of IP-10 mRNA transcription, we compared human PBLs stimulated in the absence and presence of CsA, FK506, or rapamycin (Figure 7). IP-10 mRNA transcription was driven by treatment with the calcium-ionophore ionomycin alone for 8 hours; this transcription was significantly (P < .05) attenuated by pretreatment of cells with CsA and FK506 but not rapamycin, suggesting the involvement of calcineurin in the signaling pathways leading to IP-10 gene expression. PMA was able to bypass this calcineurin-sensitivity as demonstrated by cells that were stimulated with PMA+Iono or anti–CD3/CD28 plus PMA and were found to be CsA- and FK506-insensitive. Together, our data reflect that IP-10 gene expression is subject to complex regulatory control involving calcineurin-dependent and -independent signaling pathways.
Induction of Ltn, MIP-1β, and IL-8 protein expression and cyclosporine sensitivity
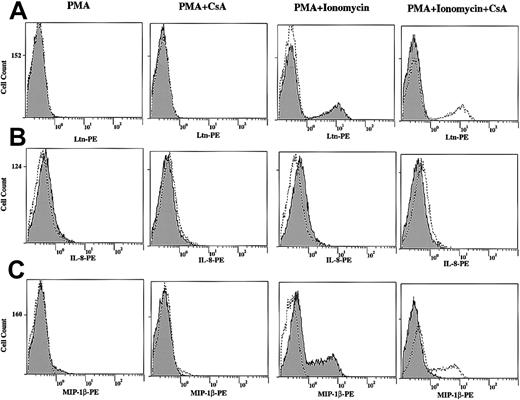
We next measured chemokine protein levels following T-cell stimulation by direct immunofluorescence. Although the protein levels of Ltn (Figure 8A) and MIP-1β (Figure8C) were unchanged after 12-hour stimulation of human PBLs with PMA alone, both increased in response to PMA+Iono (Figure 8A), consistent with the mRNA induction profiles noted (Figures 1, 3, and 4). Further, cells that were pretreated with CsA showed decreased Ltn and MIP-1β protein expression, consistent with the CsA dependence of mRNA regulation noted. By contrast, IL-8 (Figure 8B) and MIP-1α (data not shown) protein levels were minimally changed by 12-hour stimulation with PMA or PMA+Iono in the presence or absence of CsA (Figure 8B and data not shown), consistent with the late (8-hour) appearance of mRNA (Figure 4).
Increased Ltn, IL-8, and MIP-1β total protein levels in stimulated human T lymphocytes and inhibition by CsA.
Human PBLs were treated in the presence and absence of PMA (10 ng/mL) and PMA+Iono (1 μM) for 12 hours in the presence or absence of CsA (1 μM) as indicated. Cells were permeabilized, fixed, and labeled with PE-conjugated anti–human (A) Ltn mAb, (B) IL-8 mAb, and (C) MIP-1β mAb to measure chemokine protein expression by immunofluorescence. In each column labeled PMA and PMA+Ionomycin, unstimulated cells (dotted line/unshaded) are compared to PMA- and PMA+Ionomycin–treated (solid line/shaded) samples. Adjacent columns examine the effects of CsA on protein expression. Stimulated (PMA or PMA+Iono) cells (dotted line/unshaded) are compared to CsA-pretreated (solid line/shaded) samples.
Discussion
To date more than 50 chemokines have been identified that play a central role in the recruitment of leukocytes to sites of infection and inflammation.42-44 Chemokines share little sequence identity, but they demonstrate remarkable conservation of their 3-dimensional structure. Chemokines have been implicated in a variety of functions including angiogenesis, hematopoiesis, and organogenesis,35-37 and they initiate their effects by binding to G-protein–coupled serpentine receptors, of which 19 have been identified to date. Although it has been demonstrated that lymphocytes require stimulation to become responsive to chemokines,45 an observation attributed to chemokine receptor regulation, the concomitant regulation of chemokine expression by T-cell stimulation should not be understated. To this end, we sought to analyze chemokine transcriptional regulation in lymphocytes, potentially providing insight into their critical cellular functions. In addition, understanding of the response to immunosuppressive therapy may help to elucidate basic mechanisms of lymphocyte biology in solid organ and stem cell transplantation.
Cloned from human PBMCs stimulated with phytohemagglutinin, Ltn was identified as a novel chemokine belonging to a new class of chemokine termed the γ type or C class46 and later was shown to mediate chemotaxis through binding to the chemokine receptor XCR1.47 The induction of Ltn mRNA was rapid after T-cell activation (Figure 1). Stimulation by agents that bypassed cell surface receptors (PMA+Iono) resulted in more robust and more prolonged stimulation of Ltn mRNA than agents that engaged the TcR-CD3 complex and CD28 (anti–CD3/28+PMA); stimulation was sensitive to inhibition by CsA (Figure 3) and FK506 (data not shown), consistent with previous studies.47,48 Transcriptional activation of Ltn has been shown to be mediated by CsA-sensitive NFAT translocation, at least in part.47 Others have reported that CD28 costimulation down-regulates Ltn in human T cells,48 yet this decrease was noted after 4 and 7 days of stimulation. Our findings that CD28 costimulation does not change the induction of Ltn by anti-CD3 plus PMA at earlier time points (Figures 2, 3) is consistent with the findings of Olive et al.48 We found the transcription of mRNA encoding the CC chemokines MIP-1α and MIP-1β to be activation and calcineurin dependent (Figures 1, 4, and 5), consistent with previous findings.49 50
We have shown activation-dependent increases in the mRNA levels of the CXC chemokine IL-8, as was shown earlier,51 though the time of maximal induction was late (24 hours). Although IL-8 mRNA levels induced at 2 hours were insensitive to calcineurin inhibition, those at later time points (8 hours; Figure 5) were enhanced in certain donors in response to cyclosporine pretreatment. These findings suggest that calcineurin inhibition, as modeled by CsA (Figures 1, 5) and FK506 (data not shown) pretreatment, has different effects on IL-8 transcription that is dependent on the time of stimulation and on the stimulatory signal itself.
The interferon-γ (IFN-γ)–inducible 10-kDa CXC chemokine IP-10,52 expressed in lymphocytes, monocytes, keratinocytes, and endothelial cells,53,54 binds to the receptor CXCR3 to induce chemotaxis.55 56 Because CXCR3 is predominantly expressed on activated T lymphocytes, IP-10 has been implicated as a critical mediator of T-lymphocyte migration in IFN-γ and lipopolysaccharide-dependent T-cell immune responses. We found that the stimulation of human PBLs resulted in modest transcriptional activation of IP-10 mRNA at 4 and 8 hours and in activation that was unchanged with CsA (Figures 6, 7) and FK506 pretreatment (Figure 7). Modest increases in IP-10 mRNA levels resulted from cellular treatment with calcium ionophore (ionomycin) alone; at 8 hours, both CsA and FK506, but not sirolimus, inhibited IP-10 induction. The fact that pretreatment of the cells with FK506, but not sirolimus, mimicked the CsA response suggested that the effect was secondary to inhibition of calcineurin activity (Figure 7). Taken together, our data reflect a complex regulation of IP-10 gene expression that includes calcineurin-dependent and -independent pathways.
Although calcineurin is the only shared molecular target of the CsA-CyP and FK506-FKBP complexes identified to date, it remains possible that IP-10 is regulated not by calcineurin but by another, yet unknown, common target of CsA and FK506. The inability of sirolimus to mimic the effects of FK506 argues that binding to immunophilins (and, thereby, inhibition of cis-trans isomerase activity) is not the operative mechanism. Consistent with this notion, work by Matsuda et al57 demonstrated the ability of CsA and FK506 to exert their immunosuppressive effects not only by targeting calcineurin-dependent NFAT but also calcineurin-independent activation pathways for c-Jun N-terminal kinase (JNK) and p38; the specific target(s) of the drug/immunophilin complexes, however, were not identified. Subsequent analysis will confirm whether IP-10 is regulated by NFAT, by another calcineurin-dependent transcription factor (eg, NFκB,17 ELK-121), or by a calcineurin-independent, immunophilin-dependent target of CsA and FK506.
Chemokine and chemokine receptors have been observed to be transcriptionally induced during allograft rejection, and it has been suggested that they function as important regulators for the recruitment of leukocytes to allografts.40,58,59 For example, IL-8 has been shown to serve as a reliable marker for predicting allograft function in human lung transplantation,60 and the expression of IP-10 and its receptor CXCR3 were shown to be markedly increased during human cardiac allograft rejection.61 Moreover, differential expression of chemokines and chemokine receptors in rejecting human liver transplants has also been described.62 Our findings of the complex transcriptional regulation of IL-8 and IP-10 gene expression, through calcineurin-dependent and -independent pathways, offers insight into the regulatory mechanisms that may affect leukocyte recruitment into allografts and thereby rejection.
The IP-10 receptor, CXCR3, has been previously reported to be expressed at high levels on T-helper 0 (TH0) and TH1 cells and at low levels on TH2 cells.63 It has been proposed that chemokine receptors serve as markers of naive and polarized T-cell subsets and that their gene expression regulates tissue-specific migration of effector T cells.64 Recent studies have also shown that in addition to its role as an agonist for CXCR3, IP-10 can also serve as an antagonist for CCR3,65 a chemokine receptor expressed on TH2 cells.66Our findings therefore suggest that the modulation of IP-10 expression by several T-cell signaling events, including calcineurin-dependent pathways, may not only lead to enhanced chemotaxis of TH1 cells by CXCR3 but also to decreased migration of TH2 cells by CCR3. Further studies are necessary to verify similar transcriptional regulation of IP-10 in TH1 and TH2 cells compared to TH0 cells.
In addition to its predominant expression on T lymphocytes, CXCR3 has been found to be expressed on eosinophils.67 Like activated T cells, IP-10 was found to induce eosinophil chemotaxis through CXCR3. In addition, IP-10–induced chemotaxis was up-regulated by IL-2 and down-regulated by IL-10. Jinquan et al67showed corresponding up- and down-modulation of CXCR3 expression by IL-2 and IL-10, respectively, and thus concluded that regulation was achieved by receptor modulation. In light of our current findings, we cannot rule out the possibility that endogenous IP-10 levels are also modulated by IL-2 or IL-10 and thus contribute, in part, to the enhanced and attenuated chemotaxis activity observed previously.
Other identified CXC chemokines that function as ligands for CXCR3 include monokine induced by IFN-γ (MIG) and IFN-inducible T-cell α–chemoattractant (ITAC).42-44 Like IP-10, MIG and ITAC can induce chemotaxis through CXCR3 and can function as antagonists for the CCR3 receptor.65 Future studies will determine whether the signaling pathways that regulate IP-10 also serve to up-regulate MIG and ITAC and whether these 3 chemokines share a common mechanism to regulate CXCR3-mediated chemotaxis.
The mRNA and protein levels of various chemokines have been shown to be up-regulated in the inflammatory infiltrate of several diseases.44 Of particular interest, IP-10 expression was found up-regulated in sarcoidosis, glomerulonephritis, atherosclerosis, psoriasis, and viral meningitis, suggesting a critical role of IP-10 in the control of leukocyte recruitment in these inflammatory diseases. Leukocyte recruitment mediated, in part, by IP-10 has also been observed in the lungs of HIV-infected patients.68 Agostini et al68 demonstrated that pulmonary T cells expressing CXCR3 have a high migration capability in response to IP-10 and proposed that IP-10 contributes significantly to the accumulation of HIV-specific pulmonary cytotoxic T lymphocytes. Our findings offer a mechanism of transcriptional regulation of IP-10 by T-cell signaling pathways, mediated by calcineurin, that may provide insight into the regulatory signals by which IP-10 controls leukocyte migration to the lungs of HIV-infected patients and, generally, to sites of inflammation.
We thank Howard Young for helpful discussions and Kai Chang for technical assistance.
Prepublished online as Blood First Edition Paper, August 15, 2002; DOI 10.1182/blood-2002-03-0697.
The publication costs of this article were defrayed in part by page charge payment. Therefore, and solely to indicate this fact, this article is hereby marked “advertisement” in accordance with 18 U.S.C. section 1734.
References
Author notes
Barbara E. Bierer, Dana 810, Dana-Farber Cancer Institute, 44 Binney St, Boston, MA 02115; e-mail:barbara_bierer@dfci.harvard.edu.

This feature is available to Subscribers Only
Sign In or Create an Account Close Modal