Abstract
A subset of blood mononuclear cells from patients with chronic lymphocytic leukemia (CLL) can differentiate in vitro into “nurselike” cells (NLCs) that can protect CLL cells from apoptosis. NLCs express cytoplasmic vimentin and stromal-derived factor 1 (SDF-1). NLCs also express CD14, as well as CD11b, CD33, CD40, CD45RO, CD68, CD80, CD86, HLA-DQ, and HLA-DR, but not CD1a, CD2, CD3, CD11c, CD19, CD45RA, CD83, CD106, or CD154. Consistent with this phenotype, NLCs failed to differentiate from blood mononuclear cells that were depleted of CD14+ cells or from isolated CD19+cells. CD14+ blood cells of healthy donors could differentiate into cells with the morphology and phenotype of NLCs when cultured in direct contact with CLL B cells, but not with normal B cells. Despite expressing antigens in common with blood monocytes, monocyte-derived dendritic cells, and macrophages, NLCs expressed significantly higher levels of CD68 than these other cell types. Consistent with the notion that NLCs are present in vivo, CD14+ splenocytes from CLL patients have NLC morphology and express significantly higher levels of CD68 than CD14+splenocytes from persons without known B-cell malignancy. These findings indicate that although NLCs may differentiate from blood monocytes, they probably represent a distinctive hematopoietic cell type that exists in vivo, differentiates from hematopoietic CD14+ cells in the context of CLL, and in turn protect CLL cells from apoptosis via a mechanism that is independent of CD106 (vascular cell adhesion molecule-1). The interaction between CLL cells and NLCs may represent a novel target for therapy of patients with this disease.
Introduction
B-cell chronic lymphocytic leukemia (CLL) is characterized by the steady accumulation of long-lived, monoclonal B cells in the blood, secondary lymphoid tissues, and marrow.1 The leukemia cells primarily are arrested in the G0/G1 phase of the cell cycle and are resistant to programmed cell death.2-4 Despite their apparent longevity in vivo, CLL cells often undergo spontaneous apoptosis under conditions that support the growth of human B-cell lines in vitro.2,5 This implies that such ex vivo conditions lack essential survival factors and that the resistance to apoptosis is not intrinsic to the CLL cell.5-8
Recently we found that a subset of blood mononuclear cells from patients with CLL could differentiate in vitro into large, round, adherent cells that attracted leukemia cells and protected them from undergoing apoptosis in vitro.9 Moreover, when CLL cells were removed from such adherent cells, the CLL cells experienced a rapid decline in viability unless replated onto the adherent cells.
The effect of these adherent cells on CLL B-cell viability was mediated in part by the chemokine stromal-derived factor 1 (SDF-1), as demonstrated by the ability of synthetic SDF-1 to protect CLL cells from apoptosis after their removal from the adherent cells.9 Moreover, this influence over CLL cell viability required cell-cell contact and could not be mimicked by coculture in conditioned media. Because these cells attracted CLL cells and supported their survival through a contact-dependent mechanism, we called them “nurselike” cells, or NLCs.
Our prior studies found that NLCs expressed vimentin and SDF-1, but lacked expression of surface antigens found on T cells, B cells, or mature dendritic cells. Moreover, NLCs did not share cytogenetic alterations associated with the leukemia cell clone, indicating that they were derived from a distinct cell lineage. In this study, we performed immune phenotypic analyses of NLCs and examined whether blood cells from healthy donors could differentiate into NLCs that could sustain CLL cell viability in vitro.
Materials and methods
Cell preparation
After obtaining informed consent, blood samples were collected from patients at the University of California San Diego (UCSD) Medical Center with diagnostic and immunophenotypic criteria for B-cell CLL. The patients were not treated previously and had not received recombinant growth factors or exogenous cytokines. Blood mononuclear cells were isolated by density-gradient centrifugation over Ficoll-Hypaque (Pharmacia, Uppsala, Sweden). The mononuclear cells were used fresh or suspended in fetal calf serum (FCS) containing 5% dimethyl sulfoxide (DMSO) for storage in liquid nitrogen. The viability of the CLL cells was always more than 85% at the initiation of the cell culture, as determined by their ability to exclude propidium iodide (PI). For this the cells were suspended in 5 μg/mL PI (Molecular Probes, Eugene, OR) for 15 minutes at 37°C and then evaluated via flow cytometry. All CLL cell samples examined contained more than 90% CLL B cells, as assessed by flow cytometric analysis using fluorochrome-conjugated anti-CD19, anti-CD5, and anti-CD3 monoclonal antibodies (mAbs; Pharmingen, San Diego, CA). CLL cells were cultured at 37°C in 5% CO2 in media consisting of RPMI-1640 (Gibco BRL, Rockville, MD), containing 10% FCS and penicillin-streptomycin-glutamine (culture medium).
Human blood monocytes and B cells were purified from healthy donor buffy-coat blood samples obtained from the San Diego Blood Bank (San Diego, CA). Mononuclear cells isolated by density-gradient centrifugation were suspended in RPMI medium. B cells were isolated using RosetteSep B-cell enrichment cocktail (Stemcell Technologies, Vancouver, BC). Purity of isolated B cells was more than 90% as assessed by flow cytometric analysis using fluorochrome-conjugated anti-CD19 mAb. To isolate monocytes, we suspended the blood mononuclear cells in culture medium and then plated them onto 125/20 mm culture dishes (Greiner Laborechnik, Frickenhausen, Germany) at 37°C in 5% CO2 for 4 hours. Adherent cells were harvested by incubating adherent cells in trypsin/EDTA solution (Gibco BRL) at 37°C in 5% CO2 for 10 minutes and then physically removing them from the culture plates using a sterile disposable cell scraper (Greiner Laborechnik). The harvested cells then were depleted of contaminating cells by adding saturating amounts of “Dynabeads” coated with anti-CD2 or anti-CD19 mAbs (Dynal AS, Oslo, Norway) that then were removed using a strong magnetic field. More than 90% of such harvested cells expressed CD14, as assessed by flow cytometry (data not shown).
Monocyte-derived dendritic cells were prepared by culturing isolated monocytes in culture medium supplemented with 20 ng/mL recombinant human granulocyte-monocyte colony-stimulating factor (GM-CSF) and 10 ng/mL interleukin-4 (IL-4) (Pharmingen) for 7 days. Tumor necrosis factor-α (TNF-α) was added to a final concentration of 10 ng/mL during the final day in culture and then the cells were analyzed 24 hours later by flow cytometry.
Macrophages were prepared by culturing isolated blood monocytes in the presence of 50 ng/mL recombinant human monocyte colony-stimulating factor (M-CSF; R & D Systems, Minneapolis, MN) for 7 days. NLCs, monocyte-derived dendritic cells, or macrophages were harvested for flow cytometric analysis by treating adherent cells with ATV solution at 37°C in 5% CO2 for 10 minutes and then scraping off the culture plates with disposable cell scraper (Greiner Laborechnik).
Mononuclear cells were isolated from the spleens of patients with CLL or from patients with immune thrombocytopenic purpura who did not have associated CLL or other lymphoproliferative diseases. For this, sections of spleens removed for medical indications were teased apart in sterile media, allowing us to isolate single-cell suspensions. After washing the cells thrice, splenic mononuclear cells were isolated via Ficoll-Hypaque density-gradient centrifugation, washed, and then suspended in FCS containing 10% DMSO for freezing and subsequent storage in liquid nitrogen. Splenocytes were thawed, as described for frozen blood mononuclear cells, and then placed in plastic culture dishes in culture medium and placed at 37°C in 5% CO2 in air. After 2 days, the nonadherent cells were removed and the remaining cells stained with May-Giemsa for evaluation via microscopy or with fluorochrome-labeled mAbs for analysis by immunofluorescence microscopy or flow cytometry.
Antibodies
Monoclonal antibodies specific for CD3, CD14, CD19, CD33, CD45, CD80, CD86, CD106, or HLA-DR, and the relevant isotype control mAbs were purchased from Pharmingen. The mAb specific for CD1a (T6) was purchased from Coulter (Miami, FL) and mAbs specific for CD45RA or CD45RO were obtained from Caltag (Burlingame, CA). The mAbs specific for vimentin (V9) or CD68 (EBM11) were purchased from DAKO (Glostrup, Denmark). Fluorescein-labeled anti-mouse IgG1 (Pharmingen) was used as secondary antibody with unlabeled anti-CD68. MA2.1 is an IgG1 mouse mAb specific for the class I major histocompatibility complex (MHC) allele HLA-A2,10 and W6/32 is an IgG1 mouse mAb specific for a nonpolymorphic determinant common to all human class I MHC antigens.11
Immunofluorescence microscopy
Blood mononuclear cells or splenocytes were cultured on Lab-Tek chambered cover glass (Nalge Nunc International, Naperville, IL) at approximately 1 × 10⁷/mL for 10 to 14 days (blood cells) or 1 to 2 days (splenocytes) prior to immunofluorescence analysis for expression of CD14, CD19, CD68, or vimentin. Cells were stained with fluorescein isothiocyanate (FITC)–labeled anti-CD14 and phycoerythrin (PE)–labeled anti-CD19 or anti-CD14 mAbs, as indicated in the text. Cytoplasmic staining with mAbs specific for CD68 or vimentin was achieved by fixing the cells with formaldehyde and then treating them with saponin, using Cytofix/Cytoperm Kit (Pharmingen), as per the manufacturer's instructions. The fixed and permeabilized cells then were incubated with specific or control antibodies, washed, and then counterstained with FITC-labeled anti–mouse IgG mAb to detect cell-bound mouse antibody. Hoechst 33258 (Sigma Chemicals, St Louis, MO) was used to stain the nuclei. Optical sections of fluorochrome-labeled cells were captured with a Delta-Vision deconvolution microscope system (Applied Precision, Issaquah, WA) of the Digital Imaging Core of the UCSD Cancer Center. In general, sections were spaced by 0.3 mm, and image stacks were deconvoluted using Applied Precision SoftWoRx software, and then rendered as volumes. Images were captured using a × 60 Nikon oil lens (Nikon, Melville, NY) with filters specific for blue, green, or red fluorescence. Morphologic analysis was performed using a Nikon confocal microscope (Nikon) with a × 20 objective lens.
Flow cytometry
Cells were stained with saturating amounts of antibody for 30 minutes at 4°C in RPMI 1640 supplemented with 0.5% bovine serum albumin (fluorescence-activated cell sorter [FACS] buffer), washed 2 times, and then analyzed on a FACS Calibur (Becton Dickinson, Mountain View, CA). For cytoplasmic staining, the cells were fixed with formaldehyde and then treated with saponin to permeabilize the membrane. The cells then were incubated with specific or control antibodies, washed, and then counterstained with FITC-labeled antimouse immunoglobulin. Flow cytometry data were analyzed using the FlowJo software (Tree Star, San Carlos, CA).
To sort cells that expressed high levels of CD14, fresh blood mononuclear cells from healthy donors were labeled with PE-conjugated anti-CD14 antibody at 4°C for 30 minutes, washed, and then suspended in FACS buffer. CD14bright cells were isolated using a FACSVantage (Becton Dickinson). Analyses of the sorted cells revealed that more than 95% of the cells expressed high levels of CD14.
Magnetic depletion or isolation of cells
Isolated blood mononuclear cells were incubated with saturating amounts of Dynalbeads coated with anti-CD2 or anti-CD14 mAbs (Dynal). Bead-bound cells were removed using a strong magnetic field. CD19+ cells were isolated using Dynalbeads coated with anti-CD19 mAb. Isolated bead-bound CD19+ cells were detached from the microspheres using DETACHaBEAD CD19 (Dynal), as per the manufacturer's instructions. Following depletion or enrichment, the cells were examined via flow cytometry. Less than 0.5% of the CD2- or CD14-depleted cells were CD2+ or CD14+, respectively, whereas 99% of the CD19-isolated cells were CD19+, as assessed via flow cytometry.
Measurement of cell viability
Determination of CLL cell viability in this study is based on the analysis of mitochondrial transmembrane potential (ΔΨm) by 3,3′-dehexyloxacarbocyamine iodine (DiOC6) and cell membrane permeability to PI, as described.12 For viability assays, 100 μL of the cell culture was collected at the indicated time points and transferred to polypropylene tubes containing 100 μL 60 nmol/L DiOC6(Molecular Probes) and 10 μg/mL PI (Molecular Probes) in FACS buffer. The cells then were incubated at 37°C for 15 minutes and analyzed within 30 minutes by flow cytometry using a FACSCalibur (Becton Dickinson). Fluorescence was recorded at 525 nm (FL-1) for DiOC6 and at 600 nm (FL-3) for PI.
Statistical analysis
Results are shown as mean ± SD of at least 3 experiments each. For statistical comparison between multiple groups, the Bonferroni t test was used. Analyses were performed using the Glanzman “Primer of Biostatistics” software (McGraw-Hill, New York, NY).
Results
Surface phenotype of NLCs from the blood of patients with CLL
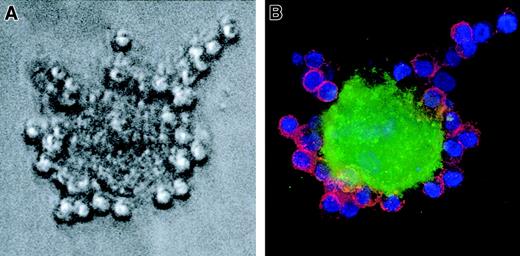
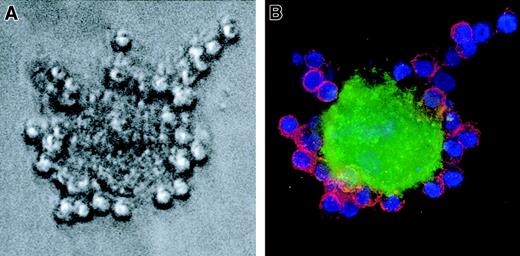
Blood mononuclear cells from patients with CLL can develop into NLCs after several days in vitro. One to 2 weeks after plating blood mononuclear cells onto plastic culture dishes, NLCs formed a sparse monolayer of large, round, and sometimes binucleate cells. Around such NLCs were clusters of leukemia B cells (Figure1A). Immunofluorescence studies demonstrated that the large NLCs stained with anti-CD14 mAb, whereas the leukemia B cells expressed CD19 (Figure 1B).
NLCs express CD14.
Whole blood mononuclear cells from a patient with CLL were cultured for 14 days in a chambered microscope slide. (A) A very large, round NLC is seen surrounded by smaller leukemia B cells by phase contrast microscopy. (B) The same cell is seen by immunofluorescence microscopy to bind FITC-labeled mAbs specific for CD14 (green fluorescence), whereas the small leukemia B cells bind PE-labeled mAb specific for CD19 (red fluorescence). The nuclei of the leukemia B cells have the blue fluorescence of Hoechst 33258. The Hoechst staining of the NLC nucleus is less evident because of the confocal plane in which the photograph was made.
Nonadherent cells were removed from 2-week-old cultures by vigorous pipetting and the remaining adherent cells were harvested for analyses by flow cytometry. The NLCs typically had high forward and side-angle light scatter, consistent with their large size (Figure2, upper left panel). These cells expressed CD14, in addition to CD45 and HLA-DR, but not CD3 (Figure 2). CD106 (vascular cell adhesion molecule 1 [VCAM-1]) was not detected on the NLCs in 6 separate experiments. These results indicate that NLCs express CD45, a surface marker of hematopoietic cells, and surface antigens in common with blood monocytes.
Phenotype of NLCs.
Cells were harvested after 14 days of culture and analyzed by flow cytometry. The upper left panel depicts a scatter plot of the side-angle (y-axis) and forward-angle (x-axis) light scatter of leukemic lymphocytes or NLCs, as indicated by the arrows. The dots within the broken line represent the light scatter of individual NLCs. The other panels depict the logarithmic fluorescence intensity (x-axis) of cells of gated NLCs stained with fluorochrome-conjugated isotype control mAbs of irrelevant specificity (open histograms) or a fluorochrome-conjugated mAb specific for a defined surface antigen (shaded histogram), as indicated in the upper right-hand corner of each panel.
NLCs fail to differentiate from blood mononuclear cells depleted of CD14+ cells
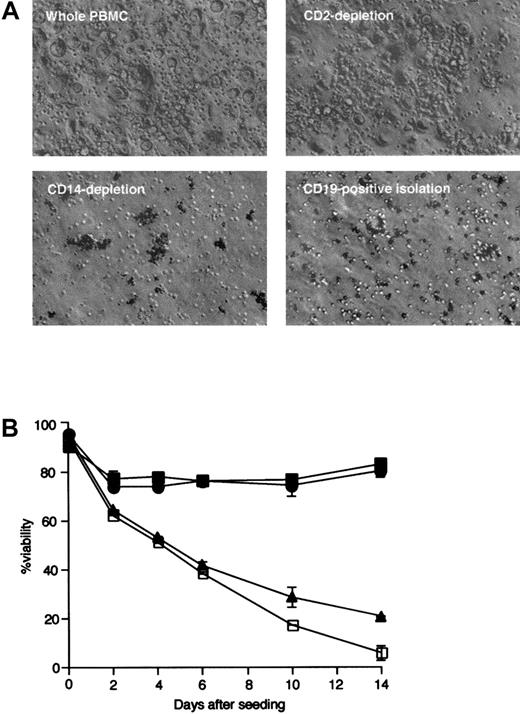
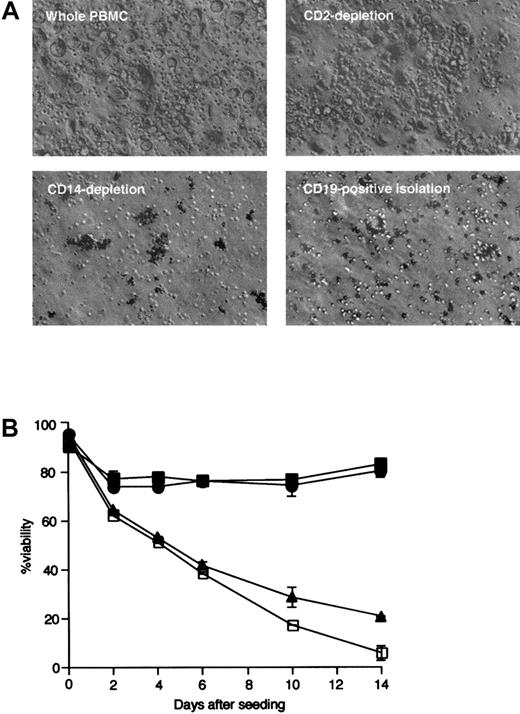
Blood mononuclear cells were depleted of either CD14+or CD2+ cells, or enriched for CD19+ cells, prior to initiation of long-term culture. The viability of leukemia cells in each population was compared to that of leukemia cells cultured with nonsorted mononuclear cells. Cultures of mononuclear cells depleted of CD14+ cells did not generate typical NLCs, as assessed by phase contrast microscopy (Figure3A, lower left). The appearance of such cell cultures mimicked that of isolated CD19+ leukemia cells cultured without NLCs (Figure 3A, lower right). In contrast, when cultured with CLL cells, the cells depleted of CD2+ cells generated NLCs that were identical to the NLCs that developed in the nonsorted blood mononuclear cells of patients with CLL (Figure 3A, upper panels).
Phase contrast microscopic appearance of NLC and leukemia B cells.
(A) Large, round NLCs surrounded by smaller round leukemia B cells could be seen in cultures of nonseparated (upper left) or CD2-depleted (upper right) blood mononuclear cells of patients with CLL. These cells were not observed in cultures of CD14-depleted mononuclear cells (lower left) or in cultures of isolated CD19+ cells (lower right). (B) Leukemia cell viability was monitored over time in cultures of isolated CD19+ cells (■) or of CD2-depleted (●), CD14-depleted (▴), or nondepleted (▪) blood mononuclear cells. Error bars indicate the SE about the mean of triplicate wells.
Figure 3B depicts the viability of cultured CLL-blood mononuclear cells depleted of CD2+ cells, CD14+ cells, or cells enriched for CD19+ B cells. Leukemia cell viability declined significantly over time in cultures depleted of CD14+ cells, but not in cultures depleted of CD2+ cells. The viability of CLL B cells (isolated CD19+ cells) was similar to that of leukemia cells cultured with mononuclear cells depleted of CD14+ cells. These data indicate that NLCs differentiate from cells that express CD14 at the initiation of cell culture.
CD14+ cells from nonleukemic donors can differentiate into NLCs
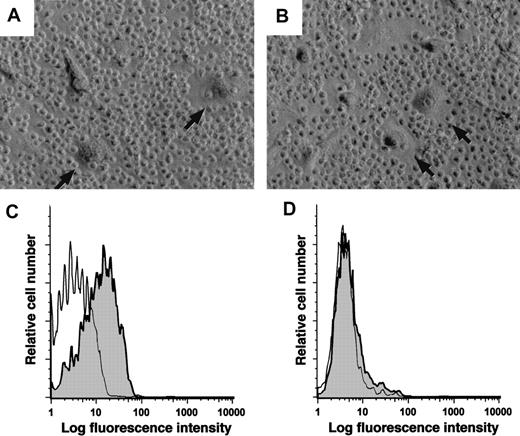
To determine whether CD14+ cells from blood mononuclear cells of nonleukemic donors can differentiate into NLCs, we isolated the CD14+ blood cells from a healthy donor and cultured these cells either alone or with the sorted CD19+ leukemia cells of a patient with CLL. Figure4 shows the phase contrast microscopic appearance of such cultures after 14 days. The adherent cells that differentiated in cocultures of normal CD14+ cells and leukemia B cells (Figure 4B) were similar to NLCs that differentiated from the nonsorted mononuclear cells of CLL patients (Figure4A).
Monocytes from healthy donors can differentiate into NLCs.
(A) Blood mononuclear cells from a patient with CLL were cultured for 14 days to allow for outgrowth of NLCs (arrows). (B) CD14+mononuclear cells were isolated from the blood of a healthy donor and then cultured with sorted CD19+ leukemia cells of a patient with CLL. This resulted in the outgrowth of large round adherent cells (arrows) that had the same morphology as that of NLCs. (C-D) Logarithmic fluorescence histograms of cells stained with a fluorochrome-conjugated MA2.1, a mAb specific for HLA-A2 (shaded histograms), or a fluorochrome-conjugated isotype control mAb of irrelevant specificity (open histograms). Panel C depicts the fluorescence of stained NLCs that developed from the nondepleted blood mononuclear cells of an HLA-A2+ patient with CLL. Panel D presents the fluorescence of NLCs that developed in cultures of CD19+ cells of an HLA-A2+ CLL patient cocultured with the CD14+ blood mononuclear cells of a healthy donor who was negative for HLA-A2. The data shown are representative of 3 different experiments.
We examined whether NLCs were derived from CD14+ cells of the healthy donor. For this we established cultures of CD14+ healthy donor cells and CD19+ CLL cells of HLA-disparate individuals. The NLCs that differentiated from the nonsorted blood mononuclear cells of an HLA-A2 patient with CLL could be recognized by MA2.1, a mAb specific for the HLA-A2 MHC class I allele (Figure 4C). However, when the sorted CD19+ cells from this patient were cocultured with the sorted CD14+cells from a nonleukemic donor who lacked the HLA-A2 allele, the NLCs that developed within these cultures failed to react with the MA2.1 mAb (Figure 4D). Nevertheless, the NLCs expressed HLA class I antigens, as demonstrated by the ability of such cells to bind W6/32, a mAb specific for nonpolymorphic MHC class I surface antigens (data not shown). We conclude that the NLCs within such cocultures originated from the CD14+ mononuclear cells of the nonleukemic donor.
NLCs express a distinctive antigen profile
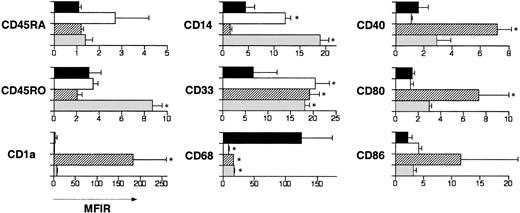
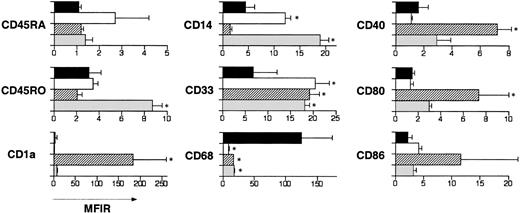
The relative expression of selected differentiation antigens on NLCs, fresh blood monocytes, monocyte-derived dendritic cells, and cytokine-generated macrophages was examined by flow cytometry. NLCs harvested from 11-day cultures of CLL blood mononuclear cells were compared with freshly isolated blood monocytes or monocyte-derived dendritic cells and cytokine-generated macrophages after 7 days in culture. The mean fluorescence intensity ratio (MFIR) of each cell type for each antigen was determined by dividing the mean fluorescence intensity (MFI) of cells stained with a fluorochrome-conjugated, antigen-specific mAb with the MFI of cells labeled with a fluorochrome-conjugated, isotype control mAb of irrelevant specificity. We averaged the MFIR for each cell type from 3 different donors and calculated the SD about the mean MFIR. Figure5 shows a comparison of mean MFIR of the different cells stained for representative antigens. NLCs had significantly higher cytoplasmic CD68 and lower surface CD33 than any of the other cell types examined. In addition, when compared with NLCs, cytokine-generated macrophages expressed significantly higher levels of CD45RO and CD14, whereas monocyte-derived dendritic cells expressed significantly higher levels of CD1a, CD40, and CD86. Moreover, fresh blood monocytes expressed significantly higher levels of CD14 than did NLCs. Collectively, these studies reveal that NLCs have a phenotype that distinguishes them from blood monocytes, monocyte-derived dendritic cells, or macrophages.
Phenotype of NLCs, fresh blood monocytes, cultured cytokine-derived dendritic cells, or cultured cytokine-derived macrophages.
Blood mononuclear cells from patients with CLL were cultured for 14 days. In parallel, monocytes from nonleukemic donors were cultured with either GM-CSF and IL-4, or M-CSF and TNF-α to induce differentiation into dendritic cells or macrophages, respectively. Adherent cells were harvested and then stained with fluorochrome-conjugated isotype control mAbs or fluorochrome-conjugated mAbs specific for a cell surface antigen, as indicated to the left of each set of bars. The bars indicate the mean MFIR for NLCs (▪), freshly isolated blood monocytes (■), monocyte-derived dendritic cells (▨), or macrophages (░) from at least 3 different donors. The error bars indicate the SD about the mean MFIR. An asterisk indicates that the mean MFIR of one type of cells for a particular antigen is significantly different from that of NLCs.
Differentiation of NLCs from CD14+ cells in vitro requires contact with CLL cells
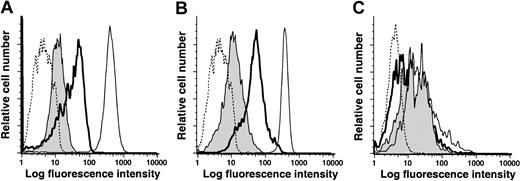
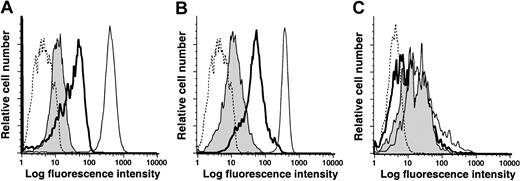
The low levels of CD14 on NLCs suggested they might be derived from a population of mononuclear cells that express low levels of CD14 at the initiation of culture. Alternatively, CD14 expression might be down-regulated during the differentiation of NLCs from blood mononuclear cells that originally expressed high levels of CD14. To examine this issue, blood mononuclear cells were isolated via FACS sorting from a healthy donor that expressed high levels of CD14. These cells were cultured alone or with sorted CD19+ CLL cells for 11 to 14 days and then re-examined for their relative expression of CD14 and CD33. The expression of CD14 and CD33 declined during the 2 weeks in culture (Figure 6A,B). However, such coculture conditions did not effect changes in the relative expression of other surface antigens, such as HLA-DR (Figure 6C). When isolated CD14+ mononuclear cells were cultured with CLL cells, but separated by a transwell membrane, their levels of CD14 and CD33 were similar to CD14+ mononuclear cells cultured alone (data not shown). Collectively, these studies revealed that blood mononuclear cells down-modulate their expression of CD14 and CD33 when cultured in direct contact with CLL cells.
Low-level expression of CD14 and CD33 on NLCs is an acquired phenotype.
CD14+ cells were sorted from blood mononuclear cells of a healthy donor by flow cytometry and then cultured with or without CLL B cells. Adherent cells were harvested on day 14 and analyzed by flow cytometry for expression of CD14 (A), CD33 (B), or HLA-DR (C). The dashed line presents representative fluorescence histograms of cells stained with an isotype control mAb. The thin lines represent the fluorescence histograms of sorted cells prior to culture. The bold lines represent the fluorescence histograms of stained adherent cells that were cultured alone. The shaded histogram provides the fluorescence histograms of stained adherent cells that were cultured with CD19+ CLL cells.
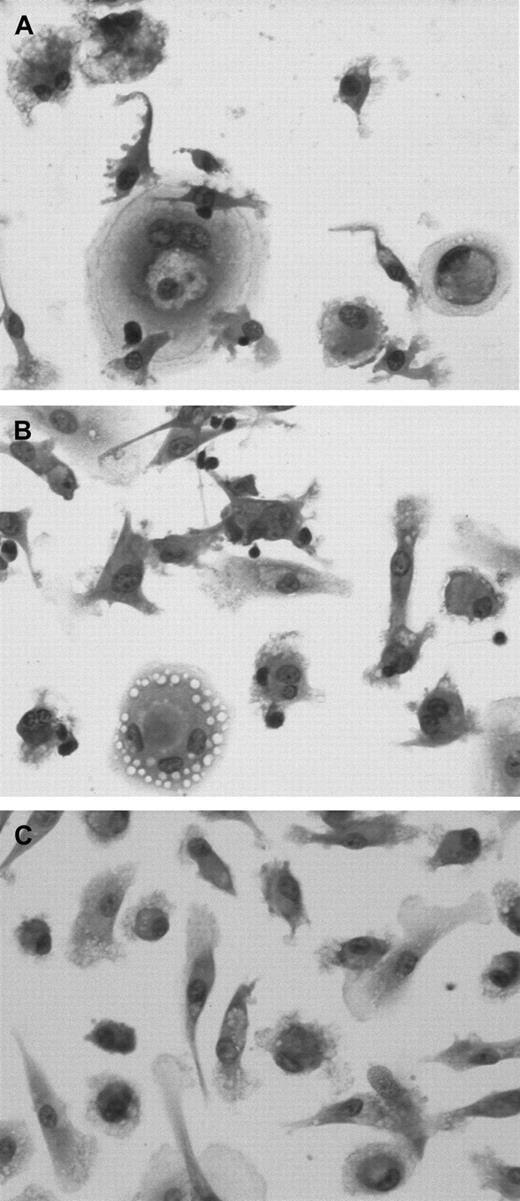
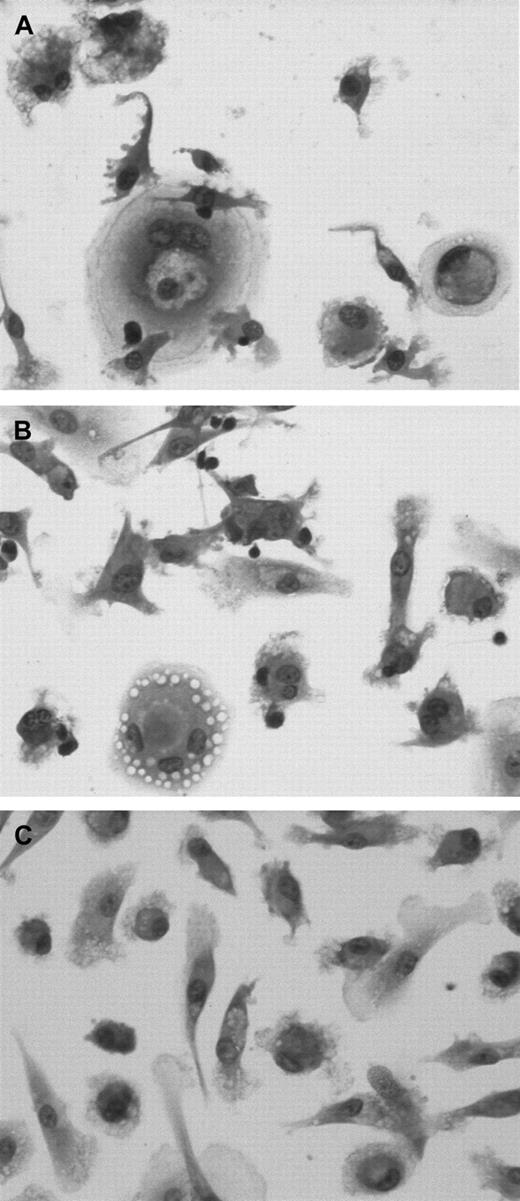
We examined whether CLL cells were unique in their ability to effect differentiation of CD14+ cells into NLCs in vitro. CD14+ mononuclear cells isolated from the blood of healthy donors were either cultured alone or with sorted CD19+ CLL cells or CD19+ blood B cells of healthy donors (Figure7). After 14 days the adherent cells were examined for morphology and antigen expression. CD14+ cells cocultured with CLL cells assumed the large, round, sometimes binucleate, cell morphology typical of NLCs (Figure 7A). CD14+ cells cocultured with the CD19+ cells of healthy donors also appeared larger in size than CD14+cells cultured alone (Figure 7B,C). However, in either case these cells did not have the characteristic morphology of NLCs that were cocultured with leukemia B cells.
CD14+ cells differentiate into NLCs in the presence of CLL B cells but not normal B cells.
CD14+ mononuclear cells were isolated from the blood of healthy donors and then cocultured with sorted CD19+ blood mononuclear cells from either patients with CLL (A) or healthy donors (B), or they were cultured alone (C). Fourteen days later, the adherent cells were examined for morphology after May-Giemsa staining.
Flow cytometric analyses revealed significant differences in the expression level of cytoplasmic CD68. The adherent cells derived from the CD14+ cells cocultured with CLL cells had CD68 expression levels (mean MFIR = 59 ± 9, n = 3) that were not significantly different from those noted for NLCs that differentiated from the blood mononuclear cells of patients with CLL (mean MFIR = 125 ± 50; P > .05, Student ttest). However, the average MFIR values for cytoplasmic CD68 of adherent CD14+ cells cocultured with normal CD19+ B cells or cultured alone were 20 ± 10 and 27 ± 9, respectively (each with n = 3). These values were significantly lower than the value for adherent CD14+ cells cocultured with CLL cells in vitro (P < .05, Bonferroni t test).
Evidence for NLCs in vivo
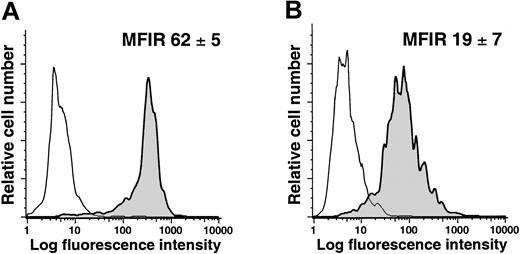
To evaluate whether NLCs exist in vivo, we isolated mononuclear cells from the spleens of patients with or without CLL. The splenocytes were labeled with mAbs specific for CD14 and CD68 and analyzed via flow cytometry. We found that the CD14+ splenocytes from patients with CLL expressed significantly higher levels of CD68 (average MFIR for CD68 = 62 ± 5, n = 2) than the CD14+ splenocytes of patients without lymphoproliferative disease (average MFIR for CD68 = 19 ± 7, n = 2; Figure8; Student t test,P < .05). Moreover, the average MFIR for CD68 of CD14+ CLL splenocytes was not significantly different from that of CD14+ blood mononuclear cells cocultured with CLL cells in vitro, but was significantly higher than that of CD14+ blood mononuclear cells cocultured with normal CD19+ B cells or cultured alone (P < .05, Bonferroni t test).
Expression of CD68 by CD14+ splenocytes of patients with or without CLL.
Mononuclear splenocytes were stained for CD14 and CD68 and analyzed by flow cytometry. The figures provide representative histograms of gated CD14+ splenocytes from patients with (A) or without (B) CLL, depicting the fluorescence of cells labeled with an isotype control mAb (thin lines) or a mAb specific for CD68 (shaded histogram). The average MFIR for CD68 of CD14+ splenocytes from 2 patients (± SD) with (A) or without (B) CLL is indicated in the top right hand corner of each histogram.
Splenocytes were cultured for 1 to 2 days on plastic culture dishes and then examined for morphology or antigen expression. We identified adherent splenocytes from patients with CLL that had morphology similar to that of NLCs that differentiated from blood mononuclear cells cocultured with CLL cells for 11 to 14 days in vitro. Such cells were not identifiable in the adherent splenocytes of patients without lymphoproliferative disease (data not shown). Furthermore, the adherent splenocytes of patients with CLL expressed high levels of cytoplasmic CD68, whereas the adherent splenocytes of patients without CLL had relatively low-level expression of CD68 (data not shown).
Discussion
In this study, we characterized the antigens expressed by NLCs that differentiated from the blood mononuclear cells of patients with CLL. Prior studies indicated that these cells did not express B-cell or T-cell differentiation antigens and were negative for CD83, a surface antigen expressed by many mature dendritic cells.9Instead, these cells stained with antibodies to vimentin and STRO-1, suggesting that NLCs were derived from fibroblast colony-forming units that give rise to cells with the phenotype of fibroblasts, adipocytes, smooth muscle cells, and functional osteoblasts.13,14 However, in this study, we found that NLCs express CD45, a surface tyrosine phosphatase restricted to cells of hematopoietic origin.15
The NLCs also expressed CD14 (Figure 1), a glycosylphosphatidylinositol-linked plasma membrane myelomonocytic receptor for bacterial lipopolysaccharide that facilitates the recognition and clearance of apoptotic cells.15,16 Studies in which mononuclear cells were depleted of CD14+ cells prior to culture demonstrated that NLC outgrowth is dependent on the presence of CD14+ cells at the initiation of cell culture. NLCs also expressed CD33, a type I membrane glycoprotein receptor for sialoglycoconjugates restricted to cells of the myelomonocytic lineage that may facilitate cell-cell adhesion.17 Collectively, these findings indicate that NLCs are derived from cells related to blood monocytes.
Although NLCs share antigens in common with cells of the myelomonocytic lineage, they express significantly lower levels of CD14 and CD33, and higher levels of CD68, (a member of the lysosome-associated membrane proteins) than blood monocytes, macrophages, or monocyte-derived dendritic cells (Figure 4). In addition, NLCs lack the high-level surface expression of CD45RO found on cultured macrophages. The surface antigen phenotype of NLCs also differs from that of blood-derived dendritic cells. Although dendritic cell precursors may express CD68,18 these cells do not express CD14, in contrast to NLCs. Moreover, CD68+ dendritic cells also express CD83,19 an antigen induced during dendritic cell maturation.20 NLCs, on the other hand, express neither CD83 nor CD1a, a type I surface glycoprotein on blood-derived dendritic cells.21 Also, despite expressing HLA class II differentiation antigens, NLCs have significantly lower levels of CD40 and important immune costimulatory molecules, such as CD80 and CD86, than blood-derived dendritic cells (Figure 4). Collectively, these data reveal that NLCs can be distinguished from dendritic cells and dendritic cell precursors.
We found that cells with the morphology, phenotype, and function of NLCs can differentiate from the CD14+ blood mononuclear cells of healthy donors. Coculture of isolated, normal CD14+ cells with CLL cells induces the former to differentiate into cells that are indistinguishable from the NLCs derived from blood mononuclear cells of patients with CLL (Figure 3). Moreover, these cells expressed relatively low levels of CD14 and CD33 when cocultured with CLL B cells (Figure 6A,B), even though they expressed high levels of these surface antigens at the initiation of cell culture. However, such conditions did not affect the expression levels of other surface antigens, such as HLA-DR (Figure 6C). Furthermore, coculture of CD14+ cells with CLL cells enhanced the expression of CD68. As such, it appears that CD14 and CD33 are specifically down-regulated and CD68 up-regulated during NLC differentiation in the context of CLL B cells.
Blood monocytes down-regulate CD14 following exposure to certain cytokines. Monocytes cultured with IL-4 down-regulate their expression of CD14, but not other molecules such as HLA-A, -B, and -C antigens, whereupon they become sensitive to apoptosis.22 However, the down-regulation of CD14 on NLCs does not presage induction of apoptosis, because these cells can survive for many weeks when cultured with leukemia B cells in vitro. Furthermore, neutralizing antibodies to IL-4 does not prevent blood mononuclear cells from differentiating into NLCs or from down-regulating CD14 (data not shown). Finally, CD14 down-regulation was not observed when CD14+ mononuclear cells were cocultured with CLL cells across a transwell membrane. As such, the low-level surface expression of CD14 on NLCs does not appear to be secondary to soluble molecules, such as IL-4.
It has been reported that CD14+ blood mononuclear cells can develop features of endothelial-like cells (ELCs) in the presence of angiogenic growth factors.23 Such ELCs may have some characteristics in common with NLCs, such as expression of CD68, HLA-DR, and CD36, and lack of expression of dendritic cell markers (eg, CD1a or CD83). However, in contrast to NLCs, ELCs apparently become loosely adherent within 24 hours of culture and after 1 week can be induced to express other endothelial cell markers, such as von Willebrand factor, CD144 (VE-cadherin), CD105 (endoglin), acetylated low-density lipoprotein receptor, CD36 (thrombospondin receptor), the vascular endothelial cell growth factor (VEGF) receptor 1 (FLT-1), and, to a lesser extent, KDR (VEGF receptor-2). Furthermore, in contrast to NLCs, ELCs apparently express high levels of CD106 (VCAM-1), especially when cultured with TNF-α. As such, the characteristics of ELCs are distinct from those of NLCs noted in this study.
In addition, there are CD34+ cells called fibrocytes that are present in monocyte fractions of human blood. When grown on fibronectin, these cells become strongly adherent and develop a large, spindle-shaped morphology. These cells are thought to be circulating vascular endothelial cell precursors and can differentiate into myofibroblasts when cultured with platelet-derived growth factor.24 Fibrocytes may have morphologic features in common with ELCs and NLCs, but comparisons are complicated because their phenotype has only been determined after several weeks in culture. Nevertheless, in contrast to NLCs, these cells do not express CD45, the common leukocyte antigen expressed on all hematopoietic cells except erythrocytes.
Instead, NLCs appear to represent a distinctive cell type that develops in the context of CLL. CD14+ cells of healthy donors differentiate into cells with NLC phenotype when cocultured with CLL B cells, but not with CD19+ B cells of healthy donors. In addition to their distinctive morphology, the CD14+ cells cocultured with CLL cells expressed significantly higher levels of CD68 than the same cells cocultured with normal CD19+ cells or cultured alone. That such differentiation does not just represent an ex vivo phenomenon is indicated by the multiparameter flow cytometry analyses of splenocytes from patients with or without CLL. The freshly isolated CD14+ splenocytes from patients with CLL expressed significantly higher levels of CD68 than did the CD14+splenocytes from patients without lymphoproliferative disease (Figure8). Moreover, when we cultured the mononuclear splenocytes of CLL patients on plastic, we could identify cells after only 1 to 2 days culture that had the morphology similar to that of the NLCs that differentiated from CD14+ blood cells after 11 to 14 days in vitro. Collectively, these data reveal that cells with the distinctive properties of NLCs may reside in the secondary lymphoid tissues of patients with CLL.
It is noteworthy that NLCs fail to stain for CD106, the VCAM-1 expressed on follicular and interdigitating dendritic cells, macrophages, marrow stromal cells, and nonvascular cells within joints, kidney, muscle, heart, placenta, and brain.25 The ligands for this molecule are the integrins α4β1(CD49d/CD29, VLA-4) and α4β7. They are important in the interactions of hematopoietic progenitors with marrow stromal cells and for B cells binding to follicular dendritic cells or fibroblastlike synoviocytes.26-28 More important, the interactions between CD106 and VLA-4 (α4β1) are critical for stromal cells, other mesenchymal-derived cells, and follicular dendritic cells to bind normal or neoplastic B cells.29-31 Although perhaps insufficient to rescue B cells from ongoing apoptosis,30,31 the interactions between CD106 and B cell VLA-4 can enhance resistance to apoptosis in vitro. Moreover, fibroblastlike synoviocytes can protect B cells from undergoing spontaneous apoptosis through a contact-dependent mechanism that requires CD106.9,32 33 However, because NLCs do not express CD106, the mechanism(s) whereby they protect CLL B cells from undergoing cell death apparently differs from that of mesenchymal-derived stromal cells, follicular dendritic cells, or fibroblastlike synoviocytes.
Our prior studies found that elaboration of SDF-1 by NLCs was critical for rescuing leukemia B cells from apoptosis.9CLL B cells express high levels of functional SDF-1 receptors (CXCR4).34,35 Although we did not formally rule out the possibility that NLCs protect leukemia cells through integrin-mediated adhesion events, we did observe that SDF-1 alone could partially protect CLL cells from undergoing apoptosis in vitro. Moreover, this chemokine was found to activate leukemia-cell p44/42 mitogen-activated protein-kinase (ERK 1/2) in vitro.9 Conceivably, interactions between NLCs and CLL cells in vivo could help to sustain leukemia cell survival and mitigate the activity of drugs use to treat this disease, similar to what has been speculated to occur with integrin-mediated interactions between leukemia cells and stromal elements.36 Because stromal elements also express SDF-1, methods to down-modulate the expression of SDF-1 or block its interaction with CXCR4 could be useful in the treatment of patients with CLL.
The authors are grateful to James R. Feramisco, Brian A. Smith, and Stephen McMullen for their excellent assistance with immunofluorescence microscopic analysis and thank Dennis J. Young for his excellent assistance with cell sorting.
Supported in part by PO1 CA81534 and R37 CA49870 awards from the National Institutes of Health.
The publication costs of this article were defrayed in part by page charge payment. Therefore, and solely to indicate this fact, this article is hereby marked “advertisement” in accordance with 18 U.S.C. section 1734.
References
Author notes
Thomas J. Kipps, 9500 Gilman Dr, University of California, San Diego, School of Medicine, La Jolla, CA 92093-0663; e-mail: tkipps@ucsd.edu.

