Abstract
Bcl-2 and bcl-xL function as suppressors of programmed cell death. The expression of bcl-2 protein in vivo is associated with long-lived hematopoietic cells such as mature lymphocytes and early myeloid progenitors. Bcl-xL, a homologue of bcl-2, is also expressed in lymphocytes and thymocytes. In contrast, the bcl-2-related proteins (bax, bad, and bak) act by promoting apoptotic cell death as shown from their expression in hematopoietic cell lines. We analyzed the expression of bcl-2 and bcl-x proteins in hematopoietic precursors obtained from various cell sources in adult mobilized peripheral blood collected from 13 patients with solid tumors, 8 adult bone marrow, and 12 umbilical cord blood. The analysis was based on the expression of the proliferation and activation specific antigens, CD38 and class II (HLA-DR). Similarly, we analyzed the expression of bcl-2-related proteins bcl-xL, bax, bad, and bak before and during ex-vivo expansion. Hematopoietic precursors expressing strongly the CD34 antigen (CD34s+) and lacking CD38 or HLA-DR expression were analyzed by using three-color immunofluorescence staining. The majority of CD34+ cells expressed bcl-2 and unexpectedly showed a bimodal distribution of low and high expression. More cells that lacked or expressed low density CD38 expressed low bcl-2 than the more differentiated counterparts (those with high density CD38). Immaturity (ie, little or no HLA-DR) is associated with the expression of low bcl-2 compared with HLA-DR+. However, HLA-DR−/low population contained a lower number of cells expressing low bcl-2 (30% to 40%) than CD38−/low in comparable samples. The hematopoietic precursors with bcl-2low and bcl-2high formed a homogeneous population of undifferentiated lymphoid-like cells having a similar forward scatter. These cells expressed strongly the bcl-xL protein (>95%) but were bax low (4% to 12%), bad low (0% to 0.8%), and bak low (0% to 3%). The expression of apoptosis specific protein (ASP) was also low (3.4% ± 3.1%) as was Annexin V. In addition, the CD34+/CD38−showed low cell cycle activity (<2.2%). Induction of apoptosis by overnight incubation of CD34 cells in serum-deprived medium resulted in the upregulation of bcl-2 as a single population histogram. Thus, these results suggest that in quiescent hematopoietic precursors, the bcl-2 protein plays a less prominent role as a survival promoter than bcl-xL and that the low bcl-2 expression did not promote apoptosis. During day 10 of ex vivo expansion of CD34+cells in liquid culture containing stem cell factor, interleukin-3 (IL-3), IL-6, IL-1β, and erythropoietin, the CD34+/CD38− cells expressed high bcl-2 as a single population histogram, and greater than 90% were bcl-xL high. However, the expression of pro- and apoptotic antigens increased: bax (10% to 15%), bad (5% to 8%), bak (6% to 14%), and ASP (6% to 10%). These results show the importance of monitoring the expression of these proteins when defining the culture conditions for ex vivo expansion.
© 1998 by The American Society of Hematology.
THE REGULATION of cell survival plays an important role in embryogenesis, development, and regulation of the immune system as well as maintenance of adult tissue homeostasis.1 The hematopoietic stem cell is defined by its ability to restore hematopoiesis after marrow ablation. Unlike the differentiated hematopoietic cells, this cell must be long-lived and possess the capability of self-renewal throughout the lifetime of its host.2-5
Apoptosis, the active physiological form of programmed cell death (PCD), is the normal fate for terminally differentiated hematopoietic cells resulting in their finite and characteristic life span. The apoptotic process can be induced by a variety of stimuli leading to the activation of a specific series of metabolic and morphological changes and by the activation of endogenous endonucleases that ultimately produce the typical DNA fragmentation at the internucleosomal level.1,6,7 There is mounting evidence that the apoptotic death process can be controlled by endogenous factors such as proto-oncogenes, eg, c-myc, and p53,8 and by exogenous factors such as cytokines and other growth factors, eg, interleukin-3 (IL-3), IL-10, granulocyte-macrophage colony-stimulating factor, stem cell factor (SCF), and erythropoietin (EPO),9-13 cytotoxic drugs,14 and x-ray irradiation.15
To date, the bcl-2 is known to belong to a growing family of apoptosis-regulatory gene products, which may serve either as death antagonists (Bcl-2, Bcl-xL, Bcl-w, Bfl-1, Brag-1, Mcl-1, and A1) or death agonists (Bax, Bak, Bad, Bid, Bik, Hrk, and the alternatively spliced bcl-xs).16,17 These proteins share some sequence homology with bcl-2 but differ in their tissue and activation dependent expression pattern as well as in their structural features.17 Bcl-2 and bcl-xLdimerize with several members of bcl-2 family of proteins thereby changing the ratio of these members and altering the threshold of cell death.18-21
Both bcl-2 and bcl-x function as suppressors of PCD upon growth factor withdrawal in cytokine-dependent hematopoietic cell lines.22-25 The expression of bcl-2 protein in vivo is associated with long-lived cells in many lineages such as mature lymphocytes and neurons.16 The pattern of bcl-2 expression and its functional importance during lymphopoiesis and during differentiation of early myeloid progenitors have been well studied.26-29
Although bcl-2 protein expression has been well studied in early and more mature hematopoietic cells, comparatively little data exist on its expression in undifferentiated precursors.30-32 As yet, no data are available with regard to peripheral blood and, in particular, in cytokine mobilized precursors. In common with bcl-2, bcl-x protein expression has been shown in undifferentiated bone marrow (BM) precursors as well as lymphocytes and thymocytes.16,31Similarly, the expression of bax, bad, and bak proteins has been shown in hematopoietic cell lines on growth factor withdrawal.16,19,20 33
To provide a better insight into the maintenance of hematopoietic precursor cells reflected by their long-term survival and during their cellular activation and differentiation, we have evaluated the bcl-2 expression from three cell sources, in granulocyte colony-stimulating factor (G-CSF) mobilized peripheral blood (MPB), umbilical cord blood (CB), and adult BM. Immunophenotypically, these precursors were previously identified as strongly CD34+,34lacking the expression of lineage specific antigens,35,36and CD38 or human leukocyte antigen D-related (HLA-DR).34
Therefore, we analyzed bcl-2 expression in CD34+ cells based on the intensity of CD38 antigen expression or HLA-DR. We performed similar analyses to evaluate the expression of bcl-x and bcl-xL. We investigated the expression of bax, bad, bak, and apoptosis-specific proteins (ASP and Annexin V). We also studied the cell cycle status of purified CD34+/CD38− and compared them with CD34+/CD38+ in MPB and CB. We used a short-term incubation program to test the susceptibility of these precursors to apoptosis after 1 hour, 2 hours, and 24 hours incubation in serum- and growth factor-deprived medium. Finally, we expanded the CD34+ cells in liquid culture containing SCF, IL-3, IL-6, IL-1β, and EPO37 and examined the expression of the bcl-2 family members (bcl-2, bcl-xL, bax, bad, and bak) in primitive hematopoietic precursors.
We show that the undifferentiated precursors express bcl-2. Most interestingly, the bcl-2 expression shows a bimodal distribution (low and high). These precursors express high density bcl-xL. We also show that hematopoietic precursors have low apoptotic activity (bad 0% to 0.8%, bak 0% to 3%, bax 4% to 12%, and ASP 3% to 7%), low DNA synthesizing activity (0.5% to 2.2%), and under deprived conditions upregulated bcl-2. Similarly, the upregulation of bcl-2 also occurred during ex vivo expansion and was accompanied by an increase in the expression of bad (5% to 8%), bak (6% to 14%), bax (10% to 15%), and ASP (6% to 10%).
MATERIALS AND METHODS
Patients, mobilization procedure, and controls.
A total of 26 MPB samples were collected from 13 patients with solid tumors aged 39 to 58 years (median, 46 years). These were 5 with breast cancer, 7 with small-cell lung cancer, and 1 with germ-cell cancer. Hematopoietic progenitor cells were mobilized by high-dose chemotherapy (epirubicine 150 mg/m2) (Farmorubicine; Pharmacia, Milan, Italy) followed by 5 μg/kg subcutaneous G-CSF daily, for 10 days (Filgrastim; Roche, Basel, Switzerland).
BM samples were taken from 8 normal donors aged 38 to 63 years (median, 50 years). CB samples were obtained from 12 full-term deliveries. All patients and controls gave informed consent and the protocols were approved by the ethical committee of the Medical Faculty, University of Lausanne, Switzerland. Mononuclear cells (MNCs) were collected after centrifugation on a density gradient (Lymphoprep; Nycomed, Oslo, Norway) and washed twice in phosphate-buffered saline (PBS). Residual erythrocytes were depleted by lysis with isomolar ammonium chloride buffer for 10 minutes at room temperature (RT) and were subsequently washed in PBS. The cell line KG-1A, a CD34+ tumor cell line derived from a human acute myelogenous leukemia was obtained from the American Type Culture Collection (Rockville, MD).
Determination of membrane and cytoplasmic antigen expression by flow cytometry.
Three-color immunofluorescence (IF) staining was performed first by labeling membrane antigens with 2-color IF (PE plus streptavidin tri-color) and intracellular antigens with fluorescein isothiocyanate (FITC). Cell suspensions (0.5-1 × 10⁶) were incubated at RT with anti-CD34 conjugated to biotin (QBEND 10; Inotech, Dottikon, Switzerland). After incubation and washing, a mixture of anti-CD38 phycoerythrin (PE; Leu-17; Becton-Dickinson Immunocytometry Systems [BDIS], San Jose, CA) or anti-HLA-DR-PE (class II; BDIS) and tri-color conjugated streptavidin (Caltag Laboratories Inc, Burlingame, CA) were added and cells were incubated and washed. Fixation and permeabilization of the prelabeled cells were performed as described by Pizzolo et al38 and Francis et al39 by using a commercially available reagent, Ortho Permeafix (OPF; Ortho Diagnostic Systems, Inc, Raritan, NJ). Of this fixative, 1 mL diluted in a 1:1 ratio with distilled water was incubated for 40 minutes at RT and cells were washed. These permeabilized cells were then stained for intracellular antigens.
For direct staining, cells were stained with anti-bcl-2 conjugated to FITC (Dako Diagnostic AG, Zug, Switzerland) for 30 minutes at RT and washed. For indirect staining with anti-bcl-xL, anti-bcl-x, anti-bad (Transduction Laboratories, Lexington, KY), anti-bak, anti-bax (Santa Cruz Biotechnology, Inc, Basel, Switzerland), and anti-ASP (c-jun/AP-1 [Ab-2] Oncogene Science Inc, Uniondale, NY), the cells were first incubated with the primary antibody for 30 minutes at RT followed by washing and further incubation for 30 minutes with species-specific second layer antisera conjugated to FITC. Purified goat antimouse Ig-FITC (GAM IgG-FITC; Southern Biotechnology Associates, Birmingham, AL) was used for bcl-xL and bad; affinity-purified goat antirabbit IgG (F(ab′)2-FITC (Ready-System AG, Zürich, Switzerland) for bcl-x, bax, and ASP and affinity purified donkey antigoat IgG-FITC was used for bak (Santa Cruz Biotechnology Inc, Basel, Switzerland). We also used Annexin V-FITC (Nexins Research BV, Maastricht, The Netherlands) in a 3-color IF staining of surface antigens with CD34-Tri-color and CD38-PE. The KG-1A cell line was analyzed for bcl-2 expression. Isotype-matched, irrelevant antibodies served as controls.
Flow cytometric analysis was performed on the FACScan equipped with an argon laser tuned to 488 nm. Data acquisition was performed with lysis II software (BDIS). A total of 50,000 to 500,000 events were acquired in listmode data file depending on the CD34 count. Analysis of intracellular antigen expression was strictly performed on high positive CD34 cells based on the intensity level of CD38 antigen. High positive (CD383+), intermediate positive (CD382+), and low positive or negative (CD38−/low) populations were identified after (1) gating the lymphoid population on the basis of their forward light scatter (FSC)/side light scatter (SSC) features, followed by (2) identifying the CD34+ population by their SSC and CD34 antigen expression, and finally (3) by combining both the expression of CD34 and CD38 antigens.
To define the regions for CD38 negative from CD38 positive hematopoietic cells, we used the biological control to set the level for CD38 antigen expression by staining peripheral blood cells with CD45RO-FITC and CD38-PE. Mature resting T cells are CD45RO+and CD38 low or negative.40
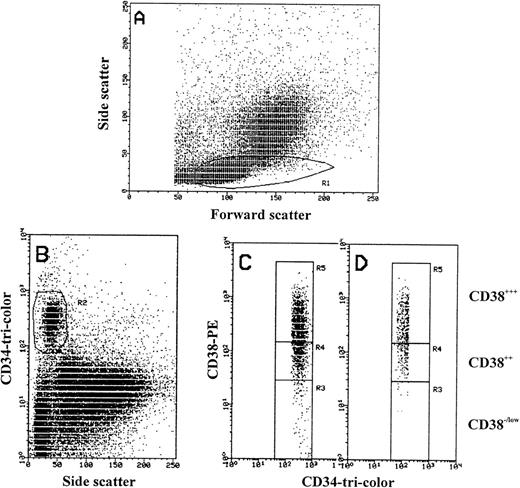
The logarithmic scale for CD34+/CD38−/lowregion was higher by 20% to 25% than the maximum PE fluorescence of the isotype control (R3 in Fig 1). R4 is used for gating CD34 cells with moderate expression of CD38 antigen (CD382+) and R5 for cells with high intensity of CD38 (CD383+; Fig 1). Once determined, the selected gates were used identically for analyzing all samples. These were constant, and were stored and recalled systematically for sample analysis. We used a similar pattern of gating to divide the CD34 strong positive cells into negative/low, intermediate, and high positive by using HLA-DR intensity of expression. Further analysis was performed on the total CD34 cell population expressing the antigen weakly (w) and strongly (s) by gating on the lymphoid cell population and dividing the CD34 cells by forward light scatter properties into small, intermediate, and large. Quadrants and histograms were defined by using isotype controls.
FACS analysis of MPB mononuclear cells. (A) Forward scatter (size) and side scatter (density) of MPB MNCs showing region R1 in which CD34+ cells are located. (B) Scattogram of CD34-tri-color (Fl 3) versus side scatter (SSC) showing only CD34+ cells in R2 that were also gated in R1. (C and D) CD34-tri-color (Fl 3) and CD38-PE (Fl 2) expression from R2 showing the gating of CD34+ cells based on CD38 antigen density level (R3, R4, and R5). Region R3 used to define CD34+/CD38−/low cells matching the biological control (see Materials and Methods). Region R3 include CD34+ cells with PE-CD38 fluorescence more by 20% to 25% than the maximum PE fluorescence of irrelevant isotype-control (log 101). Region R4 defines CD34+/CD382+ and region R5 defines CD34+/CD383+ cells. Regions R3, R4, and R5 were stored and constantly used for all samples to analyze the third antigen and for cell sorting experiments. (C) The gating of only CD34 strong positive cells are shown, where greater than 98% of CD38−/low cells are located in region R3. (D) The gating of CD34 weak positive cells are shown, in which region R3 lack the CD38− cells.
FACS analysis of MPB mononuclear cells. (A) Forward scatter (size) and side scatter (density) of MPB MNCs showing region R1 in which CD34+ cells are located. (B) Scattogram of CD34-tri-color (Fl 3) versus side scatter (SSC) showing only CD34+ cells in R2 that were also gated in R1. (C and D) CD34-tri-color (Fl 3) and CD38-PE (Fl 2) expression from R2 showing the gating of CD34+ cells based on CD38 antigen density level (R3, R4, and R5). Region R3 used to define CD34+/CD38−/low cells matching the biological control (see Materials and Methods). Region R3 include CD34+ cells with PE-CD38 fluorescence more by 20% to 25% than the maximum PE fluorescence of irrelevant isotype-control (log 101). Region R4 defines CD34+/CD382+ and region R5 defines CD34+/CD383+ cells. Regions R3, R4, and R5 were stored and constantly used for all samples to analyze the third antigen and for cell sorting experiments. (C) The gating of only CD34 strong positive cells are shown, where greater than 98% of CD38−/low cells are located in region R3. (D) The gating of CD34 weak positive cells are shown, in which region R3 lack the CD38− cells.
Cell sorting.
The cells from the three gates (CD38−/low, CD382+, and CD383+) were sorted separately by using the FACSvantage (BDIS) and were examined for morphology. In these sorting experiments, 2 to 4 × 10⁶ MNCs were stained with anti-CD34 and anti-CD38 (see above). The CD34+cells were gated according to their scatter features, then by using the same gating system as above, only the CD34s+ population was isolated expressing different intensity of CD38 antigen.
Cytospins were prepared and stained with Wright Giemsa’s stain and visualized by light microscopy. Photographs were taken at ×1,000 magnification.
Cell selection.
The CD34+ cells contained in the MPB and CB were positively selected by using the miniMACS CD34 isolation kit (Miltenvi Biotect, Bergisch Gladbach, Germany). The separation technique was performed according to the manufacturer’s instructions. Ninety-five percent of the cells identified by flow cytometry were CD34+/CD38+.
For the separation of CD34+/CD38− cells, we enriched for immature precursors by one round of immunomagnetic depletion of more mature CD34+ cells. Briefly, CD34+ cells (see above) selected from MNCs (1 × 10⁸/mL) were incubated with stem cell enrichment antibody cocktail containing glycophorin-A, CD3, CD2, CD56, CD24, CD19, CD14, CD16, CD66b, CD36, CD45RA, and CD38 (Stem Cell Technologies Inc, Vancouver, BC, Canada) for 30 minutes at 4°C followed by 30 minutes incubation with magnetic beads. The magnetic beads together with bound cells were then retained by using a strong magnet (eg, VarioMACS). The remaining cells were washed and identified by flow cytometry as CD34+/CD38−.
Cell cycle analysis.
To analyze the cell cycle status of CD34+ subsets, MNCs from MPB and CB were initially selected and phenotyped as CD34+/CD38+ and CD34+/CD38− as described above. The cells were first stained for surface CD34 (CD34-FITC; BDIS) followed by 1 mL of a hypotonic cocktail of propidium iodide (50 μg/mL PI plus 0.1% Triton X-100, Sigma, Basel, Switzerland) and 0.1% sodium citrate at a cell concentration of 0.5 to 1 × 10⁶/mL and incubated at 4°C until analyzed. Cell cycle analysis was performed by using a FACScan equipped with the Cell Fit or Lysis II software. Twenty thousand events were collected. The regions defining G0/G1 phase, S, and G2+M phase were set by using total MNCs as an internal control. Chicken erythrocytes nuclei (CEN DNA QC particle kit, BDIS) were used for assessing the optical performance of the FACScan. DNA from KG-1A cell line was also stained with CD34-FITC and PI and used as positive control.
Short-term incubation.
We performed a short-term incubation in medium deprived of serum and growth factors to induce apoptosis. MNCs from MPB and CB were incubated in RPMI 1640 at a cellular density of 106/mL (Seromed, Fakola, Basel, Switzerland). After 1 hour, 2 hours, and overnight incubation, the expression of bcl- 2, ASP, and DNA cell cycle was analyzed. Cell count and cell viability were determined before and after incubation. The cells were buffered in a humidified atmosphere of 5% CO2 in air at 37°C for 30 minutes by using Falcon tubes (BDIS). The tubes were sealed and incubated at RT. Three-color IF staining was performed as described above, the cells were labeled for membrane CD34-Tri-color and CD38-PE before fixation and permeabilization, and then stained for intracellular antigens (bcl-2-FITC and ASP-FITC). PI was used for the staining of DNA after 24-hour incubation. Cells were analyzed on the FACScan with Lysis II and Cell Fit software.
Ex vivo expansion.
CD34+ cells selected from four MPBs used at a cellular density (3 × 10⁴/mL) were grown as described previously.37 With exceptions, the autologous plasma was replaced by human AB plasma and 100 ng/mL of SCF was used instead of 10 ng/mL (Amgen Inc, Thousand Oaks, CA). All other growth factors were used as described, and IL-6 (Serono, Geneva, Switzerland), IL-3 (Sandoz Pharma Ltd, Basel, Switzerland), IL-1β, and EPO were purchased from R&D Systems Inc (Oxon, UK).
Cultures were incubated at 37°C in a humidified atmosphere containing 5% CO2 and were demidepopulated weekly for 3 weeks by removal of one half of the culture volume, which was replaced with fresh medium and growth factors.
On day 10, nonadherent cells were removed and were assessed for cellular enrichment, differentiation, and apoptotic activity by flow cytometry using three-color IF. The cells were labeled for membrane CD34-Tri-color and CD38-PE in combination with (1) an antigen specific for the bcl-2 family of proteins such as bcl-2, bcl-xL, bax, bad, and bak and (2) the ASP antigen (see above).
Evaluation of CD34+ cells by flow cytometry was performed on day 0 and day 10 of culture. Isotype-matched irrelevant antibodies served as controls.
Peptide neutralization.
The specificity of the pro-apoptotic antibodies (bax, bad and bak) was tested by flow cytometry on KG-1A cell line before and after the induction of apoptosis. The growing KG-1A cells (>98% viable) were divided into two parts. Cells (0.5-1 × 10⁶) were washed twice and one part was incubated in Iscove’s modified Dulbecco’s medium (IMDM) containing 20% fetal bovine serum and 2 mmol/L L-Glutamine. Apoptosis in the second part was induced by serum deprivation. The cells were incubated in IMDM and L-Glutamine alone. Cells were incubated for 24 hours at 37°C in a humidified atmosphere of 5% CO2. Cell viability was assessed by trypan blue staining and analysis by flow cytometry. For FACScan analysis of bax, bad, and bak proteins, cells were fixed and permeabilized for 40 minutes with Ortho Permeafix, stained for 30 minutes with the primary antibody and 30 minutes with the secondary antibody as described above.
For neutralization, the anti-bak antibody (1:200 dilution) was incubated overnight at 4°C with a 20- to 80-fold excess specific blocking peptide antigen in PBS (bak; N-20; Santa Cruz Biotechnology Inc). KG-1A cells induced for apoptosis were first permeabilized and then incubated in the peptide/antibody mixture for 30 minutes followed by incubation with the secondary antibody. Cells were then analyzed by flow cytometry.
Statistics.
For analysis, the simple regression and the paired t-test with two tailed P values were used.
RESULTS
Bcl-2 expression in primitive hematopoietic cells.
To assess the expression pattern of bcl-2 in hematopoietic cells with high-density CD34 antigen (CD34s+), in particular in those lacking CD38 antigen, we identified three populations based on the differential expression of CD38 (CD38−/low, CD382+, and CD383+). CD34+/CD38−/low cells were defined as those CD34+ cells with PE-CD38 fluorescence similar to CD45RO+/ CD38−/low T cells (region R3 in Fig 1C). Using this stringent definition, a consistent frequency of CD34+/CD38−/low cells was found in MPB, CB, and BM. The frequency was 7.1% ± 3.06% in MPB, 10% ± 4.77% in CB, and 5.74% ± 5.62% in BM.
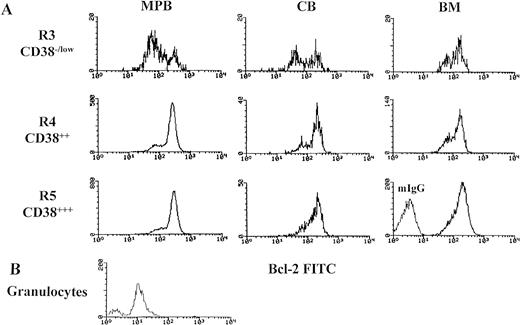
In the three populations (CD38−/low, CD382+, and CD383+) from MPB, CB, and BM, greater than 95% of cells showed bcl-2 staining higher than the highest intensity observed with isotype-matched negative control antibody and higher than the level of bcl-2 staining in the granulocytes obtained from four whole, fresh MPB samples. Interestingly, the bcl-2 expression in these cells yielded a bimodal histogram corresponding to two populations (low and high; Fig 2). The mean fluorescent intensity (MFI) in cells with low bcl-2 and cells with high bcl-2 expression between CD38−/low and CD383+ is shown in Table 1. The histograms for low bcl-2 and high bcl-2 were reproducibly distributed within a range of 52 to 164 immunofluorescent channel and 153 to 464, respectively. The ratio for the cells with low bcl-2 to the cells with high bcl-2 in CD38−/low (R3) was high and decreased significantly as the intensity of CD38 antigen increased (Table 2). The ratio was the highest in MPB (1.2 ± 0.85) and the lowest in BM (0.67 ± 0.5). Forward light scatter (FSC) characteristics of cells with bcl-2low and bcl-2high in the CD38−/low from 22 MPB samples showed no statistical differences in size (MFI-FSC for bcl-2low 106 ± 12.6 and bcl-2high 111 ± 12.3, P < .289). These results were confirmed by light microscopy of CD38−/low sorted cells from six experiments. The cells showed a homogeneous population with regard to size and an undifferentiated lymphoid-like appearance with regard to morphology (Fig 3A).
Bimodal distribution of bcl-2 protein expression (bcl-2low and bcl-2high) in primitive hematopoietic precursors and their progeny. Mononuclear cells (MNCs) were stained with membrane antigens (CD34-tri-color and CD38-PE), then permeabilized with Ortho Permeafix and stained for anti-bcl-2 FITC. Cells were analyzed according to CD38 intensity level, CD38−/low (R3), CD382+ (R4), and CD383+ (R5) by using only the strong CD34 positive cells (Fig 1C). These selected gates were identically used for analyzing all samples. MNCs were also permeabilized and stained with mIgG to define the threshold between bcl-2-positive and bcl-2-negative cells. Similarly, the granulocytes from whole, fresh MPB samples were also analyzed. The bcl-2 gates (bcl-2low and bcl-2high) were decided by the histograms distribution. (A) The bimodal distribution of bcl-2 in MPB, CB, and BM. (B) The comparison in bcl-2 fluorescent intensity between the mature granulocytes and the hematopoietic precursors (CD34s+/CD38−/low) seen in Fig 2A.
Bimodal distribution of bcl-2 protein expression (bcl-2low and bcl-2high) in primitive hematopoietic precursors and their progeny. Mononuclear cells (MNCs) were stained with membrane antigens (CD34-tri-color and CD38-PE), then permeabilized with Ortho Permeafix and stained for anti-bcl-2 FITC. Cells were analyzed according to CD38 intensity level, CD38−/low (R3), CD382+ (R4), and CD383+ (R5) by using only the strong CD34 positive cells (Fig 1C). These selected gates were identically used for analyzing all samples. MNCs were also permeabilized and stained with mIgG to define the threshold between bcl-2-positive and bcl-2-negative cells. Similarly, the granulocytes from whole, fresh MPB samples were also analyzed. The bcl-2 gates (bcl-2low and bcl-2high) were decided by the histograms distribution. (A) The bimodal distribution of bcl-2 in MPB, CB, and BM. (B) The comparison in bcl-2 fluorescent intensity between the mature granulocytes and the hematopoietic precursors (CD34s+/CD38−/low) seen in Fig 2A.
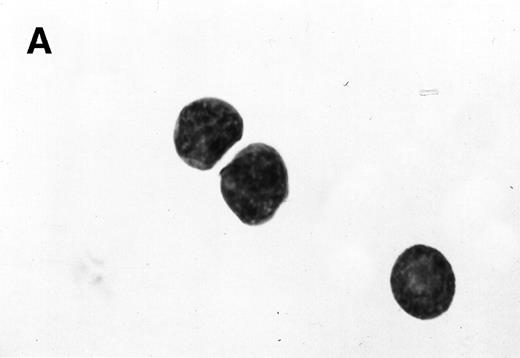
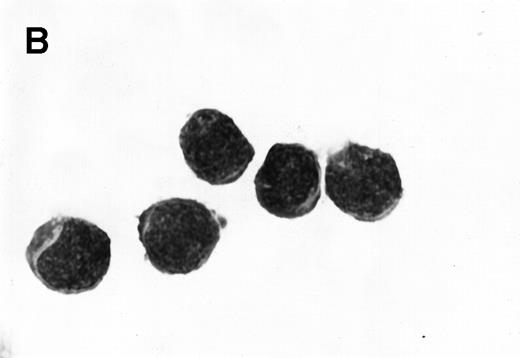
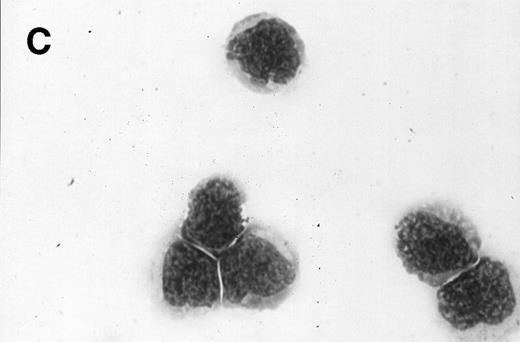
Morphology of sorted CD34+ cells obtained from MPB. The regions R3 (CD38−/low in A), R4 (CD382+ in B), and R5 (CD383+ in C) were stained with Wright Giemsa’s stain, visualized by light microscopy, and photographed at 1,000× magnification. Data show one representative experiment of six.
Morphology of sorted CD34+ cells obtained from MPB. The regions R3 (CD38−/low in A), R4 (CD382+ in B), and R5 (CD383+ in C) were stained with Wright Giemsa’s stain, visualized by light microscopy, and photographed at 1,000× magnification. Data show one representative experiment of six.
Similarly, a bimodal distribution of bcl-2 expression was obtained when high density CD34+ cells were gated according to HLA-DR intensity level. The ratio in the cells with low bcl-2 to the cells with high bcl-2 in MPB, CB, and BM was high in HLA-DR−/low cells and decreased significantly as the intensity of HLA-DR antigen increased (Table 2). However, HLA-DR−/low cells had 30% to 40% less bcl-2low expression than their counterparts CD38−/low in parallel samples (12 MPB, 6 CB, and 3 BM). Only one histogram with high intensity of bcl-2 expression was seen in the cell line (KG-1A).
Because we obtained two populations of bcl-2 within the CD34s+ cells, we were interested in examining the morphology of these cells. We went on to sort CD34s+ cells from the three gates (CD38−/low, CD382+, and CD383+). Morphological examination of cytospins prepared from R3, R4, and R5 showed progressively larger cells with distinct morphologies (Fig 3). Among the CD34+/CD38−/low cells, 87% to 91% were lymphoid-like with scanty cytoplasm, large homogeneous nuclei, and rare nucleoli (Fig 3A). The contaminating cells were mainly lymphocytes (3% to 5%) and mature myeloid cells (6% to 8%). CD382+ cells were lymphoblast-like with more cytoplasm, large nuclei, and one or more nucleoli (Fig 3B). CD383+ cells were myeloblast-like with large amounts of cytoplasm containing granules, large granular nuclei, and many nucleoli (Fig 3C).
The relative size of the three cell populations (CD38−/low, CD382+, and CD383+) were confirmed by light scatter. The average sizes for the three populations as determined by FSC significantly showed the progressive increase in cell size with increasing CD38 intensity of expression, eg, in MPB the MFI increased from 105.28 ± 18 in CD38−/low to 129.94 ± 8.09 in CD383+(P < .0001). However, the cells showed low levels of granularity in all of the three populations. Similarly a significant increase in cell size was shown with increasing HLA-DR expression, eg, in MPB the MFI increased from 116.69 ± 10.2 to 131.62 ± 7.9, (P < .0001) in HLA-DR−/low and HLA-DR3+, respectively. A more homogeneous population of small cells with primitive morphology was found within the CD38−/low sorted cells as compared with those of HLA-DR−/low. The results suggest the presence of two subpopulations of hematopoietic precursors, CD38− and HLA-DR−, that vary in bcl-2 expression and in cell size.
Bcl-2 expression in CD34+ cells.
We then analyzed the bcl-2 expression by using the total CD34 population with weak and strong expression of the antigen. The average frequency of cells expressed in the CD34 antigen increased with increasing cell size: only 7.02% ± 4.06% were small, 26.9% ± 11.60% were intermediate, and 66.0% ± 12.90% were large cells in MPB. The CD34s+ cells formed 45% to 55% of the total CD34+ population. A bimodal expression of bcl-2 was obtained in CD34s+ cells similar to those gated according to CD38 intensity level. However, no bimodal distribution was seen within the CD34w+ cells. The CD34w+ cells showed a heterogeneous pattern of bcl-2 expression. These results show variable levels of bcl-2 expression throughout hematopoietic cell differentiation.
Expression of bcl-x.
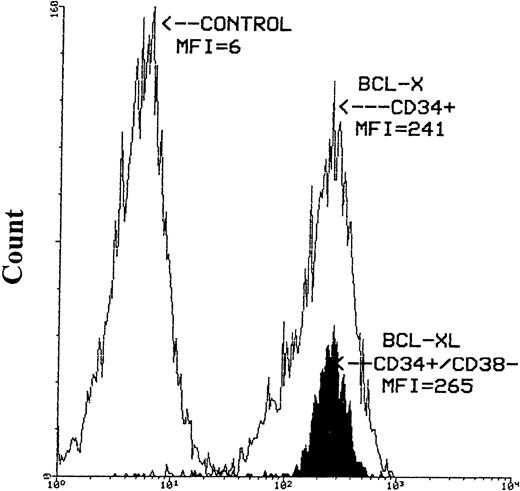
The expression of bcl-x protein was also evaluated in seven MPB, two CB, and two BM samples. Similar to bcl-2, greater than 95% of hematopoietic cells expressed bcl-x based on CD38 antigen level and cell size. The intensity of bcl-x was high in the majority of CD34+ cells. However, greater than 90% of CD34s+ cells expressed high density bcl-xLpresented as a narrow histogram. Similar intensity of bcl-xL expression was also obtained for CD34+/CD38− cells selected from three MPB samples (Fig 4).
Histograms of bcl-x-FITC and bcl-xL-FITC staining after the immunomagnetic selection of CD34+ and CD34+/CD38− cells from MPB. The left-hand histogram represents the negative control (mIgG), the middle empty histogram is the CD34+ cells expressing bcl-x and the filled-up histogram is the CD34+/CD38−hematopoietic precursors expressing high intensity bcl-xLprotein. Cells stained for bcl-x and bcl-xL were first stained with anti-CD34-PE antibody then permeabilized with Ortho Permeafix. MNCs stained with mIgG were also permeabilized.
Histograms of bcl-x-FITC and bcl-xL-FITC staining after the immunomagnetic selection of CD34+ and CD34+/CD38− cells from MPB. The left-hand histogram represents the negative control (mIgG), the middle empty histogram is the CD34+ cells expressing bcl-x and the filled-up histogram is the CD34+/CD38−hematopoietic precursors expressing high intensity bcl-xLprotein. Cells stained for bcl-x and bcl-xL were first stained with anti-CD34-PE antibody then permeabilized with Ortho Permeafix. MNCs stained with mIgG were also permeabilized.
Expression of bax, bad, and bak.
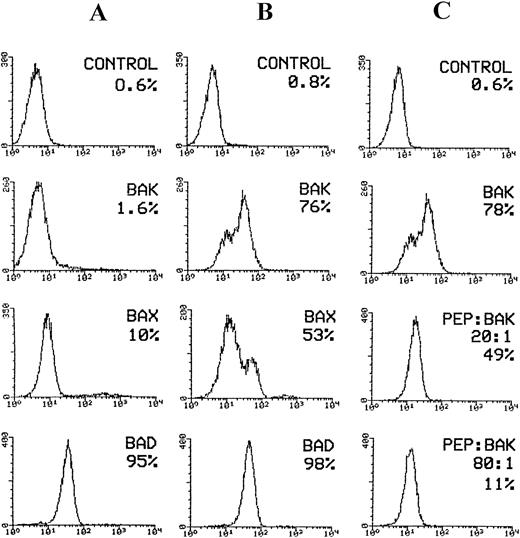
The expression of pro-apoptotic proteins bax, bad, and bak was evaluated in four MPB samples. The CD34s+/CD38−/low expressed low-density bax (range, 4% to 12%), low bad (range, 0% to 0.8%), and low bak (range, 0% to 3%) suggesting the characteristics associated with the pluripotent stem cells. Based on CD38 antigen intensity, the expression of bax, bad, and bak increased with increasing CD38 antigen expression. In CD38+ population the percentage of cells expressing bax, bad, and bak increased to (15% to 20%), (0.5% to 2%), and (2% to 11%), respectively. However, based on the intensity of CD34 antigen expression, bax, bad, and bak further increased in cells expressing low-density CD34 compared with those with high density. Bax ranged from 7% to 27%, bad ranged from 2% to 14%, and bak ranged from 7% to 30%. These findings suggest that the increase in pro-apoptotic protein expression is related to the process of maturation unlike control cells such as the KG-1A cell line, in which a considerable increase in bax and bak expression was obtained after induction of apoptosis (Fig 5A and B).
Flow cytometric analysis of pro-apoptotic proteins expressed by KG-1A cell line. Cells were induced for apoptosis after overnight incubation in medium deprived of serum. For flow cytometric analysis of bak, bad, and bax expression in KG-1A cells, cells were permeabilized with Ortho Permeafix and stained with goat anti-bak, mouse anti-bad, and rabbit anti-bax antibodies followed by staining with FITC-conjugated antigoat, antimouse, and antirabbit IgG antibodies, respectively. For neutralization, the anti-bak antibody (goat polyclonal) was incubated overnight at 4°C with excess peptide antigen. Cells were stained with the peptide/antibody mixture followed by staining with FITC-conjugated antigoat IgG. (A) bax, bak, and bad expression before induction of apoptosis. Only bad protein was expressed by the majority of KG-1A cells. (B) Considerable increase in bax and bak expression following induction of apoptosis. (C) The effect of bak- blocking peptide (PEP) on bak expression in apoptotic cells. Bak expression reduced from 78% before to 11% after neutralization with bak peptide.
Flow cytometric analysis of pro-apoptotic proteins expressed by KG-1A cell line. Cells were induced for apoptosis after overnight incubation in medium deprived of serum. For flow cytometric analysis of bak, bad, and bax expression in KG-1A cells, cells were permeabilized with Ortho Permeafix and stained with goat anti-bak, mouse anti-bad, and rabbit anti-bax antibodies followed by staining with FITC-conjugated antigoat, antimouse, and antirabbit IgG antibodies, respectively. For neutralization, the anti-bak antibody (goat polyclonal) was incubated overnight at 4°C with excess peptide antigen. Cells were stained with the peptide/antibody mixture followed by staining with FITC-conjugated antigoat IgG. (A) bax, bak, and bad expression before induction of apoptosis. Only bad protein was expressed by the majority of KG-1A cells. (B) Considerable increase in bax and bak expression following induction of apoptosis. (C) The effect of bak- blocking peptide (PEP) on bak expression in apoptotic cells. Bak expression reduced from 78% before to 11% after neutralization with bak peptide.
To determine whether the increase in percentage bak protein was caused by antigen expression, we incubated anti-bak antibody with increasing concentrations of the bak-peptide. The results clearly show a gradual decrease in bak expression: bak decreased from 78% in the absence of peptide to 11% in the presence of excess peptide (80:1; Fig 5C), showing that the binding of the peptide to the antibody is highly specific. The overall results show the reliability in analyzing the pro- and anti-apoptotic proteins by flow cytometry.
Expression of apoptotic proteins by CD34 cells.
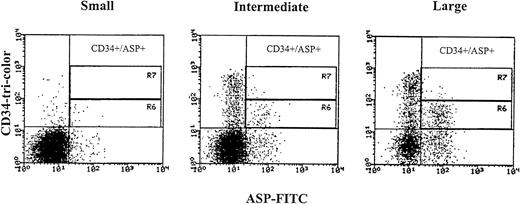
We aimed at identifying the CD34 cells undergoing apoptosis by studying the expression of apoptosis-specific proteins such as ASP and Annexin V and also analyzing their DNA profile (see below). Because the expression of bcl-2low and bcl-2high within the CD34s+ population was consistent, we decided to examine cells expressing low intensity bcl-2 to find out if low bcl-2 triggers apoptosis in hematopoietic precursors. ASP is an intracellular protein of 45 kD that has been shown in mammalian cells induced for apoptosis.8 The CD34s+/CD38−/lowexpressed low percentage of the ASP protein 3.4% ± 3.1%. The expression of ASP increased with increasing CD38 antigen density (5.8% ± 5.25% and 7.9% ± 6.7% for CD382+ and CD383+). However, the percentage of ASP also increased in cells expressing the CD34 antigen weakly and in large cells, (7.05% ± 4.32%, 13.2% ± 4.69%, and 29.5% ± 10.43%, small, intermediate, and large cells, respectively, Fig 6). In total CD34s+ cells, low intensity and lower percentage of ASP (6.4% ± 2.98% in 9 MPB and 0.5% and 1% in 2 CB) were obtained compared with the whole CD34+ cell compartment (20.6% ± 7.4% for MPB and 4.9% and 7.7% for CB). CD34+ cells were also stained with Annexin V, a calcium-dependent phospholipid protein that has high affinity for binding phosphatidyl serine expressed by apoptotic cells.41 42 CD34s+ cells showed low intensity and lower percentage positive Annexin (5.9% and 6.9%) compared with the total CD34+ population (17.7% and 12.7%) in two MPB samples. The expression of Annexin V by CD34 cells was similar to ASP as was compared in the two above samples (5% and 7% in CD34s+ and 17.7% and 18.2% in total CD34+cells). These results show that the expression of apoptotic proteins occurred mainly among low-density CD34 cells and large cells and is directly related to the increase in cell size and differentiation.
ASP expression in CD34 positive cells obtained from MPB samples gated according to cell size into small, intermediate, and large. Region R6 identifies weak CD34 positive cells expressing the ASP-protein, and region R7 identifies strong CD34 positive cells expressing the ASP-protein. Three-color immunofluorescence staining was performed. After staining of membrane antigens with anti-CD34-tri-color and anti-CD38-PE antibodies, cells were permeabilized with Ortho Permeafix, stained with anti-ASP-FITC, and analyzed on the FACScan.
ASP expression in CD34 positive cells obtained from MPB samples gated according to cell size into small, intermediate, and large. Region R6 identifies weak CD34 positive cells expressing the ASP-protein, and region R7 identifies strong CD34 positive cells expressing the ASP-protein. Three-color immunofluorescence staining was performed. After staining of membrane antigens with anti-CD34-tri-color and anti-CD38-PE antibodies, cells were permeabilized with Ortho Permeafix, stained with anti-ASP-FITC, and analyzed on the FACScan.
Cell cycle status of CD34-positive cells.
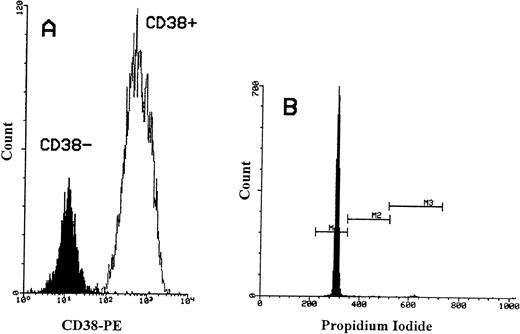
We then investigated the cell cycle status of CD34+/CD38− cells and compared them with CD34+/CD38+ cells. CD34+ cells were positively selected from three MPB and three CB samples. CD34+/CD38− cells were obtained from CD34+ cells by using immunomagnetic depletion of more mature CD34 cells (Fig 7A). Similarly, the CD34+ cells from cell line KG-1A were also used as a positive control. In both MPB and CB, a lower percentage of primitive CD34+/CD38− cells was cycling (mean = 0.92% of 3 MPB and mean = 1.63% of 3 CB; Fig 7B). In contrast, an increase in the proportion of DNA synthesizing cells was obtained with increasing CD38 antigen expression (mean = 4.4% in MPB and mean = 2.8% in CB). However, among the KG-1A cells, significantly higher proportions were in the proliferative cell cycle (37%). These results show that CD34+/CD38− cells from the two blood sources (MPB and CB) have low cell-cycle activity and neither cells showed the presence of an apoptotic peak.
Flow cytometric analysis of propidium iodide stained CD34+/CD38− cells obtained from MPB. (A) The immunomagnetic separation of CD34+/CD38− cells obtained from selected CD34+ cells. Greater than 90% of CD34+cells were CD38+. The MFI for CD38+ cells was 675. After negative selection, the MFI for CD38−cells reduced to 15. (B) Histogram showing PI-fluorescence of selected CD34+/CD38− cells stained with two-color immunofluorescence (CD34-FITC and PI) and gated on CD34+cells. M1 defines cells in G0/G1 phase, M2 defines cells in S phase, and M3 defines cells in G2+M phase.
Flow cytometric analysis of propidium iodide stained CD34+/CD38− cells obtained from MPB. (A) The immunomagnetic separation of CD34+/CD38− cells obtained from selected CD34+ cells. Greater than 90% of CD34+cells were CD38+. The MFI for CD38+ cells was 675. After negative selection, the MFI for CD38−cells reduced to 15. (B) Histogram showing PI-fluorescence of selected CD34+/CD38− cells stained with two-color immunofluorescence (CD34-FITC and PI) and gated on CD34+cells. M1 defines cells in G0/G1 phase, M2 defines cells in S phase, and M3 defines cells in G2+M phase.
Induction of apoptosis.
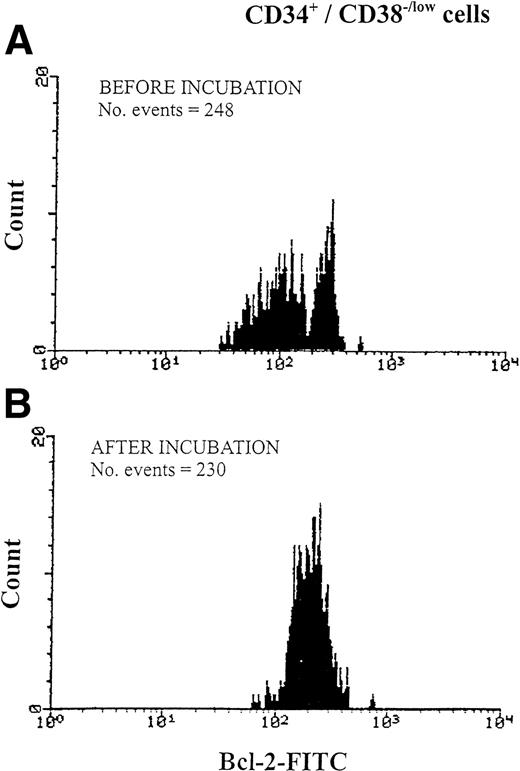
We aimed at examining the susceptibility of CD34s+ cells with low expression of bcl-2 for apoptosis at 1 hour, 2 hours, and after overnight incubation (24 hour) in medium deprived of serum and growth factors. Mononuclear cells from six MPB samples were tested. Cell numbers and cell viability were investigated at the beginning and after 1 hour, 2 hours, and 24 hours of incubation, and the percentage of cells recovered was 91% to 97% with percentage viability exceeding 90% of those originally counted. Phenotypic analysis showed that 95% to 98% of gated CD34+ cells identified in the fluorescence versus SSC dot plot were recovered after 24-hour incubation. Interestingly a bimodal histogram of bcl-2 low and bcl-2 high obtained in CD34s+ cells gated according to CD38 intensity was seen before (Fig 8A) and after 1-hour and 2- hour incubation but disappeared after 24-hour incubation representing only a single population histogram (Fig 8B). However, the disappearance of the histogram representing cells with low bcl-2 expression did not reduce the number of events collected, in particular those cells lacking CD38 antigen expression (Fig 8B). Furthermore, ASP expression in CD34s+/CD38−/low increased from 2.1% to 4.3% after overnight incubation in comparison with the more mature cells (CD34+/CD38+) in which ASP expression increased from 3.4% to 9.8%.
Changes in bcl-2 expression of CD34+/CD38−/low hematopoietic precursors during overnight incubation of MPB in serum-free RPMI. Cells were analyzed using three-color immunofluorescence of CD34-tri- color, CD38-PE, and bcl-2-FITC. After membrane antigen staining with anti-CD34 and anti-CD38 antibodies, cells were permeabilized with Ortho Permeafix and stained for anti-bcl-2. Bcl-2 expression was analyzed according to CD38 antigen intensity level (regions R3, R4, and R5 in Fig 1C). Data show one representative experiment of six. (A) Bcl-2 expression before incubation, representing a bimodal histogram of bcl-2low(MFI = 95) and bcl- 2high (MFI = 259). (B) Bcl-2 expression in the same cells after incubation showing a single histogram of bcl- 2high (MFI = 212).
Changes in bcl-2 expression of CD34+/CD38−/low hematopoietic precursors during overnight incubation of MPB in serum-free RPMI. Cells were analyzed using three-color immunofluorescence of CD34-tri- color, CD38-PE, and bcl-2-FITC. After membrane antigen staining with anti-CD34 and anti-CD38 antibodies, cells were permeabilized with Ortho Permeafix and stained for anti-bcl-2. Bcl-2 expression was analyzed according to CD38 antigen intensity level (regions R3, R4, and R5 in Fig 1C). Data show one representative experiment of six. (A) Bcl-2 expression before incubation, representing a bimodal histogram of bcl-2low(MFI = 95) and bcl- 2high (MFI = 259). (B) Bcl-2 expression in the same cells after incubation showing a single histogram of bcl- 2high (MFI = 212).
No apoptotic peak was obtained after 24-hour incubation: only a slight increase of cells in S/G2 + M phase ranging from 1.0% to 2.0% compared with 0.8% to 1.4% before incubation. These results may show that under deprived conditions CD34s+ cells with low bcl-2 upregulated their bcl-2 to escape apoptosis.
Ex vivo expansion of CD34+ cells.
Cultures were maintained for 3 weeks. Cellular proliferation peaked on day 10 with a cell output greater than 75-fold the input number (range, 58-200) and a viability exceeding 90%.
On day 0, the starting percentage of CD34+ ranged from 85% to 95%, and on day 10 of culture, 6% to 10% were CD34+representing a threefold increase. Among the CD34+ cells a mean of 12% were CD38−, giving a ninefold increase in the CD34+/CD38− cell population. On day 10 of culture, CD34+/CD38− expressed bcl-2 as a single population histogram and greater than 90% of cells were bcl-xL high. The expression of bax increased from 12%, 8%, and 6% to 15%, 10%, and 15%; bad increased from 0%, 0%, and 0.8% to 5%, 5%, and 8%; bak increased from 3%, 0%, and 2% to 6%, 14%, and 12%; and ASP increased from 7%, 5%, 3%, and 3% to 6%, 10%, 10%, and 7%.
DISCUSSION
In this study, we analyzed the expression of bcl-2 and its related proteins in hematopoietic precursors and progenitors from adult MPB, CB, and adult BM. To our knowledge, this is the first time that bcl-2 analysis was performed according to cellular differentiation by using the expression of CD38 or HLA-DR (class II) as activation markers. We showed that variable levels of bcl-2 are expressed by the most primitive hematopoietic cells (CD34s+/CD38−/low or CD34s+/HLADR−/low) as well as the more mature ones (CD34s+/CD383+/HLA-DR3+). We also showed a progressive conversion of bcl-2low to bcl-2high and a stable expression for cells with bcl-2high at steady state and during stimulation.
During cellular differentiation/maturation the increase in bcl-2 intensity is associated with the transition into intermediate and large cells. The expression of bcl-2 in primitive hematopoietic cells has also been shown by others in fetal liver and during ontogenesis.32,43 Primitive BM precursors (CD34+/CD33−/HLA-DR+) have also been shown to express bcl-2.30 In contrast, these primitive hematopoietic precursors were found to be bcl-2 negative by Park et al31 by using a different technique.
Unexpectedly, we identified a small subpopulation of hematopoietic precursors with a low bcl-2 expression but strong CD34+ and lacking CD38 antigen. These cells are different from other numerous CD34s+/CD383+ progenitors on the basis of cell size, cell morphology, bcl-2 expression, cell cycle status, and expression of apoptotic proteins. The CD34s+/CD38−/low subpopulation is composed of undifferentiated lymphoid-like cells that have low DNA synthesizing activity, low apoptotic activity, and resist serum and growth factors deprivation by upregulating their bcl-2 expression. Furthermore, these cells form morphologically a homogeneous population of cells (87% to 91%) expressing two levels of bcl-2 (low and high). These were present in MPB, CB, and BM, although the cells with low bcl-2 are more present in blood than in BM. The differences in bcl-2 expression suggest two functionally distinct subpopulations existing within the CD34s+/CD38−/low cells. We propose that cells with low bcl-2 are quiescent and reside within the resting stem cell compartment in the G00 phase of the cell cycle as shown in the model of stem cell kinetics described by Gordon and Blackett.44 These cells are capable of upregulating their bcl-2 expression. This hypothesis is shown when CD34s+/CD38−/low cells upregulated their bcl-2 not after 1 or 2 hours of incubation but after overnight incubation (results from 6 experiments). Further evidence for this hypothesis comes from our data on ex vivo expansion of hematopoietic cells showing the cells that were characterized on day 10 of culture as CD34+/CD38− expressed high-density bcl-2 as single population histogram. The presence of two functionally different subpopulations within the CD34+/CD38− was shown previously in vitro in hematopoietic precursors found in BM and CB.45 The authors identified cells producing colony-forming unit-cells (CFU-C) within the standard long-term culture-initiating cells (LTC-IC) assay period (5 to 8 weeks), and those who went beyond the 8-week period started proliferating in extended LTC-IC. Similarly in murine studies, functional distinction has been described between day-12 CFU-spleen cells and the more quiescent and primitive long-term repopulating cells.46
The results in the present study as well as two previous reports31,32 suggest that bcl-2 expression in CD34+ cells undergoing differentiation is important for maintaining the colony-forming potential. High bcl-2 expression is associated with high-intensity CD38 and increase in cell size suggesting that bcl-2 may play an important role in proliferating cells. These findings were further supported by a recent report showing that the exposure of hematopoietic progenitors to bcl-2 antisense decreased cell survival and inhibited the outgrowth of granulocyte-macrophage colony-forming cells.9
As with CD38 expression, the intensity of bcl-2 increased with increasing HLA-DR antigen expression. Fewer cells expressing low bcl-2 were found within the CD34s+/HLADR−/lowwhen compared with CD38−/low cells. In addition, CD34s+/HLA-DR−/low cells showed more heterogeneity when isolated by using 2-color IF cell sorting (data not shown).
Similar results were obtained by Rusten et al34 using immunomagnetic selection of normal adult BM precursors. A more homogeneous population of CD34+/CD38− cells was obtained compared with CD34+/HLA-DR−cells. The variation in the expression of bcl-2 within the CD38−/low and HLA-DR−/low on CD34s+ cells may reflect subpopulations with different functions and or maturity. In this regard, Rusten et al34showed that the two subpopulations differ in their primitive progenitor cell content. The CD34+/38− contained higher frequency of HPP-CFCS and LTC-ICS, whereas the CD34+/DR− cells contained more committed erythroid progenitors. Furthermore, Huang and Terstappen47reported that CD34+/CD38−/DR+, but not CD34+/CD38+/DR− fetal human BM cells have features of human hematopoietic stem cells in that they can give rise to each of the hematopoietic cell lineages in vitro. However, primitive hematopoietic stem cells have also been shown within the CD34+/HLA-DR− subset.48Furthermore, because of their low bcl-2 expression and small cell size, it is highly unlikely that the CD34s+/CD38−/low we have identified might be mistaken for lymphoid precursors.28 The CD34+subset of CD10+ lymphoid precursor cells have also been shown to express low bcl-2.28,29 Not only are these cells almost devoid of the tested lineage associated surface and cytoplasmic markers (<4% CD10+, <1% CD19+, <2% CD7+, <5%TdT+, and <2% MPO+, Perey et al, in press), but also lack the expression of CD38 antigen and reside in the CD34s+ compartment (Fig 1C). The majority of CD10+ lymphoid precursors in our hands were found within a population either expressing lower density CD34 antigen or lacking its expression. This is in agreement with those results reported for normal BM, showing the absence of B-lymphoid committed cells within CD34s+/CD38−/low defined on the basis of CD10 expression.49
The expression of bcl-2low and bcl-2high within the CD34s+ population is unlikely to be related to the permeabilization technique that we adopted for the measurement of intracellular proteins. The fixative we used (Ortho Permeafix) permeabilizes cells without altering their scatter features (Fig 1A) and their membrane or cytoplasmic staining.38,39Furthermore, this fixative has been used in a recent study in a quantitative flow cytometry assay to evaluate the bcl-2 level in normal BM and acute myeloid leukemia cells.50 Similarly, the expression of low and high bcl-2 within the CD34s+ is a stable phenomenon and unlikely to have been caused by postharvesting induction of bcl-2. The presence of double peaks was shown in all types of cells (MPB, CB, and BM) and after short-term incubation (1 hour and 2 hours).
It has been suggested that bcl-2 plays a potential role in maintaining long-term survival in a variety of cell types, in particular hematopoietic stem cells. However, recent data by Park et al31 provide evidence that bcl-xL, a functionally homologous protein16 may be essential for long-term survival in the early stages of hematopoiesis. The authors show that the immature quiescent CD34+/Lin−/CD38− cells are bcl-2 negative. The later cell subpopulation relies on bcl-xL for survival.
Our results show that bcl-x (in particular bcl-xL) is expressed in all subpopulations of hematopoietic precursors including the bcl-2low/CD38−/low/CD34s+cells. These cells were selected and shown to strongly express the bcl-xL protein as a single population histogram. The strong bcl-xL expression in the later cell subpopulation might be required to compensate for their low bcl-2 expression during early hematopoiesis by protecting them from apoptosis. Hematopoietic cells in fetal liver were shown to express both bcl-2 and bcl-x.43,51 However, the data provided by these studies support bcl-x as the predominant regulator of cell survival during embryonic hematopoiesis. Also, bcl-x in the fetus protects the hematopoietic cells as well as the nervous system against apoptosis.51 The nonlymphoid hematopoietic lineage remains unaffected in bcl-2-deficient mice.52 Our results and those previously reported are in favor of the bcl-xL potential role in maintaining the survival of hematopoietic stem cell populations.
We and others have shown that these cells have no or very low cell cycle activity as well as low apoptotic activity. We show that hematopoietic precursors (CD34s+/CD38−/low) are the lowest in expressing apoptotic proteins, ASP, Annexin V (data not shown), and bax, bad, and bak, in agreement with two recent reports showing that a small percentage of mobilized CD34 cells are entering apoptosis.53 54 So this study provides evidence for full viability and complete integrity of the quiescent precursors with low bcl-2 expression.
Nevertheless, the results on day 10 of ex vivo expansion show an upregulation of bax, bad, bak, and ASP within the CD34+/CD38− cell population. The culture condition that we have used was shown previously to expand hematopoietic cells that were successfully reinfused as an adequate alternative to MPB.37 Therefore, during ex vivo expansion, the expression of pro- and apoptotic proteins needs to be monitored to define the best culture condition. These conditions should be chosen in such a way as to keep the primitive precursors from entering apoptosis. These results highlight the need for understanding the complex process that regulates apoptosis.
ACKNOWLEDGMENT
We are very grateful to Prof George Janossy (Department of Clinical Immunology, Royal Free Hospital School of Medicine, London, UK) for helpful advice and critical suggestions. We thank Dr Curzio Ruegg for helpful suggestions and comments and Dr Philippe Jaunin and Mrs Eveline Faes for superb technical assistance. We thank the department of Gynecology for providing umbilical cord blood for use in this study. We gratefully acknowledge the following pharmaceutical companies: Serono for kindly providing us with IL-6, Amgen for SCF, and Sandoz for IL-3. Special thanks is given to Mrs Martine van Overloop for typing the manuscript.
Supported by grants from La Recherche Suisse contre le Cancer (KFS 170-9-1995), La Ligue Vaudoise contre le Cancer, and La Société de la Loterie de la Suisse Romande.
Address reprints requests to Rowayda Peters, MSc, PhD, Centre Pluridisciplinaire d’Oncologie, CHUV, BH 06, Rue du Bugnon, 1011 Lausanne, Switzerland; e-mail: Serge.Leyvraz@chuv.hospvd.ch.
The publication costs of this article were defrayed in part by page charge payment. This article must therefore be hereby marked "advertisement" is accordance with 18 U.S.C. section 1734 solely to indicate this fact.

