Abstract
The vav gene is expressed in all hematopoietic but few other cell types. To explore its unusual compartment-wide regulation, we cloned the murine gene, sequenced its promoter region, identified DNase I hypersensitive (HS) sites in the chromatin, and tested their promoter activity with a β-galactosidase (β-gal) reporter gene in cell lines and transgenic mice. Whereas fibroblasts had no HS sites, a myeloid and an erythroid cell line contained five, located 0.2 kb (HS1), 1.9 kb (HS2), and 3.6 kb (HS3) upstream from the transcription start and 0.6 kb (HS4) and 10 kb (HS5) downstream. A vav DNA fragment including HS1 promoted β-gal expression in a myeloid but not a fibroblast line. Expression in leukocytes of transgenic mice also required HS2 and HS5. Only hematopoietic organs contained β-gal, but virtually all β-gal+ cells were B or T lymphocytes. Expression was always variegated (mosaic), and the proportion of β-gal+ cells declined with lymphoid maturation and animal age. Thus, these vav regulatory elements promoted hematopoietic-specific expression in vivo, at least in lymphocytes, but the transgene was sporadically silenced. Maintaining pan-hematopoietic expression may require additional vavelements or an alternative reporter.
THE vav GENE, DISCOVERED through its inadvertent oncogenic activation during transfection experiments, proved to be widely expressed in hematopoietic cells.1 Its polypeptide sequence implicated Vav in signal transduction as a GTP/GDP exchange factor regulating a G-protein of the Rho/Rac/CDC42 family.2 As reviewed by Bonnefoy-Bérard et al,3 engagement of diverse receptors on hematopoietic cells leads to rapid tyrosine phosphorylation of the 95-kD Vav polypeptide, and the phosphorylated Vav has been shown recently to activate the Rac/Jun kinase pathway.4 Gene disruption has established that Vav is essential for signaling through the antigen receptors of lymphocytes but not for the development of hematopoietic cells.5-8
The unique feature of the vav gene is its expression pattern. Virtually all hematopoietic cell lines, irrespective of lineage or stage of development, contain vav mRNA and protein, as do all normal adult and fetal hematopoietic cell types.1,2,9,10 In contrast, vav expression outside the hematopoietic system is confined to embryonic stem cells,11 the developing tooth,10 testicular germ cells,12 and the extra-embryonic trophoblast, in which vav expression is essential for implantation.8
The cis-acting DNA elements that allow lineage-specific expression of a gene are becoming better understood. As well as the proximal promoter, where the transcription initiation complex forms, various enhancer elements within or near the gene augment transcription in specific cell types. These elements can frequently be detected in chromatin from the relevant cells by their hypersensitivity to digestion with DNase I.13 Many enhancers can stimulate transcription of a linked reporter when introduced into cell lines, but the more rigorous context of the transgenic animal often shows the need for additional elements. For example, a region of the β-globin locus marked by a cluster of DNase I hypersensitive (HS) sites in erythroblasts is thought to establish a large domain of transcriptional competence.14 The presence of this locus control region (LCR) within a transgene allows efficient expression in the relevant cells, regardless of its point of insertion into the genome.15 Whereas both the enhancer and the LCR traditionally have been thought to increase the frequency at which RNA polymerase molecules initiate transcription, recent findings suggest that they may instead increase the probability for a given cell that an initiation complex will form.16,17 If the positive regulatory elements carried by a transgene are not sufficiently potent, repressive effects from surrounding chromatin can extinguish its expression in clones of cells, producing a variegated or mosaic pattern of expression (reviewed by Martin and Whitelaw18).
In contrast to the considerable progress on the regulation of genes expressed in specific lineages, almost nothing is known about compartment-wide regulation. For example, does control of vavgene expression require a combination of promoters and enhancers specific for the individual hematopoietic lineages or does thevav locus contain some element common to all genes expressed in this compartment? Studying vav gene regulation should clarify such issues and eventually enable construction of a transgenic promoter that can target the expression of any gene to the entire compartment.
To explore the regulation of vav expression, we cloned the mouse gene, characterized its promoter, and searched for DNase I HS sites in the chromatin surrounding the gene. Having identified five HS sites in its 5′ region, we then sought to establish whether fragments spanning various of these sites could drive hematopoietic-specific expression, first in cell lines and then in transgenic mice. For these tests, the vav locus fragments were coupled to the Escherichia coli lacZ(β-galactosidase [β-gal]) gene; the widely usedβ-gal reporter gene allows sensitive enzymatic tests for promoter activity, including a flow cytometric assay well suited to hematopoietic cells.19 20 Hematopoietic-specific activity of the vav-βgal reporter was indeed demonstrable both in cell lines and mice, but the expression in vivo was unexpectedly restricted to lymphocytes and appeared to be sporadically silenced.
MATERIALS AND METHODS
Cloning the murine vav gene and analysis of HS sites.
A 2.5-kb mouse vav cDNA probe2 was used to screen 106 plaques from a mouse genomic library (Stratagene, La Jolla, CA). Four clones spanning greater than 50 kb were isolated. The approximate positions of vav exons were mapped by Southern analysis of the genomic clones using fragments of thevav cDNA as probes.
HS sites were detected by the protocol of Dr P. Cockerill (Hansen Centre for Cancer Research, Institute for Medical and Veterinary Research, Adelaide, Australia). Cells (4 × 10⁷) were washed in cold phosphate-buffered saline (PBS), resuspended in 30 mL of lysis buffer (60 mmol/L KCl, 15 mmol/L NaCl, 5 mmol/L MgCl2, 10 mmol/L Tris-HCl, pH 7.4, 300 mmol/L sucrose, 0.1 mmol/L EGTA, 0.1% NP40, 0.5 mmol/L phenylmethyl sulfonyl fluoride, 5 μg/mL leupeptin, and 10 μg/mL aprotinin) and centrifuged at 400g for 5 minutes. The pelleted nuclei were adjusted with nuclei buffer (lysis buffer containing 1 mmol/L CaCl2without NP40 or protease inhibitors) to a DNA concentration of 0.4 mg/mL, and 500-mL aliquots were digested with 0 to 15 μg/mL DNase I (Worthington Biochemical Corp, Freehold, NJ) at 22°C for 3 minutes. The reaction was stopped by adding 3.5 mL stop buffer (0.3 mol/L sodium acetate, 0.5% sodium dodecyl sulfate, 5 mmol/L EDTA, 200 μg/mL proteinase K) and incubated at 55°C for 2 hours. The DNA was then extracted and subjected to Southern analysis.
Sequencing and RNase protection.
The 987-bp Hpa I-Sac I fragment of vav genomic DNA encompassing the proximal promoter and 5′ untranslated region was cloned into HincII-Sac I–digested Bluescript SK− (Stratagene) and sequenced on both strands. Putative transcription factor binding sites were identified using a database maintained by Dr D. Ghosh (National Institutes of Health, Bethesda, MD). The plasmid was linearized with AccI and α32P-UTP–labeled antisense RNA probe of 356 bp synthesized. The probe was hybridized to 2 μg poly(A)+RNA from cell lines or 10 μg tRNA, and RNase-resistant products were resolved on a 6% denaturing polyacrylamide gel.
Transgene construction.
The β-galactosidase (β-gal) gene, modified to include a mammalian consensus sequence for translation initiation, was a kind gift from Dr E. Stanley (The Walter and Eliza Hall Institute of Medical Research, Melbourne, Australia). The promoterless vector,β-gal, which includes a 1.1-kb rabbit β-globin polyadenylation signal21 downstream of the reporter, was the substrate for construction of the transgenes (see Figs 4 and 5). HS1 vav-βgal was constructed by introducing a 965-bpHpa I-Nae I fragment upstream of the reporter gene. HS21 vav-βgal included a 2.3-kb EcoRI-Nae Ivav promoter fragment, whereas HS321 vav-βgalcontained 4 kb of vav sequence 5′ of the Nae I site. To produce HS1/5 vav-βgal, a 2-kb BamHI HS5 fragment was cloned into HS1 vav-βgal downstream of the polyadenylation sequence. Similarly, a 3.7-kb Kpn I HS5 fragment was cloned into HS21 vav-βgal and HS321vav-βgal to give HS21/5 vav-βgal and HS321/5vav-βgal. To introduce HS4, a 0.7-kb HpaI-BamHI fragment was cloned between the β-galpolyadenylation sequence and HS5 to give HS21/45 vav-βgal and HS321/45 vav-βgal. Thus, both HS4 and HS5 lie 3′ to theβ-gal transcription unit. The positive control vector, SRα-βgal, was constructed by cloning the SRα promoter22 into β-gal. Luciferase reporter constructs were made by cloning the appropriate vav promoter fragments into the Sma I site of the pGL2-Basic vector (Promega, Madison, WI). SRα-lux and pA3RSV-lux plasmids were gifts from Drs A. Trout and T. Kay (The Walter and Eliza Hall Institute of Medical Research) and the pGL2-Promoter vector was obtained from Promega.
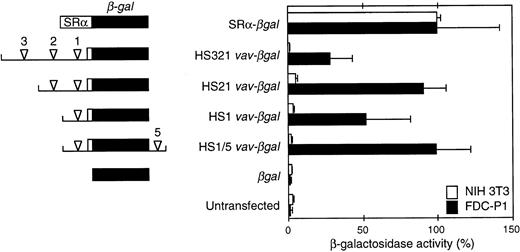
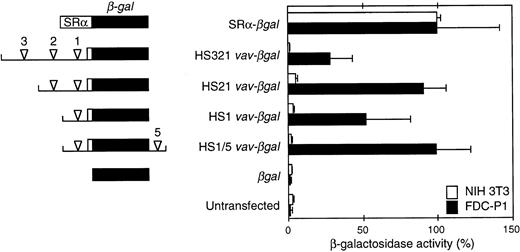
Activity of β-gal reporter constructs in a stably transfected hematopoietic cell line (FDC-P1) and NIH3T3 fibroblasts.vav DNA fragments encompassing the indicated HS sites (arrowheads) were linked to the β-gal gene (lacZ) and a β-globin intron and polyadenylation signal (see the Materials and Methods). The unfilled box denotes vav 5′ untranslated sequences. Where included, the HS5 intronic site was placed 3′ of the reporter polyadenylation site. The β-gal activity in extracts from three to five independent pools of FDC-P1 transfectants and two to three pools of NIH3T3 transfectants (3 independent determinations per pool) was related to that of a pool transfected with a construct containing the SRα promoter (assigned 100% activity). Means (±SEM) of the results are shown.
Activity of β-gal reporter constructs in a stably transfected hematopoietic cell line (FDC-P1) and NIH3T3 fibroblasts.vav DNA fragments encompassing the indicated HS sites (arrowheads) were linked to the β-gal gene (lacZ) and a β-globin intron and polyadenylation signal (see the Materials and Methods). The unfilled box denotes vav 5′ untranslated sequences. Where included, the HS5 intronic site was placed 3′ of the reporter polyadenylation site. The β-gal activity in extracts from three to five independent pools of FDC-P1 transfectants and two to three pools of NIH3T3 transfectants (3 independent determinations per pool) was related to that of a pool transfected with a construct containing the SRα promoter (assigned 100% activity). Means (±SEM) of the results are shown.
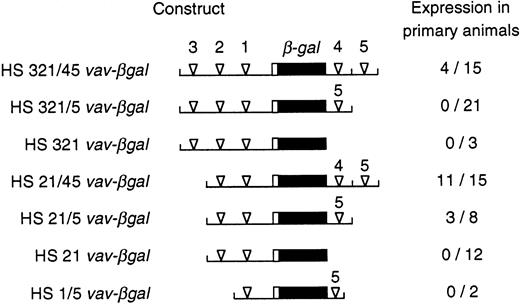
Expression of vav-βgal transgenes in primary transgenic animals. For the indicated reporter constructs, the proportion of primary animals that showed any β-gal+cells in the blood is given. The constructs analyzed were those used in the stable transfection experiments (see Fig 4), plus others containing an additional intronic hypersensitive site (HS4), also placed 3′ of the polyadenylation site in the reporter gene.
Expression of vav-βgal transgenes in primary transgenic animals. For the indicated reporter constructs, the proportion of primary animals that showed any β-gal+cells in the blood is given. The constructs analyzed were those used in the stable transfection experiments (see Fig 4), plus others containing an additional intronic hypersensitive site (HS4), also placed 3′ of the polyadenylation site in the reporter gene.
Cells and transfections.
FDC-P1 myeloid cells, EL-4 T cells and NIH3T3 fibroblasts were maintained in Dulbecco's modified Eagle's medium supplemented with 10% fetal calf serum. Stable transfectants were produced by coelectroporation (FDC-P1 cells) or lipofection (NIH3T3 cells) of 10 μg linearized vav-βgal plasmid and 0.5 μg pSV2neo. Pools of transfectants selected in 800 μg/mL G418 (Geneticin; GIBCO, Grand Island, NY) for FDC-P1 cells or 400 μg/mL G418 for NIH3T3 cells were analyzed for β-gal activity after 2 weeks. For transient transfections, cells were electroporated with 10 μg of a construct and harvested after 18 (EL-4), 30 (FDC-P1), or 40 hours (NIH3T3) for luciferase assay. A β-gal plasmid was included to control for transfection efficiency.
4-Methylumbelliferyl-β-D-galactoside (MUG) and luciferase assays.
The MUG assay was performed as described.23 An aliquot of extract (1% to 10% of the lysate from 105 cells) was assayed in a TKO mini-fluorimeter (Hoefer Pharmacia Biotech, San Francisco, CA). For each experiment, a standard curve was produced with known concentrations of the fluorescent product 4-methylumbelliferone (Sigma, St Louis, MO). Luciferase assays were performed as described.24 Cells were lysed by repeated freeze-thaw cycles, and 5 μg of extract protein diluted in glycylglycine buffer containing 60 μmol/L luciferin was assayed using a Lumat LB 9501 luminometer (Berthold, Wildbad, Germany).
Transgenic mice.
Each transgene fragment was separated from the plasmid vector by electrophoresis of HindIII-digested plasmid DNA, slot-elution, and ethanol precipitation. The purified DNA was microinjected into the male pronuclei of fertilized (C57BL/6J × SJL/J) F2 eggs, which were then transferred to pseudo-pregnant females.25 To identify transgenic pups, DNA extracted from tail biopsies was dotted in duplicate onto nitrocellulose, along with nontransgenic DNA spiked with varying copy-number equivalents of the transgene and the blot hybridized with a lacZ cDNA probe.
Fluorescence-activated cell sorting (FACS)-gal analysis of β-gal activity.
For analysis of leukocytes, blood samples were subjected to red blood cell lysis in 156 mmol/L NH4Cl, 0.1 mmol/L EDTA, 12 mmol/L NaHCO3; washed; and resuspended in cold PBS/2% calf serum (CS). β-gal activity was determined as described.19Briefly, a working solution of 2 mmol/L fluorescein di-galactoside (FDG) in ethanol/dimethylsulfoxide/water (1:1:98) was warmed to 37°C for 5 minutes in the dark. Cells were incubated at 37°C for 75 seconds with an equal volume of the prewarmed FDG, and substrate loading was stopped with 10 vol ice-cold PBS/2% CS. Propidium iodide (PI) was added (final concentration, 1 μg/mL), and the cells were incubated for 2 hours on ice. From 2,000 to 10,000 live leukocytes were then analyzed on a FACScan (Becton Dickinson, San Jose, CA) with Lysis II software. A forward scatter gate excluded debris and residual red blood cells, whereas dead cells were excluded by PI uptake. Femoral bone marrow cells and single-cell suspensions prepared from thymus, spleen, and mesenteric lymph nodes by passage through wire mesh were loaded with FDG and analyzed similarly. Samples from nontransgenic (C57 × SJL) F1 mice and Rosa26 β-geo transgenic mice26 provided routine controls.
Simultaneous FACS analysis for β-gal and surface markers.
Cells loaded with FDG as described above were incubated in saturating quantities of biotin-labeled anti-cell surface marker-specific antibodies,27 together with an anti-Fcγ receptor antibody (2.4G2) to reduce nonspecific binding28 and streptavidin-Texas red (Amersham, Little Chalfont, Bucks, UK) as the secondary reagent. Monoclonal antibodies used included anti-B220 (RA3-6B2), anti-CD4 (H129.19.6.8), anti-CD8 (YTS-169), anti-Thy1 (T24.31.2) anti-IgM (anti-Cμ.5.1), anti-IgD (11-26C), anti-Mac1 (M1/70), anti-Gr1 (RB6-8C5), and anti-Ter119. After staining, cells were washed and resuspended in a buffered salt solution29containing 2% CS, 10 mmol/L NaN3, and 1 μg/mL PI. At least 104 viable nucleated cells were analyzed, using a FACStar+ or modified FACS-II flow cytometer.
Immunoblotting.
Tissue lysates were made by homogenizing 0.1 g of tissue in 1 mL RIPA buffer (52 mmol/L Tris-HCl, 157 mmol/L NaCl, 1 mmol/L EDTA, 0.1% Triton X-100) containing 1 tablet of Boehringer Mannheim Complete Protease inhibitors (Boehringer Mannheim, Mannheim, Germany) per 50 mL RIPA using a Dounce homogenizer. Lysates were mixed at 4°C for 15 minutes and centrifuged at 10,000g for 10 minutes to remove nuclei. Protein concentrations were determined using the Bio-Rad Detergent Compatible Protein assay reagents (Bio-Rad, Hercules, CA) and bovine serum albumin standards.
Cell lysates (50 μg protein) were electrophoresed in 7.5% polyacrylamide gels and transferred to Hybond C Extra (Amersham). Membranes were blocked overnight at 4°C in 1% Blocking Reagent (Boehringer Mannheim) in PBS and then incubated for 1 hour in a 1:2,000 dilution of antihuman Vav (Upstate Biotechnology, Lake Placid, NY) or anti–β-gal (Boehringer Mannheim) monoclonal antibodies. After incubation with 1:1,000 sheep antimouse Ig monoclonal antibody-horseradish peroxidase (Silenus, Melbourne, Australia), the secondary antibody was detected using the Amersham ECL system.
RESULTS
Hematopoietic-specific HS sites in the vav locus.
Our search for cis-acting elements regulating transcription of the vav gene was initiated by cloning and characterizing the mouse vav genomic locus. The four phage clones obtained span over 50 kb of genomic sequence (Fig 1). Only the most 3′ clone did not overlap with the others, and the uncloned region was estimated by genomic Southern blot analysis to be approximately 5 kb. Southern analysis of the clones, using vavcDNA fragments as probes, indicated that the gene contains at least 14 exons (Fig 1).
The murine vav locus and DNase I hypersensitive sites. Cloned genomic sequences are shown as a solid line, with the relevant phage clones above. An uncloned gap of approximately 5 kb lies between λ7.2 and λ20.1. Approximate positions of exons (shown as boxes) were assigned by Southern blotting of enzyme-restricted phage clones using cDNA fragments as probes; only the first and second of at least 14 exons are numbered. The major DNase I hypersensitive sites are indicated by large triangles and minor, inconsistent sites are indicated by small triangles. The expanded map shows the positions of the five major HS sites in more detail, with the 5′ UTR of exon 1 depicted as an open box and the coding region filled. The bar below indicates the sequenced proximal promoter region (see text). Abbreviations: A, Ava I; B, BamHI; Bg, Bgl II; Hp, Hpa I; H, HindIII; K, Kpn I; N, NcoI; Ne, Nae I; R, EcoRI; S, Sac I; X,Xba I. Not all sites for these enzymes are shown.
The murine vav locus and DNase I hypersensitive sites. Cloned genomic sequences are shown as a solid line, with the relevant phage clones above. An uncloned gap of approximately 5 kb lies between λ7.2 and λ20.1. Approximate positions of exons (shown as boxes) were assigned by Southern blotting of enzyme-restricted phage clones using cDNA fragments as probes; only the first and second of at least 14 exons are numbered. The major DNase I hypersensitive sites are indicated by large triangles and minor, inconsistent sites are indicated by small triangles. The expanded map shows the positions of the five major HS sites in more detail, with the 5′ UTR of exon 1 depicted as an open box and the coding region filled. The bar below indicates the sequenced proximal promoter region (see text). Abbreviations: A, Ava I; B, BamHI; Bg, Bgl II; Hp, Hpa I; H, HindIII; K, Kpn I; N, NcoI; Ne, Nae I; R, EcoRI; S, Sac I; X,Xba I. Not all sites for these enzymes are shown.
We searched for potential regulatory regions within the gene by sensitivity of the chromatin to DNase I. Because we expected HS sites associated with relevant regulatory elements to be hematopoietic specific, cells of two hematopoietic lineages, FDC-P1 myeloid cells and C88 erythroleukemia cells, were compared with NIH3T3 fibroblasts as a representative nonhematopoietic cell type. Appropriate selection of restriction enzyme digests and vav probes allowed us to screen a 60-kb region of chromatin spanning the gene.
No HS sites were found in the fibroblasts, but both hematopoietic cell lines contained several prominent sites (Figs 1 and2), and a preliminary analysis of bone marrow and thymus showed the same pattern. The shared HS sites argue that vav transcription probably is regulated by mechanisms common to diverse hematopoietic lineages. The HS sites were positioned by mapping with several restriction enzymes and, wherever possible, by probing with DNA fragments located both 5′ and 3′ of each site. The sites denoted HS1, HS2, and HS3 mapped approximately 0.2, 1.9, and 3.6 kb upstream from the transcription start site (Fig 3), whereas two others (HS4 and HS5) were located within the first intron at +600 bp and +10 kb. HS1 and HS4 were analyzed in most detail in the erythroleukemia cells (Fig 2D and E). Higher resolution mapping of HS1 (Fig 2E) resolved it into HS1a, a strong site centered around −0.1 kb (best seen in the SacI digest in Fig 2E), and HS1b, a region of weaker hypersensitivity located near −0.5 kb (seen in the Hpa I digest in Fig2E).
DNAse I hypersensitive site mapping of the vavgenomic locus in hematopoietic cells and fibroblasts. (A) Diagrams of the probes, digests, and observed fragment sizes (in kilobases) that delineated the five major HS sites in (B) through (D). Exons are shown as solid boxes. Nuclei from FDC-P1 cells and NIH3T3 fibroblasts (B and C) or C88 murine erythroleukemia (MEL) cells (D) were digested with increasing amounts of DNase I followed by Southern analysis of extracted DNA, using the indicated restriction enzyme/probe combinations. The sizes of the germline fragments (G) and the DNase I cleavage products at each HS site are indicated in kilobases. The additional germline band of approximately 4.5 kb in NIH3T3 cells (B) reflects a polymorphic Bgl II site approximately 1 kb 5′ of the first vav exon. In (C), the 4.7-kb band (G 4.7) reflects detection of the 4.7-kb germline Xba fragment (see [A]) by exon I sequences in cDNA probe b. On prolonged exposure, bands corresponding to HS2,1 and 4 were also seen. In (E), fine mapping of the proximal vav promoter demonstrates that HS1 comprises two sites approximately 400 bp apart. The positions of the stronger HS1a and weaker HS1b sites and probes c and d are indicated on the diagram. Abbreviations: X, Xba I; S, Sac I; Hp,Hpa I; Bg, Bgl II.
DNAse I hypersensitive site mapping of the vavgenomic locus in hematopoietic cells and fibroblasts. (A) Diagrams of the probes, digests, and observed fragment sizes (in kilobases) that delineated the five major HS sites in (B) through (D). Exons are shown as solid boxes. Nuclei from FDC-P1 cells and NIH3T3 fibroblasts (B and C) or C88 murine erythroleukemia (MEL) cells (D) were digested with increasing amounts of DNase I followed by Southern analysis of extracted DNA, using the indicated restriction enzyme/probe combinations. The sizes of the germline fragments (G) and the DNase I cleavage products at each HS site are indicated in kilobases. The additional germline band of approximately 4.5 kb in NIH3T3 cells (B) reflects a polymorphic Bgl II site approximately 1 kb 5′ of the first vav exon. In (C), the 4.7-kb band (G 4.7) reflects detection of the 4.7-kb germline Xba fragment (see [A]) by exon I sequences in cDNA probe b. On prolonged exposure, bands corresponding to HS2,1 and 4 were also seen. In (E), fine mapping of the proximal vav promoter demonstrates that HS1 comprises two sites approximately 400 bp apart. The positions of the stronger HS1a and weaker HS1b sites and probes c and d are indicated on the diagram. Abbreviations: X, Xba I; S, Sac I; Hp,Hpa I; Bg, Bgl II.
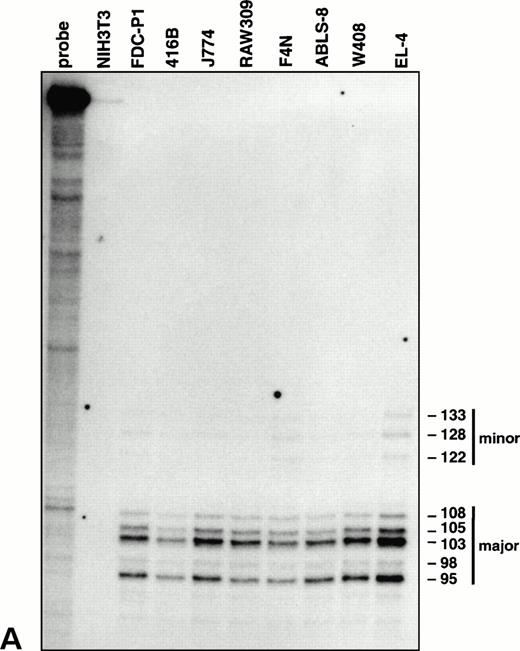
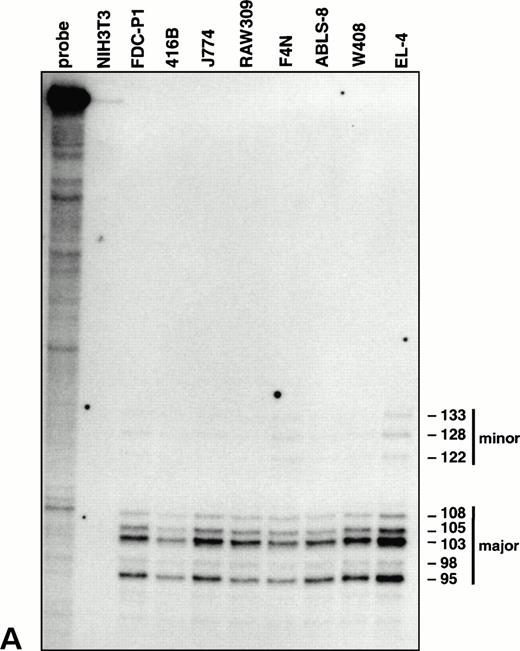
Characterization of the vav promoter. (A) RNase protection analysis showing major and minor clusters of transcriptional initiation sites for the vav gene in lymphoid (EL-4, W408, and ABLS-8), erythroid (F4N), monocytic (RAW309 and J774), and early myeloid (416B and FDC-P1) cells. No transcripts were detected in NIH3T3 fibroblasts. The length of each protected fragment, numbered from the ATG translation start, was determined from a sequencing reaction run in parallel (not shown). The undigested probe was 356 bp in length.
Characterization of the vav promoter. (A) RNase protection analysis showing major and minor clusters of transcriptional initiation sites for the vav gene in lymphoid (EL-4, W408, and ABLS-8), erythroid (F4N), monocytic (RAW309 and J774), and early myeloid (416B and FDC-P1) cells. No transcripts were detected in NIH3T3 fibroblasts. The length of each protected fragment, numbered from the ATG translation start, was determined from a sequencing reaction run in parallel (not shown). The undigested probe was 356 bp in length.
Sequence of the vav promoter.
To delineate the initiation site for vav transcription, RNase protection experiments were performed on mRNA from cell lines representative of diverse hematopoietic lineages. All these RNA samples yielded a pattern of fragments corresponding to a cluster of major and minor start sites 95 to 133 bp upstream of the translation initiation codon (Fig 3A), near the multiple start sites mapped for the humanvav mRNA.30 Thus, a single vav promoter appears to be operative throughout the hematopoietic compartment. In agreement with this conclusion, tests for amplification of 5′ ends of vav mRNA by RACE,31 using a primer located in the second exon, generated a product of equivalent size from four different hematopoietic cell types but none from NIH3T3 cells (data not shown).
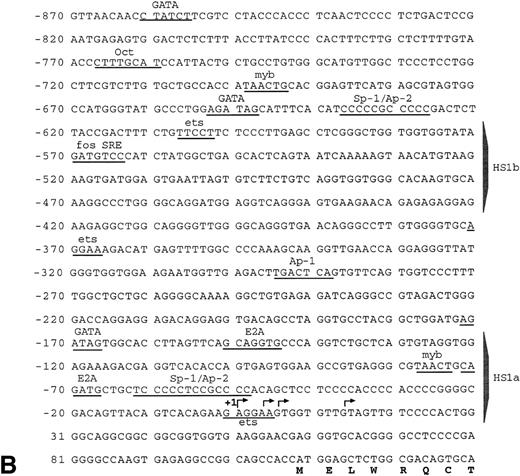
To facilitate further dissection of the promoter, we sequenced a 981-bpHpa I-Sac I fragment extending 5′ of thevav translation initiation codon (Fig 3B). The vavpromoter is GC rich (55% overall for the region from −870 to +1 bp) and lacks identifiable core promoter elements such as a TATA box or an initiator. Consistent with other promoters of this type (reviewed by Ernst and Smale32), it contains an Sp1 binding site 50 to 60 bp upstream of the cluster of major transcriptional start sites (Fig3B). In the region −150 bp to +1 bp there is 61% identity with the published human vav promoter sequences.30 This region of high homology, which corresponds to the dominant HS1a region of hypersensitivity (Fig 2E), includes the Sp1 consensus binding site. The murine vav promoter sequence also contains potential binding sites for a number of additional ubiquitous transcription factors (eg, Ap-1, Ap-2, and E-box factors) as well as for tissue-restricted ones such as GATA, Myb, Oct, and Ets proteins (Fig3A). No direct evidence that they participate in vav gene regulation is yet available.
Hematopoietic-specific expression in stably transfected cell lines.
To assess promoter activity, potential vav regulatory regions bearing HS sites were coupled to a β-gal reporter. FDC-P1 and NIH3T3 cells were stably transfected with each construct, as well as a promoterless negative control and βgal driven by the potent SRα promoter.22 Figure 4 shows the β-gal activity in extracts of pools of the transfected cells, as determined by a sensitive fluorescence (MUG) assay. In both cell types, the positive control SRα-βgal gave 40-fold higher activity than the promoterless reporter or the level in untransfected cells. All fourvav regions tested, which included one to three of the upstream HS sites (HS1, HS21, or HS321) or HS1 plus intron site HS5 (HS1/5), were active in FDC-P1 cells but inert in NIH3T3 cells. Thus, even the proximal promoter fragment containing only HS1 exhibited marked hematopoietic specificity. Indeed, the HS1 vav-βgal construct was nearly as active in FDC-P1 cells as SRα-βgal, and the addition of the HS2 or HS5 region augmented activity to levels similar to those observed with this powerful promoter. In contrast, the inclusion of HS3 consistently decreased activity several fold. In confirmation of these results, histochemical (X-gal) and flow cytometric (FACS-gal) assays also showed that the vav promoter fragments functioned only in the FDC-P1 transfectants, and the pools bearing the HS1, HS21, and HS1/5 vav-βgal constructs exhibited much higher activity than those harboring the HS321 region (data not shown). These data suggested that HS2 and HS5 might contain enhancers, whereas a negative regulatory element might reside within the HS3 segment.
Low vav promoter activity in transiently transfected cells.
To determine whether the vav promoter could also function in transiently transfected cells, we first tested the HS1 and HS21vav-βgal constructs in FDC-P1 cells and the T-cell line EL-4. No activity was evident, but the efficiency of electroporation with these lines was not high enough to have shown low activity. Hence, we turned to the more sensitive luciferase (lux) reporter and compared these promoter fragments with the SRα and Rous Sarcoma virus (RSV) promoter in FDC-P1, EL-4, and NIH3T3 cells (Table1). Hematopoietic specificity was evident in that neither the HS1vav-lux nor the HS21 vav-lux construct was active in the fibroblasts, whereas they exhibited twofold to fivefold higher activity than the basal SV40 promoter in the hematopoietic lines. Nevertheless, their activity in those lines was much lower than that of the SRα or RSV promoter and, indeed, reached only a few percent of the SRα value. To assess whether the vav regulatory elements could act as transcriptional enhancers on a heterologous promoter, the HS1, HS21, and HS321 vav fragments were cloned upstream of the SV40 basal promoter. In the hematopoietic cell lines, the HS1 and HS21vav SV40-lux constructs displayed weak activity, comparable to that of the corresponding constructs without the SV40 promoter, and no activity was evident in the fibroblasts. Inclusion of the HS3 region decreased activity, consistent with the negative regulatory effect observed with it in stably transfected cells (Fig 4). Thus, the vav promoter elements appear to be far more active when stably introduced into cells (see Discussion).
Hematopoietic-specific expression in vav-βgal mice.
To extend the analysis to in vivo regulation, we generated transgenic mice bearing seven β-gal reporter constructs of the type tested in vitro (Fig 5). Analysis of peripheral blood from primary transgenic animals showed some in which the transgene was expressed (see below). Dot blot analyses showed comparable transgene copy numbers in the expressing and nonexpressing animals. To allow more extensive analysis, two to four animals for each construct were bred to generate independent progeny lines. Southern blot analysis on DNA from expressing lines confirmed that all had a low copy number, from 1 to 4 per haploid genome, as judged by phosphorimager analysis (data not shown).
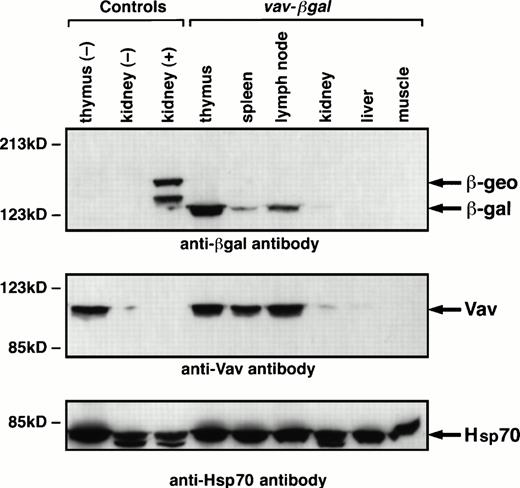
When transgenic lines exhibiting β-gal activity in the blood had been established, hematopoietic specificity was assessed by immunoblotting extracts of organs of mice carrying HS21/5 vav-βgal. These and all subsequent experiments included nontransgenic negative controls and positive controls from Rosa26 mice, in which a β-galfusion gene (β-geo) is expressed ubiquitously.26 The Western blots indicated that expression of the vav-βgal transgene probably was, as expected, restricted to hematopoietic tissues (Fig6). In the thymus, where a high proportion of cells express the transgene (see below), β-gal was abundant, as was Vav. In spleen and lymph nodes, β-gal was discernible, but the band was weaker than that of Vav; results presented below suggest that this reflects a lower proportion of β-gal–expressing cells. No β-gal appeared in adult liver, muscle, brain, or lung (not shown), and the trace in the kidney might reflect contaminating blood cells, because a trace of Vav was also detected (Fig 6). Unexpectedly, no expression was observed in fetal liver (data not shown), a rich source of erythroid cells.
Immunoblots showing β-gal and Vav proteins in tissue extracts. The tissue extracts derived from HS21/5 vav-βgalmice, nontransgenic (negative control) mice, or Rosa26 (positive control) animals. The blots were probed with monoclonal antibodies to p95Vav or β-gal and, as a loading control, antibody to Hsp70, and bands were shown with a sheep antimouse Ig reagent. ThelacZ-neo gene fusion in Rosa26 animals consistently yields a 146-kD polypeptide (β-geo) and a smaller product (125 kD), perhaps related to the two transcripts observed in these mice.26
Immunoblots showing β-gal and Vav proteins in tissue extracts. The tissue extracts derived from HS21/5 vav-βgalmice, nontransgenic (negative control) mice, or Rosa26 (positive control) animals. The blots were probed with monoclonal antibodies to p95Vav or β-gal and, as a loading control, antibody to Hsp70, and bands were shown with a sheep antimouse Ig reagent. ThelacZ-neo gene fusion in Rosa26 animals consistently yields a 146-kD polypeptide (β-geo) and a smaller product (125 kD), perhaps related to the two transcripts observed in these mice.26
These results were confirmed by staining organs of a HS21/5vav-βgal mouse with X-gal to show β-gal activity (data not shown). The thymus stained strongly and the spleen and lymph nodes moderately, whereas the heart, liver, lung, brain, kidney, and muscle failed to stain. Thus, expression of the vav transgene indeed appeared to be restricted to hematopoietic tissues.
Delineation of the vav regions required for expression in vivo.
β-gal expression in the peripheral blood of primary transgenic mice and their progeny was assessed by the sensitive FACS-gal assay.19 20 Upstream vav regulatory regions alone proved insufficient. Whereas HS21 or HS321 vav-βgal were active in FDC-P1 cells (Fig 4), blood from a total of 15 primary transgenic animals bearing these two constructs exhibited no β-gal+ cells (Fig 5). On the other hand, three of the four constructs that also contained intron site HS5 did yield a number of animals showing expression (Fig 5). Thus, this site appears vital for in vivo function. Other sites clearly influenced the proportion of mice that showed expression. The combination of HS5 plus the HS1-bearing promoter region appeared inadequate, although unfortunately only two HS1/5 vav-βgal lines were obtained. In contrast, HS21/5 vav-βgal, bearing the two proximal upstream HS sites, yielded β-gal+ blood cells in three of eight animals, and the further addition of intron site HS4 increased the frequency of expression for HS21/45 vav-βgal to 11 of 15 primary animals (73%).
Thus, the minimal region required for in vivo activity encompassed HS1, HS2, and HS5. Consistent with the cell line data, distal upstream site HS3 had a negative influence, because none of 21 independent founders bearing HS321/5 vav-βgal had detectable β-gal+blood cells (Fig 5). Nevertheless, HS321/45 vav-βgal, which also includes the proximal intron site HS4, yielded activity in 4 of 15 founders. Hence, HS4 appears to partially counter HS3 and augment the proportion of integration sites that allow expression (by χ2 test, P < .02).
Only a proportion of blood cells exhibited vav-βgalexpression.
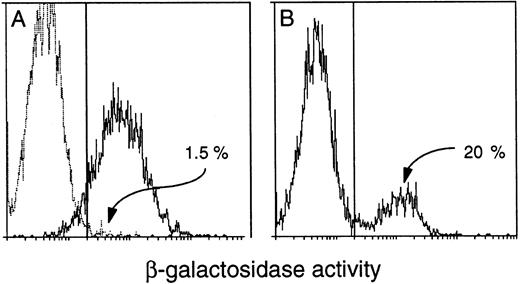
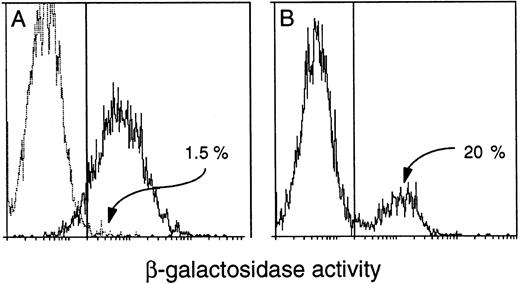
All transgenic progeny of each primary mouse that showed expression proved to express the transgene in peripheral blood. However, to our surprise, only approximately 15% to 40% of the leukocytes from either the founders or their progeny were β-gal+. The Rosa26 results clearly showed that all white blood cells could express β-gal activity under our conditions (Fig 7A), but thevav-βgal leukocytes invariably fell into distinct expressing and nonexpressing populations (Fig 7B). This unexpected result might indicate that transgene expression was (1) restricted to certain hematopoietic lineages, (2) confined to certain developmental stages within a lineage, or (3) mosaic (variegated) for a given cell type. Remarkably, all three types of restriction have proven to be operative. Because we also unexpectedly found that the proportion of β-gal+ blood cells decreased with age of the mice (see below), routine analyses were confined to animals less than 10 weeks old.
Detection of β-gal+ cells in the blood of transgenic mice. FACS-gal analysis of viable peripheral blood leukocytes from (A) a (C57BL/6 × SJL) F1 negative control mouse (broken line) and a Rosa26 positive control (solid line) and (B) a HS21/5 vav-βgal transgenic mouse. Cells were analyzed for β-gal activity (represented on the X-axis by mean fluorescence units). The proportion of expressing cells was determined after setting the window to yield less than 5% β-gal+ for a negative control mouse run in parallel.
Detection of β-gal+ cells in the blood of transgenic mice. FACS-gal analysis of viable peripheral blood leukocytes from (A) a (C57BL/6 × SJL) F1 negative control mouse (broken line) and a Rosa26 positive control (solid line) and (B) a HS21/5 vav-βgal transgenic mouse. Cells were analyzed for β-gal activity (represented on the X-axis by mean fluorescence units). The proportion of expressing cells was determined after setting the window to yield less than 5% β-gal+ for a negative control mouse run in parallel.
vav-βgal activity was highest in the thymus.
To determine which hematopoietic organs expressed the transgenes, we performed FACS-gal analysis on cell suspensions from tissues of mice. With each of the three active vav-βgal constructs, the expression pattern and intensity of fluorescence were similar, irrespective of transgene copy number. The thymus displayed by far the highest proportion of expressing cells (Table 2). The majority of thymocytes, and in occasional mice nearly the entire population, was β-gal+. Thus, all three transgenes were very active in immature T lymphocytes. In contrast only approximately one third of all leukocytes in lymph node and roughly 20% of those in bone marrow and spleen were positive, as in the peripheral blood. Although the construct containing a single intron site (HS21/5) yielded a significantly lower proportion of β-gal+ cells in thymus and lymph node than those having two intron sites (P < .05), no significant differences between the three constructs appeared in the bone marrow or spleen.
Expression in bone marrow was most prominent in early B-lineage cells.
The proportion of β-gal+ cells within particular hematopoietic lineages was determined by concomitant flow cytometric analysis for lineage-specific surface markers and β-gal expression (Table 2), as shown for bone marrow in Fig 8. In this site of B lymphopoiesis, a substantial portion of the B-lymphoid (B220+) cells displayed enzymic activity. Hence, the transgenes were active in the B as well as the T lineage. In sharp contrast, few if any cells bearing Mac-1, Gr-1, or TER-119 were β-gal+, indicating that the transgenes were silent in the monocytic, granulocytic, and erythroid lineages. That conclusion was reinforced by staining sorted Mac-1+, Gr-1+, or TER-119+ cells for β-gal activity: none contained a β-gal+ subpopulation.
Flow cytometric analysis of β-gal expression intransgenic bone marrow populations. The lineage of β-gal+ cells was determined by simultaneous analysis for the indicated lineage-specific surface markers (see the Materials and Methods): (A) Mac1, a myeloid cell marker; (B) the erythroid marker Ter119; (C) B220, a B-lymphoid marker; and (D) IgM and (E) IgD, markers of mature B lymphocytes. Less than 1% of lineage marker-positive cells in the negative control bone marrow were β-gal+.
Flow cytometric analysis of β-gal expression intransgenic bone marrow populations. The lineage of β-gal+ cells was determined by simultaneous analysis for the indicated lineage-specific surface markers (see the Materials and Methods): (A) Mac1, a myeloid cell marker; (B) the erythroid marker Ter119; (C) B220, a B-lymphoid marker; and (D) IgM and (E) IgD, markers of mature B lymphocytes. Less than 1% of lineage marker-positive cells in the negative control bone marrow were β-gal+.
Unexpectedly, we found that the frequency of transgene-expressing cells declined with B-cell maturation. In B-cell ontogeny, expression of B220 precedes surface IgM, whereas IgD is acquired only later in the spleen; hence, the marrow cells bearing IgD represent older recirculating B cells. Whereas approximately one half to two thirds of all B220+ cells in the bone marrow expressed the transgene, the proportion among those also bearing IgM was lower (approximately one-third, albeit higher in HS21/5 vav-βgal mice), and few if any IgD+ bone marrow were β-gal+ (Fig 8 and Table 2). Thus, the activity of the transgene was mosaic (variegated) within this lineage, and the frequency of positive cells fell with maturation to background levels in the recirculating B-cell population.
Expression in peripheral hematopoietic tissues was restricted to T cells.
In accordance with the bone marrow results, very few, if any β-gal+ B lymphocytes could be found in the spleen or lymph nodes (Table 2), indicating that few expressing B cells leave the bone marrow. However, activity in the T-cell lineage was retained in the periphery (Table 2). Interestingly, in spleen and lymph node, a significant proportion of both the CD4+ helper T-cell population and the CD8+ cytotoxic T cells showed expression, although the proportion of β-gal+ cells in each subset was somewhat lower than that in total thymocytes. Hence, expression also declines during T-cell maturation, albeit much less rapidly than in the B lineage. The variegated expression pattern in the mature T cells clearly was not related to differentiation into the two functional subsets but seemed instead to reflect random silencing in both the CD4+ and CD8+ populations.
Only a minor population of fetal liver cells express vav-βgal.
The endogenous vav gene has been shown by in situ hybridization to be expressed strongly between E12.5 and E17.5 in fetal liver, the major site of fetal erythropoiesis.2 10 To determine whether vav-βgal was also expressed at this stage, livers from HS21/5 fetuses at E14.5 were subjected to FACS-gal analysis (data not shown). The vast majority of the cells were β-gal−, confirming that the transgene was silent in the erythroid lineage. However, approximately 1% of total fetal liver cells were positive. Because these cells did not bear the Ter119, B220, Thy1, Mac1, or Gr1 markers, they may represent very early B-lymphoid precursors.
Expression in peripheral blood leukocytes decreased as animals aged.
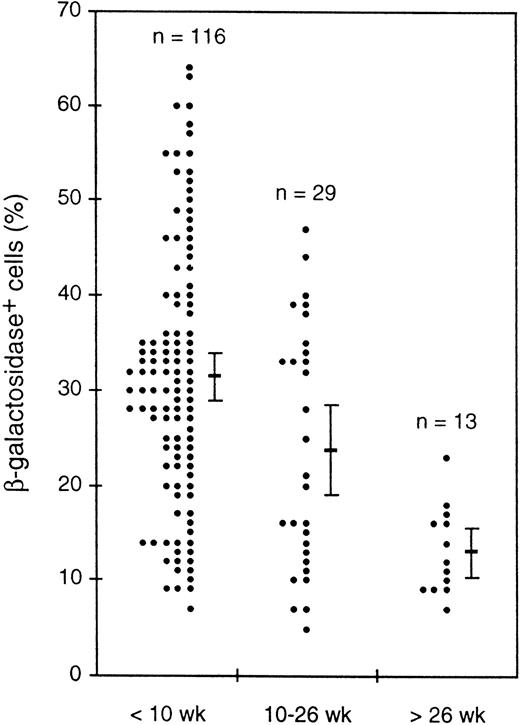
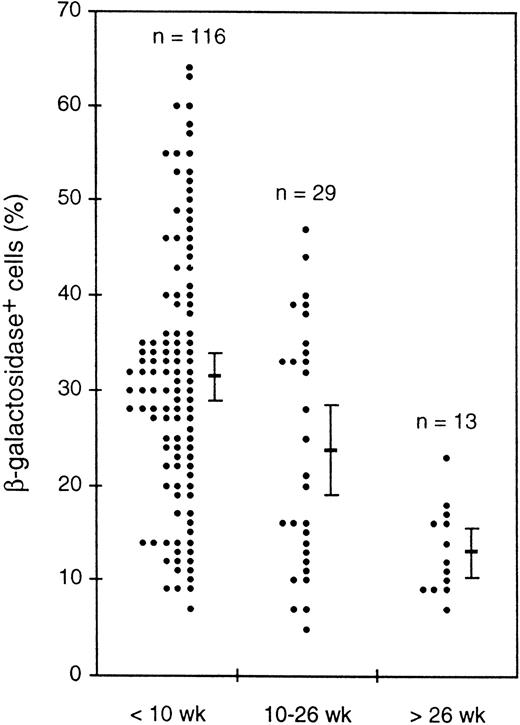
While investigating transgene expression in peripheral blood, we noticed a decrease in the proportion of β-gal+ cells in older animals. Figure 9 shows for one transgenic line the percentages of β-gal+ cells for mice of three age groups. Despite the considerable scatter in the individual values, the average values clearly decreased and t-tests indicated that the differences between all three groups were statistically significant, with that between the youngest and oldest groups being highly significant (P < .000005). Another line showed a similar decrease, and a third line showed a less marked decline. Thus, the transgenes in three independent lines appeared to be silenced in a stochastic fashion as the mice aged.
Decline with mouse age in the average percentage of β-gal+ cells in peripheral blood leukocytes. Values for individual mice of a single HS21/5 transgenic line in three age groups are shown, as well as the mean and 2 SEM above and below the mean.
Decline with mouse age in the average percentage of β-gal+ cells in peripheral blood leukocytes. Values for individual mice of a single HS21/5 transgenic line in three age groups are shown, as well as the mean and 2 SEM above and below the mean.
DISCUSSION
The findings reported here lay the groundwork for clarifying how the unique compartment-wide expression of the vav gene is achieved. A screen of 60 kb of chromatin encompassing the murine gene, which was found to comprise at least 14 exons, showed five major DNase I HS sites, all lying in its 5′ moiety (Fig 1). HS1 seems to correspond to the proximal promoter, whereas HS2 and HS3 lie further upstream and HS4 and HS5 reside in the first intron. These sites were found in hematopoietic cells of three distinct lineages (myeloid, erythroid, and lymphoid), but none was present in fibroblasts. Thus, these five sites, which are spread over 14 kb of the vav locus, are likely to represent the major regulatory sites for control ofvav gene expression.
Activity of the vav promoter requires integration into chromatin.
In good agreement with similar studies in human cell lines,30 RNase protection experiments showed a cluster of apparent vav transcription start sites, located approximately 100 bp 5′ of the initiating AUG (Fig 3A). Because both the mouse and human promoter lack a TATA box, heterogeneous starts are expected. The presence of the same pattern of presumptive start sites in mRNA from murine cell lines representative of several hematopoietic cell types makes it very likely that a single promoter is operative in the various lineages.
High resolution mapping of HS1 resolved it into HS1a, a strong site within 0.15 kb of the transcription start site and the weaker HS1b, around 0.5 kb upstream. Potential binding sites for transcription factors expressed in hematopoietic cells were evident within the 1-kb sequenced promoter region, but as the sequence of few of these sites is conserved in the known corresponding human (0.4 kb) sequence,30 their relevance is problematic. Thus, novel transcription factors may be required to drive vav expression, and the localization of the HS1a and HS1b sites should aid in their identification.
The activity of vav reporter constructs differed markedly between stably and transiently transfected cell lines. In stably transfected FDC-P1 cells (Fig 4), vav promoter fragments spanning HS1 plus HS2, or even HS1 alone, were nearly as active as SRα, among the strongest of promoters for hematopoietic cells.22 In contrast, transient transfection of these constructs yielded no β-gal activity, and even with the more sensitive luciferase reporter the promoter activity in hematopoietic cells was minimal (Table 1). A major difference is that stable transfection entails integration into chromatin, whereas transiently transfected DNA remains episomal. Thus, the vav HS sites may function only within the context of chromatin. Although few studies have made this direct comparison, a clear precedent is provided by the CD34 promoter, which was active only when stably introduced into cell lines.33 It may be relevant that CD34 is expressed in primitive hematopoietic cells of multiple lineages. Hence, the vav and CD34 promoters may be representative of a novel type of promoter that functions only when integrated into chromatin.
Elements required for expression in vivo.
As has frequently been observed, the requirements for expression in vivo proved much more stringent than in transfected cell lines. Whereas the promoter region alone (HS1) sufficed for high activity in the FDC-P1 myeloid cell line (Fig 4), expression in the blood leukocytes of transgenic mice also required HS2 (ie, 2.3 kb of upstream DNA) as well as the 3.7-kb intron fragment spanning HS5. When intron site HS4 was included as well, more than 70% of primary transgenic animals had β-gal+ cells in their blood (Fig 5). Thus, establishing a domain of transcriptional competence in vivo appears to require HS1, HS2, and HS5, whereas HS4 seems to have a facultative role. Curiously, the distal upstream site HS3 appeared to have a predominantly negative influence, because its presence in transgenic constructs reduced expression in FDC-P1 cells (Fig 4) as well as the frequency of transgenic lines that yielded expression (Fig 5).
No evidence was found associating particular HS sites with expression in one or other hematopoietic lineage. The same pattern of sites was evident in different lineages and the addition of HS4, or HS4 plus HS3, to the minimal active transgenic construct, HS21/5 vav-βgal, did not produce expression in the nonlymphoid lineages (Table 2). Thus, the five HS sites may act together as a unit to establish or maintain transcriptional competence rather than as separate enhancers for the different hematopoietic lineages.
It remains a puzzle that vav-βgal constructs stably introduced into a myeloid cell line were highly expressed (Fig 4) but inert within myeloid cells in vivo (Table 2). It seems relevant that the transfected cell lines were isolated by coexpression of a selectable marker (a neomycin gene driven by an SV40 promoter). Because constructs cointroduced into a cell line commonly integrate into the same locus, the selection for G418 resistance may have imposed selection for active chromatin domains. Hence, the vav-βgalconstructs may be less effective at opening chromatin in myeloid cells, even though they are very active in those cells within the appropriate chromatin environment.
Variegated expression of vav-βgal transgenes.
Only a proportion of lymphocytes of a given type were β-gal+. The variegated expression pattern held for multiple independent vav-βgal transgenic strains bearing up to all five HS sites (Table 2). Selection against β-gal activity cannot account for this phenomenon, because this enzymic activity is ubiquitous even in older Rosa26 mice. In both lymphoid lineages the frequency of β-gal+ cells declined with maturation. The B-lineage decline was dramatic, with very few β-gal+ B cells persisting outside the bone marrow, their tissue of origin. Because the decline in the T lineage was comparable for the CD4+ and CD8+ subsets, it was unrelated to mature T-cell function.
The proportion of β-gal+ leukocytes also decreased with age of the mice (Fig 9). Because all peripheral expressing cells seemed to be T cells, the decrease in the blood probably represented an extension of the decrease in frequency observed between thymic and peripheral T cells (Table 2). Because the activity in the residual expressing cells did not decrease notably, the decline appeared to reflect stochastic shut off in a proportion of the cells. All of thevav-βgal transgenes seemed subject to this random silencing. For a given transgenic line, the founder and progeny of different generations yielded similar results, suggesting that the silencing was recapitulated in each generation.
In many past transgenic studies, low transgene expression has been assumed to reflect a low level in each cell rather than absence of expression in the vast majority, but as reviewed recently18,34 several studies with reporters allowing cell-by-cell analysis have shown variegated expression. Examples include variegation in erythrocytes with well-studied globin regulatory elements35-38 and in lymphocytes with the CD2 LCR.39 These observations and our findings favor the view that the cluster of positive regulatory elements associated with a gene acts in an all-or-none fashion to determine whether a given cell activates transcription of the gene.17 The maturation- and age-related decrease in expression observed here and in certain other recent studies38 40 also emphasizes that the long-term maintenance of transcriptional competence is likely to require elements in addition to those needed to establish a competent state.
In principle, variegated expression of a transgene might be related to the position of insertion, the copy number, an incomplete set of regulatory elements, or the presence of sequences not from the endogenous locus, such as the reporter.
Position of insertion undoubtedly strongly affects transgene expression, and variegated transgene expression is often likened to position effect variegation in Drosophila,18 where an active gene shifted near heterochromatin is stochastically and clonally inactivated. Insertion into heterochromatin appeared to promote variegation with CD2 and β-globin transgenes.36 39 However, that mechanism is unlikely to account for the variegation we observed, because it occurred in all 18 independent expressing transgenic founders and lines.
Variegation with Drosophila transgenes has been ascribed to heterochromatinization promoted by the transgene array itself, with higher copy numbers increasing the rate of silencing.41Whereas some high-copy mouse transgenes show reduced expression,18,41 extensive arrays are unlikely to account for our observations, because all the expressing founder mice we examined had low copy numbers (<4 per haploid genome) and all showed a comparable extent of variegation. The copy number was also not a major factor in the variegation observed with an α-globin promoter.38
Compromising effects of the β-gal reporter.
The widespread use of β-gal (lacZ) transgenes to monitor promoter action in vivo, particularly in the embryo, has included successful studies with several hematopoietic lineages, including megakaryocytes,42 erythrocytes,43 and myeloid cells.44,45 Nevertheless, it is of note that many reports of poor or variegated expression involve β-galtransgenes.17,20,37,40 Indeed, β-gal has failed as a reporter with a number of regulatory elements that work well with other reporters.20,46 Even with the potent β-globin LCR micro-locus and the entire β-globin gene, aβ-gal reporter compromised position-independent expression and provoked variegation.37
In view of these concerns, we have recently engineered vavpromoter constructs with a eukaryotic reporter. Preliminary results indicate that these transgenes are expressed at readily detectable levels in most founder mice, often in most of the blood cells, including those of nonlymphoid lineages. Hence, in accord with the results in the FDC-P1 cells (Fig 4), the vav regions defined here are sufficient to drive expression in the myeloid as well as lymphoid lineages and may comprise all of its critical control elements. Detailed analysis of such mice should allow us to determine whether they are sufficient to establish and maintain pan-hematopoietic expression.
(B) Nucleotide sequence of the murinevav promoter. Arrows denote major sites of transcription initiation, as determined by RNase protection in (A). Consensus binding site sequences for transcription factors are indicated, as are the regions corresponding to HS1a (−150 bp to +1 bp) and HS1b (−620 bp to −450 bp).
ACKNOWLEDGMENT
The authors are grateful to Drs Frank Battye and Andreas Strasser for advice on flow cytometry and to Dr Strasser for antibodies, to Dr William Kerr for Rosa26 mice, to Drs Peter Cockerill and Selina Raguz for help with HS analysis, to Jodie De Winter and Kim Patane for animal husbandry, to Margaret Santamaria for technical assistance, and to Jeanette Tyers for preparation of the manuscript.
Supported by the National Health and Medical Research Council (Canberra) and the US National Cancer Institute (CA12421).
Gen Bank accession number AF031651 Bank It 148623.
Address reprint requests to Jerry M. Adams, PhD, The Walter and Eliza Hall Institute of Medical Research, Post Office, Royal Melbourne Hospital, Victoria 3050, Australia.
The publication costs of this article were defrayed in part by page charge payment. This article must therefore be hereby marked “advertisement” in accordance with 18 U.S.C. section 1734 solely to indicate this fact.



![Fig. 2. DNAse I hypersensitive site mapping of the vavgenomic locus in hematopoietic cells and fibroblasts. (A) Diagrams of the probes, digests, and observed fragment sizes (in kilobases) that delineated the five major HS sites in (B) through (D). Exons are shown as solid boxes. Nuclei from FDC-P1 cells and NIH3T3 fibroblasts (B and C) or C88 murine erythroleukemia (MEL) cells (D) were digested with increasing amounts of DNase I followed by Southern analysis of extracted DNA, using the indicated restriction enzyme/probe combinations. The sizes of the germline fragments (G) and the DNase I cleavage products at each HS site are indicated in kilobases. The additional germline band of approximately 4.5 kb in NIH3T3 cells (B) reflects a polymorphic Bgl II site approximately 1 kb 5′ of the first vav exon. In (C), the 4.7-kb band (G 4.7) reflects detection of the 4.7-kb germline Xba fragment (see [A]) by exon I sequences in cDNA probe b. On prolonged exposure, bands corresponding to HS2,1 and 4 were also seen. In (E), fine mapping of the proximal vav promoter demonstrates that HS1 comprises two sites approximately 400 bp apart. The positions of the stronger HS1a and weaker HS1b sites and probes c and d are indicated on the diagram. Abbreviations: X, Xba I; S, Sac I; Hp,Hpa I; Bg, Bgl II.](https://ash.silverchair-cdn.com/ash/content_public/journal/blood/91/2/10.1182_blood.v91.2.419/3/m_blod4021702.jpeg?Expires=1763572321&Signature=TFJaNutulsWQmWidTPNW3GJAaMxWDtwRyZBNyzFAeUjQ2HL5OZzrNPh4VEoY3C4tTgrSkClJLnRMDdw0O85Dyitp51zGC35WW1-LpJva3v~BlcQcHYijc854kdBChm1ldNVpZqJIBcW~TxCVHN5nCQtFiPNA2uFI6~RcMfZaIWCfW9rh2QQPmlFXH2EPQ9t0zUWNbGbcVBTEtw-DN9qS0s4gjrD22rVtXSAkhoX-7KtyKXFuvGYjnuk2K5uDMPXTh0fXp~Gy4ueVR8BJRUWLF5EedfNks0Ylwu7irRaXrTEd3DhPIw6Zkewuq-ZMHUAvr0JX5YCqUZLnrZY8go-Piw__&Key-Pair-Id=APKAIE5G5CRDK6RD3PGA)





![Fig. 2. DNAse I hypersensitive site mapping of the vavgenomic locus in hematopoietic cells and fibroblasts. (A) Diagrams of the probes, digests, and observed fragment sizes (in kilobases) that delineated the five major HS sites in (B) through (D). Exons are shown as solid boxes. Nuclei from FDC-P1 cells and NIH3T3 fibroblasts (B and C) or C88 murine erythroleukemia (MEL) cells (D) were digested with increasing amounts of DNase I followed by Southern analysis of extracted DNA, using the indicated restriction enzyme/probe combinations. The sizes of the germline fragments (G) and the DNase I cleavage products at each HS site are indicated in kilobases. The additional germline band of approximately 4.5 kb in NIH3T3 cells (B) reflects a polymorphic Bgl II site approximately 1 kb 5′ of the first vav exon. In (C), the 4.7-kb band (G 4.7) reflects detection of the 4.7-kb germline Xba fragment (see [A]) by exon I sequences in cDNA probe b. On prolonged exposure, bands corresponding to HS2,1 and 4 were also seen. In (E), fine mapping of the proximal vav promoter demonstrates that HS1 comprises two sites approximately 400 bp apart. The positions of the stronger HS1a and weaker HS1b sites and probes c and d are indicated on the diagram. Abbreviations: X, Xba I; S, Sac I; Hp,Hpa I; Bg, Bgl II.](https://ash.silverchair-cdn.com/ash/content_public/journal/blood/91/2/10.1182_blood.v91.2.419/3/m_blod4021702.jpeg?Expires=1763572322&Signature=P1sHB83SPmUuge7RGVs4IeLVF97PZ~13MJHaPOrczqCrbdaB0SvVHG-wHk8Cl2AoWMSBy4xZGSZTR2qIojvHMCpx93qx1yZY64mRNVgH5X91M7EqqaEzPNSodTiJBjtLwg2GUW524w4Z4TO3NoBk3KogMleRfm07SE0fiRYm-JV79sML6YOUvwH6RF1jDNroMkOgq7D00hBpHeYsMaQ2y0fLRzNeIYzp1wnbtZIQgiJgfCOtvAZ3BhFdHBRKY3N-~lsU2nzeHs9EtcVK4gSBEtlfkANh~DtwM1fvBtF1bCUSvL2i23o~foW0biPyp4X~XHHFPR2XnxUnc01PywyRpQ__&Key-Pair-Id=APKAIE5G5CRDK6RD3PGA)
