Key Points
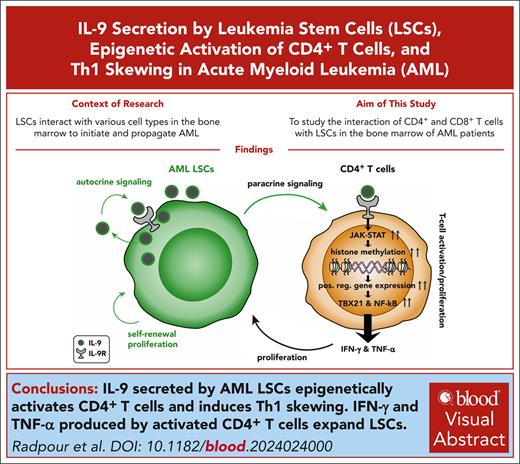
IL-9 secreted by AML LSCs epigenetically activates CD4+ T cells and induces Th1 skewing.
IFN-γ and TNF-α produced by activated CD4+ T cells expand LSCs.
Visual Abstract
In acute myeloid leukemia (AML), leukemia stem cells (LSCs) and leukemia progenitor cells (LPCs) interact with various cell types in the bone marrow (BM) microenvironment, regulating their expansion and differentiation. To study the interaction of CD4+ and CD8+ T cells in the BM with LSCs and LPCs, we analyzed their transcriptome and predicted cell-cell interactions by unbiased high-throughput correlation network analysis. We found that CD4+ T cells in the BM of patients with AML were activated and skewed toward T-helper (Th)1 polarization, whereas interleukin-9 (IL-9)–producing (Th9) CD4+ T cells were absent. In contrast to normal hematopoietic stem cells, LSCs produced IL-9, and the correlation modeling predicted IL9 in LSCs as a main hub gene that activates CD4+ T cells in AML. Functional validation revealed that IL-9 receptor signaling in CD4+ T cells leads to activation of the JAK-STAT pathway that induces the upregulation of KMT2A and KMT2C genes, resulting in methylation on histone H3 at lysine 4 to promote genome accessibility and transcriptional activation. This induced Th1-skewing, proliferation, and effector cytokine secretion, including interferon gamma (IFN-γ) and tumor necrosis factor α (TNF-α). IFN-γ and, to a lesser extent, TNF-α produced by activated CD4+ T cells induced the expansion of LSCs. In accordance with our findings, high IL9 expression in LSCs and high IL9R, TNF, and IFNG expression in BM–infiltrating CD4+ T cells correlated with worse overall survival in AML. Thus, IL-9 secreted by AML LSCs shapes a Th1-skewed immune environment that promotes their expansion by secreting IFN-γ and TNF-α.
Introduction
Acute myeloid leukemia (AML) is a clonal disease of hematopoietic stem cells (HSCs) and progenitor cells that is characterized by a maturation arrest, expansion, and abnormal proliferation of undifferentiated progenitor cells and myeloid blasts.1,2 According to the molecular and cytogenetic profile, AML is grouped into adverse-, intermediate-, and favorable-risk categories.3,4
Leukemia stem cells (LSCs) have the capacity for self-renewal and are responsible for disease initiation, propagation, and resistance to chemotherapy.5-10 Similar to HSCs, LSCs interact with stromal, endothelial, and immune cells in the bone marrow (BM) microenvironment that form the niche. Niche cells regulate HSC and LSC homing, quiescence, self-renewal, and differentiation.11
The BM acts as a primary and a secondary lymphoid organ. Thus, lymphocytes are an important part of the BM environment.12 In contrast to peripheral blood, the percentage of CD8+ T cells in the BM is slightly higher than that of CD4+ T cells.13,14 Regulatory T cells (Tregs) in the BM preserve normal hematopoiesis and provide an immune-privileged niche for HSCs.15-17 Sixty percent of CD8+ and CD4+ T cells are naïve, whereas the remainders are memory T cells.18 In addition, CD4+ T cells with T-helper (Th)2 polarization produce many cytokines with important functions in hematopoiesis, such as interleukin-3 (IL-3), IL4, IL-6, and granulocyte-macrophage colony–stimulating factor (GM-CSF).19,20 CD4+ and CD8+ T cells have an important role in hematopoiesis after BM transplantation.21 T-cell–deficient mice have a block in the differentiation of myeloid cells that is restored after transfer of CD4+, but not CD8+, T cells.22 During immune activation, such as an infection, autoimmunity, or cancer, the differentiation and cytokine production of immune cells may change, leading to the expansion of Th1 cells that produce interferon gamma (IFN-γ) and tumor necrosis factor α (TNF-α).19
Activated CD8+ T cells and natural killer (NK) cells have the potential to eliminate AML blasts.23,24 However, LSCs efficiently avoid elimination by the immune system through colocalization with Tregs, the expression of immune-inhibitory molecules, or downregulation of immunological recognition pathways.25,26 In contrast to direct cytotoxic effects, activated T cells produce cytokines such as IL-3, IL-6, IFN-γ, and TNF-α that induce the expansion of LSCs.27-33
To study the interaction of AML LSCs and leukemia progenitor cells (LPCs) with BM–infiltrating CD4+ and CD8+ T cells, we performed a comprehensive transcriptomic profiling and unbiased high-throughput correlation network analysis. We recently reported that activated CD8+ T cells induce the expansion of LSCs by stimulating the production of cytokines, particularly in favorable-risk AML.33 In this study, we analyzed the interaction of CD4+ T cells with LSCs/LPCs and CD8+ T cells. Transcriptomic analysis of CD4+ T cells in AML revealed an activation of immune-related signaling pathways with skewing toward Th1 polarization and lack of the Th9 immunophenotype. The correlation network analysis identified IL9 as a crucial hub gene in AML LSCs, regulating the differentiation, activation, and proliferation of BM–infiltrating CD4+ T cells. Functional studies validated that IL-9 secreted by AML LSCs epigenetically activates CD4+ T cells via JAK/STAT pathway and histone methylation. This induced the expression of the transcription factor T-bet (TBX21), leading to Th1 differentiation and secretion of IFN-γ and TNF-α. These cytokines expanded LSCs in vitro and were associated with worse overall survival in patients with AML. Thus, LSCs shape their surrounding immune microenvironment by producing IL-9. Increased Th1 cytokines, particularly IFN-γ, cause LSC proliferation and expansion.
Materials and methods
Patients and study cohorts
BM aspirates and blood samples from patients with AML were collected at the Department of Medical Oncology, University Hospital Bern and University of Texas MD Anderson Cancer Center. The cantonal ethical committee and the institutional review board at MD Anderson approved the study protocol (KEK 122/14 and 2019-01627). Study participation required a written informed consent. AML risk classification was conducted according to the guidelines of European LeukemiaNet in 20123,34 and updated guidelines in 2022.4 AML risk categories and immune-phenotype of the AML samples are shown in supplemental Table 1, available on the Blood website. The research followed the Declaration of Helsinki.
A detailed description of materials and methods is in the supplemental Data.
Results
BM–infiltrating CD4+ T cells are skewed toward Th1 polarization
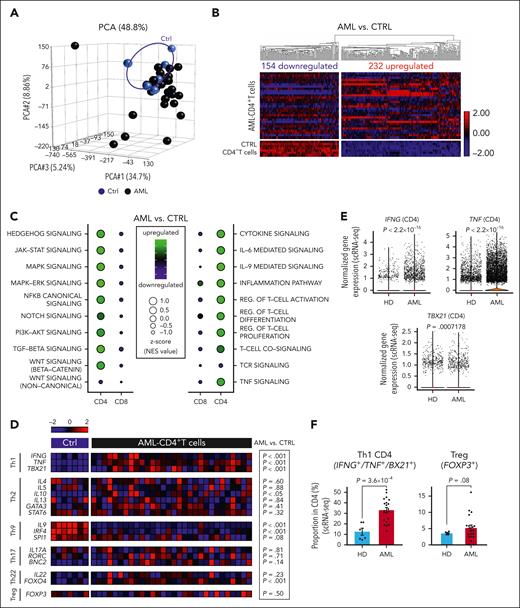
We characterized the transcriptome of fluorescence-activated cell sorting (FACS)–purified CD4+ and CD8+ T cells, LSCs, and LPCs in the BM of patients with AML at the time point of diagnosis.33 HSCs, hematopoietic progenitor cells (HPCs), and CD4+ and CD8+ BM T cells from healthy individuals served as controls (supplemental Figure 1A; supplemental Table 1). The gene expression of CD4+ T cells from patients with AML differed from that of healthy controls and was more heterogeneous (Figure 1A). In total, 386 genes were differentially expressed in BM–infiltrating CD4+ T cells from patients with AML compared with healthy donors (HDs; Figure 1B; supplemental Data Set 1). Gene ontology (GO) analysis revealed that the 154 downregulated genes regulated target of rapamycin (TOR) signaling, antigen presentation via major histocompatibility complex I (MHC-I), or IL-9 production (supplemental Figure 1B). The 232 upregulated genes were related to T-cell activation, differentiation, IFN-γ and TNF-α production, regulation of JAK-STAT signaling and kinase activity, positive regulation of gene expression, and cytokine/chemokine signaling (supplemental Figure 1C). This indicated an activated and inflammatory CD4+ T-cell compartment in the BM of patients with AML. Pathway enrichment analysis revealed that important cellular pathways such as HEDGEHOG, JAK-STAT, MAPK-extracellular signal-regulated kinase (ERK), canonical NF-κB, transforming growth factor-β (TGF-β), and canonical WNT (β-catenin) pathways were activated in CD4+ T cells from patients with AML (Figure 1C). These pathways are involved in the differentiation and activation of T cells.35 Additionally, the gene signatures for cytokine signaling (including IL-6– and IL-9–mediated signaling), inflammation pathway, TNF signaling, T-cell receptor signaling, and regulation of T-cell activation/proliferation/differentiation were significantly upregulated in AML CD4+ T cells (Figure 1C). In contrast, most intracellular signaling pathways and immune-related gene signatures were downregulated in AML–derived CD8+ T cells, consistent with the previously described silenced transcriptomic profile in CD8+ T cells from patients with AML.33
The transcriptomic analysis of BM–infiltrating CD4+ T cells in AML indicates T-cell activation and Th1 polarization. (A) PCA based on the transcriptomic profile of BM–infiltrating CD4+ T cells from patients with AML (n = 30) and controls (n = 7). (B) Heat map illustrating differentially expressed genes in CD4+ T cells (AML vs Ctrl). (C) Balloon plots illustrating significantly upregulated/downregulated pathways (left panel) or crucial immune-related signaling (right panel) within CD4+ and CD8+ T cells based on GSEA and normalized enrichment scores (NES). (D) Heat map illustrating the expression profile of key genes and transcription factors regulating CD4+ T-cell polarization (Th1, Th2, Th9, Th17, Th22, and Tregs). (E) Gene expression analysis of IFNG, TNF, and TBX21 in BM–infiltrating CD4+ T cell from patients with AML (n = 20) and HDs (n = 9) assessed by scRNA-seq. (F) Frequency of Th1 CD4+ T cells (IFNG, TNF, or TBX21 expressing CD4+ T cells) and Tregs (FOXP3 expressing CD4+ T cells) from patients with AML (n = 20) and HDs (n = 6) analyzed by scRNA-seq. (E-F) Two-sided Wilcoxon test. CTRL, control; PCA, principal component analysis; pos., positive.
The transcriptomic analysis of BM–infiltrating CD4+ T cells in AML indicates T-cell activation and Th1 polarization. (A) PCA based on the transcriptomic profile of BM–infiltrating CD4+ T cells from patients with AML (n = 30) and controls (n = 7). (B) Heat map illustrating differentially expressed genes in CD4+ T cells (AML vs Ctrl). (C) Balloon plots illustrating significantly upregulated/downregulated pathways (left panel) or crucial immune-related signaling (right panel) within CD4+ and CD8+ T cells based on GSEA and normalized enrichment scores (NES). (D) Heat map illustrating the expression profile of key genes and transcription factors regulating CD4+ T-cell polarization (Th1, Th2, Th9, Th17, Th22, and Tregs). (E) Gene expression analysis of IFNG, TNF, and TBX21 in BM–infiltrating CD4+ T cell from patients with AML (n = 20) and HDs (n = 9) assessed by scRNA-seq. (F) Frequency of Th1 CD4+ T cells (IFNG, TNF, or TBX21 expressing CD4+ T cells) and Tregs (FOXP3 expressing CD4+ T cells) from patients with AML (n = 20) and HDs (n = 6) analyzed by scRNA-seq. (E-F) Two-sided Wilcoxon test. CTRL, control; PCA, principal component analysis; pos., positive.
According to their cytokine profile and the expression of specific transcription factors, CD4+ T cells can be grouped in different subsets.36 BM–derived AML CD4+ T cells showed skewing toward a Th1 immune-phenotype and absence of Th9–polarized CD4+ T cells in all risk categories (Figure 1D). Single-cell RNA sequencing (scRNA-seq) analysis of an independent cohort of patients with AML revealed a significantly higher expression of the genes encoding for the Th1 transcription factor, TBX21, and for the Th1 cytokines, IFNG and TNF, in CD4+ T cells from patients with AML (Figure 1E). The scRNA-seq analysis revealed that the frequency of Th1-polarized CD4+ T cells increased approximately threefold compared with that of HDs. In contrast, the frequency of CD4+ Treg cells in AML increased only marginally. This results in a substantially higher Th1:Treg ratio, with ∼35% Th1-polarized CD4+ T cells and 5% CD4+ Treg cells in AML BM (Figure 1F). These data indicate that BM–infiltrating CD4+ T cell in AML are activated and preferentially differentiated to a proinflammatory Th1 phenotype.
Correlation network analysis identifies hub genes in LSCs that regulate target genes in BM–infiltrating CD4+ T cells
To study possible interactions of CD4+ T cells with paired AML LSCs, LPCs, and CD8+ T cells in the BM, we conducted an unbiased comprehensive correlation network analysis. Within all mapped networks, a node was defined as a gene expressed in any of the studied cell populations, and a hub gene correlated significantly with >15 different genes in the other cell type (supplemental Figure 2A). Three categories of correlation networks were mapped: (1) “appear,” a correlation was present in AML and was absent in controls; (2) “disappear,” a correlation was detected in controls and not in AML; and (3) “flip,” in which the sign of the correlation changed.
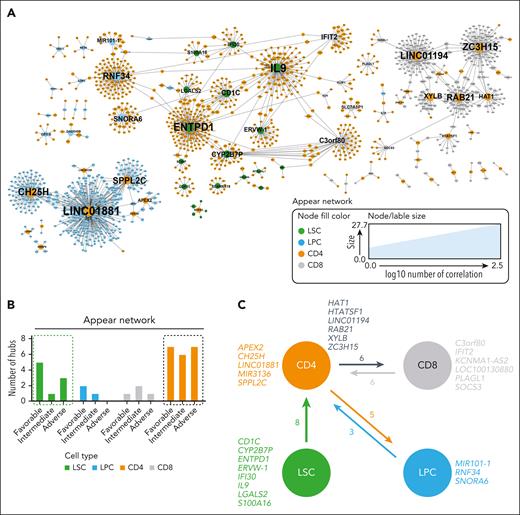
Most hub genes and nodes were detected in the appear networks (Figure 2A). Because we recently described that AML LSCs with adverse-risk constellation are less dependent on the interaction with CD8+ T cells than LSCs from favorable- or intermediate-risk patients, we analyzed the correlation network for CD4+ T cells in different prognostic groups (supplemental Data Set 2). Independent of AML risk groups, the highest number of hub genes was detected in the appear network in CD4+ T cells and LSCs (Figure 2B; supplemental Figure 2B). All hub genes identified in LSCs correlated with target genes in CD4+ T cells but not vice versa (supplemental Data Set 2).
Detection of hub genes in different cell populations. (A) Visualization of nodes (genes) in the AML appear network that have >2 connections. Node fill color indicates the cell population; node and label size indicate the node degree (number of correlations). Hub genes are annotated with their gene name. (B) Number of hub genes in LSCs, LPCs, CD8+, and CD4+ T cells for the appear network across AML risk groups. (C) Summary of significantly correlated hub genes in the different studied cell populations (LSCs, LPCs, CD8+, and CD4+ T cells).
Detection of hub genes in different cell populations. (A) Visualization of nodes (genes) in the AML appear network that have >2 connections. Node fill color indicates the cell population; node and label size indicate the node degree (number of correlations). Hub genes are annotated with their gene name. (B) Number of hub genes in LSCs, LPCs, CD8+, and CD4+ T cells for the appear network across AML risk groups. (C) Summary of significantly correlated hub genes in the different studied cell populations (LSCs, LPCs, CD8+, and CD4+ T cells).
These observations indicate that the detected hub genes in LSCs were involved in the regulation/activation of lymphocytes. IL9 is an important growth factor for different immune cells including T cells; IFI30 is involved in antigen-processing and CD1C in antigen presentation.37,38 In contrast, the correlation networks in CD4+ T cells with LPCs or CD8+ T cells suggested a bidirectional communication because hubs occur in both cell populations, and the number of correlating genes was more balanced (Figure 2C). Overall, the network analysis suggests that LSCs regulate CD4+ T cells that interact with LPCs and CD8+ T cells.
IL-9 expands LSCs in an autocrine loop
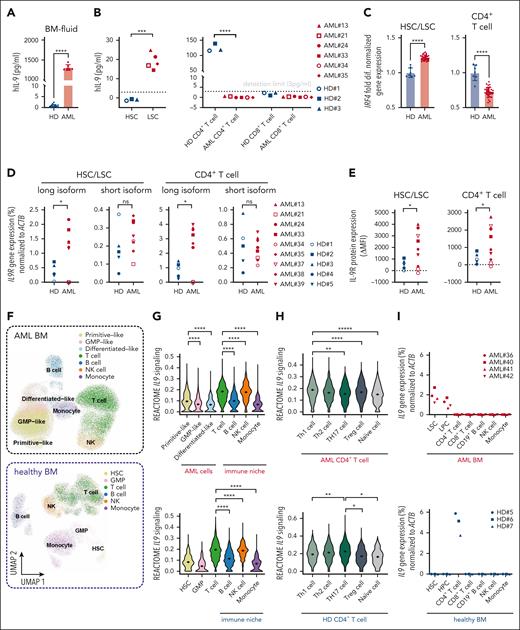
To study the role of IL-9 produced by LSCs, we quantified the IL-9 concentrations in the BM fluid of patients with AML and HDs. IL-9 levels were very low in healthy controls but significantly increased in patients with AML (Figure 3A). IL-9 protein was only detected in the supernatant of FACS-purified LSCs but not of CD4+ or CD8+ T cells from patients with AML after 48-hour in vitro culture (Figure 3B). This is consistent with the absence of IL9 messenger RNA (mRNA)–expressing CD4+ T cells in AML (Th9 cells; Figure 1D). In healthy individuals, CD4+ T cells secreted IL-9, whereas normal HSCs did not (Figure 3B). In patients with AML, the IL9 gene was expressed similarly in French-American-British (FAB) and in molecular subtypes (supplemental Figure 3A-B). Interferon regulatory factor 4 (IRF4) expression, the main transcriptional regulator of the IL9 gene, was significantly higher in AML LSCs than in healthy HSCs. In contrast, AML CD4+ T cells expressed significantly less IRF4 than CD4+ T cells from healthy controls (Figure 3C). IRF4 was similarly expressed in different AML subtypes according to FAB classification (supplemental Figure 3A).
The IL-9 receptor (IL-9R) gene and protein expression was significantly increased in AML LSCs and CD4+ T cells (Figure 3D-E; supplemental Figure 3C). Two IL9R protein–coding splice variants have been identified (supplemental Figure 3D). Only the gene expression of the long isoform was increased in AML and correlated with IL-9R protein expression (supplemental Figure 3E). AML cells in the BM can be hierarchically classified as primitive-, granulocyte-macrophage progenitor–, or differentiated-like cells, whereas cells in the immune-niche include T, B, NK cells, and monocytes (Figure 3F).39 The scRNA-seq analysis of BM cells from an independent cohort of patients with AML revealed that primitive-like AML cells, representing LSCs, had the highest expression levels of IL9 signaling genes compared with more differentiated AML cells (Figure 3G). In BM-infiltrating immune cells of patients with AML and healthy individuals, T cells showed the highest expression of IL9 signaling genes, followed by NK cells (Figure 3G). Within AML CD4+ T cells, IL9 signaling was most active in Th1/Th2 differentiated subtypes, whereas in healthy CD4+ T cells, it was primarily active in Th2/Th17 skewed T cells (Figure 3H). Further analysis of IL9 gene expression in FACS-purified cell populations confirmed that it is predominantly expressed in LSCs/LPCs in AML BM and CD4+ T cells in HD BM (Figure 3I).
As previously reported, IL-9 stimulated the proliferating capacity of AML LSCs.40 Preincubation with anti-IL-9–neutralizing antibody (αIL-9) reduced the colony forming capacity of LSCs but not HSCs (Figure 3J-K). In contrast, the capacity of LSCs to form colonies in secondary plantings in the absence of αIL-9 was not impaired. This indicates that blocking IL-9/IL-9R signaling before plating AML LSCs in methylcellulose did reduce the number of stem cells but not their function to form colonies in secondary platings. Because AML LSCs produce IL-9 endogenously, additional short/long-term treatment with recombinant human IL-9 (rhIL-9) did not increase their colony forming capacity (supplemental Figure 3F-G). These results indicated that IL-9 secreted by LSCs induced their expansion in an autocrine loop.
IL-9 expression in AML LSCs correlates with the expression of histone-lysine methyltransferase genes in CD4+ T cells
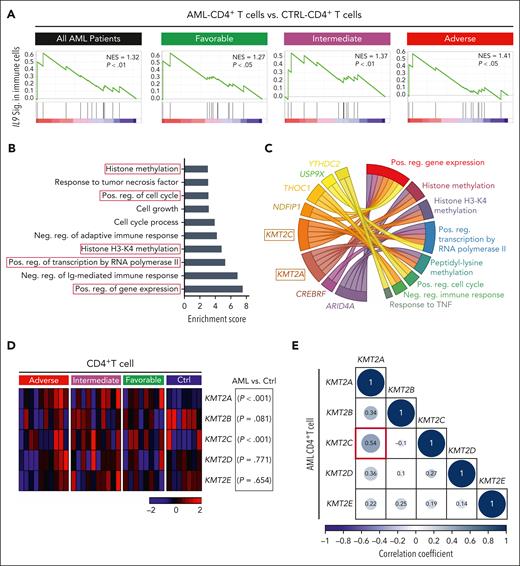
IL9 was identified as a potential hub gene in LSCs of patients with AML, regulating BM–infiltrating CD4+ T cells (Figure 2C). Additionally, gene set enrichment analysis (GSEA) revealed that IL-9R signaling is similarly active in CD4+ T cells from patients with AML across all molecular risk groups (Figure 4A). These data suggest that paracrine IL-9/IL-9R signaling may regulate CD4+ T-cell function independently of the molecular risk groups.
IL-9 secreted by AML LSCs upregulates histone lysine methyltransferase genes in BM–infiltrating CD4+ T cells. (A) GSEA of the IL9 signaling signature in AML CD4+ vs CTRL CD4+ T cells within the entire cohort of AML samples (n = 30) or in each respective risk group. (B) GO analysis of the IL-9 regulated 88-target genes in CD4+ T cells. GO enrichment score of ≥3 indicates significant changes. (C) Circus plot illustrating the top 8-genes involved in several of the dysregulated pathways in the GO analysis (4B) (D) Heat map illustrating the expression of important family members of histone-lysine N-methyltransferase 2 (KMT2) complex in CD4+ T cell in the different AML risk groups. (E) Correlation matrix of lysine methyltransferase complex genes in AML CD4+ T cell. Statistics: Pearson correlation. CTRL, control; neg, negative; pos, positive.
IL-9 secreted by AML LSCs upregulates histone lysine methyltransferase genes in BM–infiltrating CD4+ T cells. (A) GSEA of the IL9 signaling signature in AML CD4+ vs CTRL CD4+ T cells within the entire cohort of AML samples (n = 30) or in each respective risk group. (B) GO analysis of the IL-9 regulated 88-target genes in CD4+ T cells. GO enrichment score of ≥3 indicates significant changes. (C) Circus plot illustrating the top 8-genes involved in several of the dysregulated pathways in the GO analysis (4B) (D) Heat map illustrating the expression of important family members of histone-lysine N-methyltransferase 2 (KMT2) complex in CD4+ T cell in the different AML risk groups. (E) Correlation matrix of lysine methyltransferase complex genes in AML CD4+ T cell. Statistics: Pearson correlation. CTRL, control; neg, negative; pos, positive.
The correlation network modeling identified 88 target genes in CD4+ T cells that correlated with IL9 expression in LSCs (supplemental Table 4). These 88 target genes positively regulate gene expression, histone methylation (specifically histone H3 lysine-4 [H3-K4] methylation [H3K4me]), cell cycle and cell growth, and response to TNF and negatively regulate adaptive immune responses (Figure 4B). Eight of these 88 genes were part of ≥2 GO-predicted biological pathways (Figure 4C).
Two members of KMT2 complex, KMT2A/C, were associated with 5 identified biological pathways, including positive regulation of gene expression and histone methylation. Because the KMT2 complex has core family members (KMT2A-E),41 we examined their gene expression in CD4+ T cells from different AML risk groups. KMT2A and C, but not KMT2B, D, or E genes were expressed at significantly higher levels in CD4+ T cells of patients with AML (Figure 4D; supplemental Data Set 1). We observed a significant positive correlation between KMT2A and KMT2C gene expression in AML CD4+ T cells but not for other KMT2 complex genes (Figure 4E). These data suggest that IL-9 secreted by LSCs activates CD4+ T cells by regulating KMT2A/C.
IL-9 secreted by AML LSCs activates BM–infiltrating CD4+ T cells
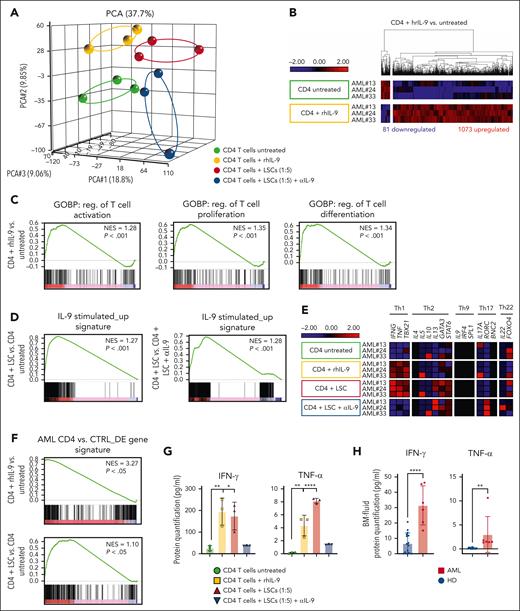
To investigate the role of IL-9 signaling on BM–infiltrating CD4+ T cells in patients with AML, we stimulated FACS–purified CD4+ T cells with rhIL-9 or cocultured them with paired LSCs and performed RNA-seq transcriptomic analysis. CD4+ T cells stimulated with rhIL-9 or cocultured with paired LSCs had distinct gene expression patterns from untreated or cocultured CD4+ T cells with paired LSCs and IL-9 neutralization antibody (αIL-9) (Figure 5A). IL9R but not IL9 was highly expressed in purified CD4+ T cells from patients with AML (supplemental Figure 4A). Both rhIL-9 and LSC coculture activated IL9 signaling in CD4+ T cells (supplemental Figure 4B). After stimulation with rhIL-9, 1073 genes were upregulated, and 81 genes were downregulated (Figure 5B; supplemental Data Set 3). GSEA indicated a positive enrichment of T-cell activation, proliferation, and differentiation in rhIL-9–stimulated CD4+ T cells from patients with AML (Figure 5C).
IL-9 secreted by LSCs activates BM–infiltrating CD4+ T cells and induces Th1 skewing. (A) PCA based on the transcriptomic profile of CD4+ T cells upon stimulation with rhIL-9 or untreated CD4+ T cells as controls as well as CD4+ T cells cocultured with paired AML LSCs and CD4+ T cell cocultured with AML LSCs together with αIL-9 (n = 3 biological replicates per condition). (B) Heat map of differentially expressed genes in CD4+ T cells + rhIL-9 vs untreated CD4+ T cells. (C) GSEA of T-cell activation, proliferation and differentiation-related gene signatures in CD4+ T cells + rhIL-9 vs untreated CD4+ T cells. (D) GSEA of the IL-9 stimulated_up signature (1073 genes, Figure 5C) in CD4+ T cells coincubated with LSCs vs untreated or CD4+ T cells coculture with LSCs in the presence of αIL-9. (E) Heat map illustrating the expression profile of key genes for CD4+ Th-cell polarization. (F) GSEA of AML CD4 vs CTRL_DE gene signature (386 genes, Figure 1B) in CD4+ T cells treated with rhIL-9 or coincubated with LSCs vs untreated CD4+ T cells. (G) Protein quantification of IFN-γ and TNF-α in supernatants of FACS–purified AML CD4+ T cells in the presence or absence of rhIL-9 and cocultured with LSCs in the presence or absence of αIL-9 (n = 3 patients with AML). (H) Protein quantification of IFN-γ and TNF-α in BM fluid of patients with AML (n = 5) and HDs (n = 12). Statistics: 2-tailed unpaired t test. ∗P < .05; ∗∗P < .01; ∗∗∗∗P < .0001.
IL-9 secreted by LSCs activates BM–infiltrating CD4+ T cells and induces Th1 skewing. (A) PCA based on the transcriptomic profile of CD4+ T cells upon stimulation with rhIL-9 or untreated CD4+ T cells as controls as well as CD4+ T cells cocultured with paired AML LSCs and CD4+ T cell cocultured with AML LSCs together with αIL-9 (n = 3 biological replicates per condition). (B) Heat map of differentially expressed genes in CD4+ T cells + rhIL-9 vs untreated CD4+ T cells. (C) GSEA of T-cell activation, proliferation and differentiation-related gene signatures in CD4+ T cells + rhIL-9 vs untreated CD4+ T cells. (D) GSEA of the IL-9 stimulated_up signature (1073 genes, Figure 5C) in CD4+ T cells coincubated with LSCs vs untreated or CD4+ T cells coculture with LSCs in the presence of αIL-9. (E) Heat map illustrating the expression profile of key genes for CD4+ Th-cell polarization. (F) GSEA of AML CD4 vs CTRL_DE gene signature (386 genes, Figure 1B) in CD4+ T cells treated with rhIL-9 or coincubated with LSCs vs untreated CD4+ T cells. (G) Protein quantification of IFN-γ and TNF-α in supernatants of FACS–purified AML CD4+ T cells in the presence or absence of rhIL-9 and cocultured with LSCs in the presence or absence of αIL-9 (n = 3 patients with AML). (H) Protein quantification of IFN-γ and TNF-α in BM fluid of patients with AML (n = 5) and HDs (n = 12). Statistics: 2-tailed unpaired t test. ∗P < .05; ∗∗P < .01; ∗∗∗∗P < .0001.
To analyze whether coculture of CD4+ T cells with paired LSCs induced IL-9/IL-9R signaling, we defined an IL-9–stimulated_up signature, including the identified 1073 genes upregulated upon rhIL-9 stimulation (Figure 5B). GSEA of CD4+ T cells cocultured with paired LSCs revealed a significant enrichment for this IL-9 stimulated_up gene signature compared with both untreated or CD4+ T cells cocultured with LSCs in the presence of αIL-9, indicating that LSCs regulate CD4+ T cells through IL-9/IL-9R signaling (Figure 5D). The expression profile of key cytokine/transcription factor genes for Th polarization in IL-9–stimulated CD4+ T cells or cocultured with AML LSCs, indicated a skewing toward Th1 immune-phenotype (Figure 5E). To determine whether the observed changes in gene expression reflect the situation in patients with AML, we created a signature of the 386 differentially expressed (DE) genes in CD4+ T cells in patients with AML vs healthy controls, as shown in Figure 1B. This signature was then assessed in CD4+ T cells treated with rhIL-9 or cocultured with LSCs, in comparison with untreated CD4+ T cells. Our analysis revealed a significant positive enrichment of these DE genes, implying that activating CD4+ T cells with IL-9 or coculture with LSCs may induce a transcriptomic phenotype similar to that initially observed in AML CD4+ T cells (Figure 5F). Incubation with rhIL-9 and coculture with LSCs resulted in a significant upregulation of KMT2A/C/E, JAK1/2, STAT1/3/5B, TNF, IFNG, and the Th1-transcription factor (TBX21) (supplemental Figure 4C; supplemental Data Set 3). GO analysis of upregulated intersection genes revealed a positive regulation of transcription, histone methylation, JAK-STAT, and cytokine signaling (eg, IFN-γ, TNF-α, IL-1, and IL-6 production; supplemental Figure 4D).
Next, we quantified 12 key cytokines in the culture supernatant of CD4+ T cells upon stimulation with rhIL-9 or cocultured with paired LSCs in vitro. CD4+ T cells stimulated with rhIL-9 or coculture with LSCs produced more IFN-γ and TNF-α (Figure 5G; supplemental Figure 4E). In addition, the concentration of IFN-γ and TNF-α was significantly higher in the BM fluid of patients with AML than that of HDs (Figure 5H).
Taken together, IL-9 secretion by LSCs activates BM–infiltrating CD4+ T cells and induces a Th1 skewing with the production of IFN-γ and TNF-α.
AML LSC-secreted IL-9 activated CD4+ T cells through JAK-STAT signaling and histone H3 methylation
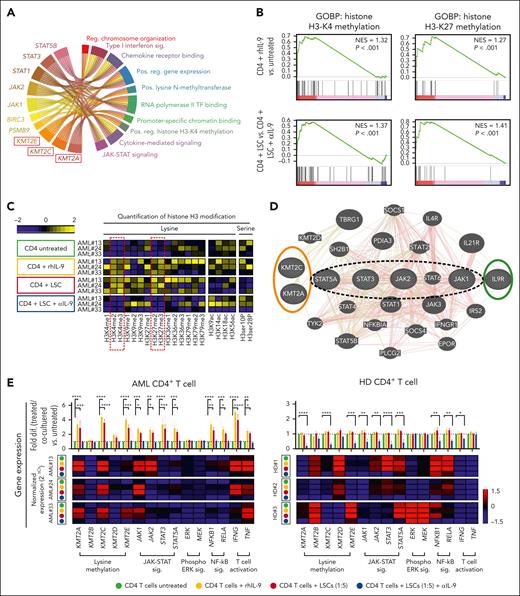
IL-9 stimulation and coculture with LSCs induced signaling pathways in CD4+ T cells that are associated with positive regulation of gene expression, histone methylation, and JAK-STAT signaling (supplemental Figure 4D). We identified the top 10 genes involved in >4 of these pathways. KMT2A/C/E genes were significantly upregulated in CD4+ T cells and associated with positive regulation of gene expression, histone methylation, as well as transcription factor– and promoter-specific chromatin binding (Figure 6A). GSEA comparing the transcriptome of CD4+ T cells incubated with or without IL-9 revealed a significant positive enrichment for the gene expression patterns regulating H3-K4 and H3-K27 methylations (Figure 6B). A similar enrichment pattern was identified in CD4+ T cells coincubated with LSCs in the presence or absence of αIL-9 mouse antibody (mAb) (Figure 6B). IL-9–induced dimethylation and trimethylation H3-K4 signatures (supplemental Figure 5A). To validate these findings, we quantified 21 diverse histone H3 modifications in purified histones from AML CD4+ T cells after in vitro IL-9 stimulation or LSC coculture. In both conditions, the levels of dimethylation and trimethylation on H3-K4 and H3-K27 significantly increased, with H3K4me showing particularly pronounced enhancement (Figure 6C; supplemental Table 4).
IL-9R signaling is mainly mediated through the JAK/STAT pathway.42 In accordance, an in silico pathway analysis predicted that IL-9/IL-9R signaling triggers the expression of KMT2A/C mainly through JAK-STAT signaling (Figure 6D). GSEA revealed a significant positive enrichment of JAK-STAT and NF-κB signaling in IL-9 stimulated or LSC cocultured CD4+ T cells (supplemental Figure 5B-C).
To confirm the transcriptomic finding, we individually analyzed the gene expression profile of 5 members of the KMT2 complex and key genes of JAK-STAT, phospho ERK, canonical NF-κB signaling pathways, as well as TBX21, IFNG, and TNF in CD4+ T cell from patients with AML or HDs upon IL-9 stimulation or cocultured with LSCs. Stimulation with IL-9 or coculture with AML LSCs significantly increased the expression of KMT2A/C/E, JAK-STAT, canonical NF-κB signaling, TBX21, IFNG, and TNF in CD4+ T cells (Figure 6E). Similarly, cell culture supernatant from AML LSCs or LPCs induced the expression of those genes in AML CD4+ T cells, indicating that a soluble factor is mediating the observed effect (supplemental Figure 5D). Given that healthy CD4+ T cells produce IL-9 at high concentrations (Figure 3B), neither treatment with rhIL-9 nor coculture with AML LSCs increased the expression of crucial target genes (Figure 6E). In contrast, αIL-9 treatment reduced the expression of those target genes. Thus, IL-9 produced by LSCs does not regulate gene expression in healthy CD4+ T cells, because these cells already produce high amounts of IL-9.
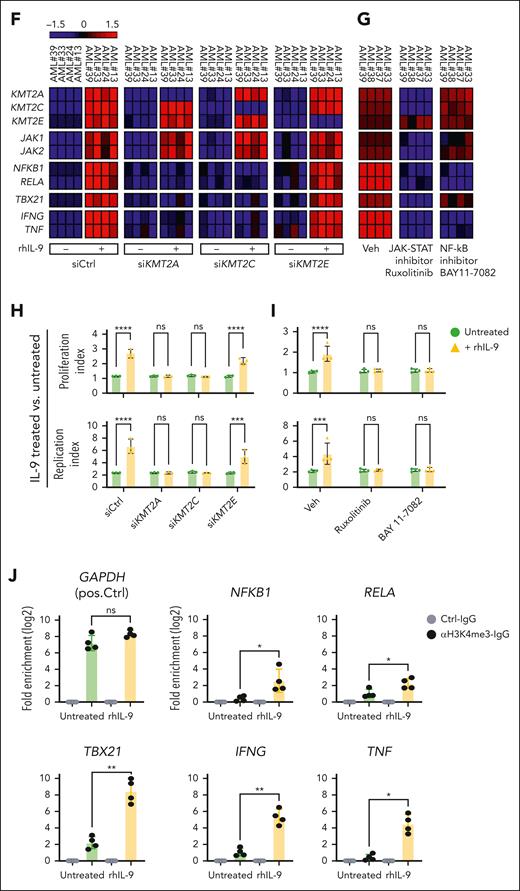
We functionally validated the predicted effect of IL-9 signaling on the JAK-STAT pathway and histone methylation on CD4+ T-cell activation and proliferation. Incubation of CD4+ T cells from primary AML with rhIL-9 increased the expression of KMT2A/C/E, genes of the JAK-STAT and the canonical NF-κB signaling pathways, as well as TBX21, IFNG, and TNF. Treatment with siKMT2A and siKMT2C but not siKMT2E prevented the increase in NF-κB–related genes, TBX21, IFNG, and TNF (Figure 6F). Treatment with the JAK1/JAK2 inhibitor, ruxolitinib, reduced the expression of KMT2A/C but not KMT2E, as well as the NF-κB–related genes, TNX21, IFNG, and TNF (Figure 6G). In contrast, treatment with the NF-κB inhibitor, BAY 11-7082, only prevented the IL-9–induced upregulation of IFNG and TNF without affecting the JAK-STAT pathway or the expression of TBX21 or KMT2 complex genes (Figure 6G). Furthermore, rhIL9 induced the proliferation and replication of CD4+ T cells from patients with AML (Figure 6H-I). KMT2A/C knockdown and treatment with ruxolitinib or BAY 11-7082 reduced the IL-9–induced proliferation of CD4+ T cells.
To confirm the possibility of histone H3 lysine methylation at the promoter region of TNF, IFNG, and TBX21 genes, we examined the chromatin immunoprecipitation sequencing (ChIP-seq) histone methylation data of CD4+ T cells in the Roadmap Epigenomics Mapping database. H3K4me3 peaks were detected at the promoter region of TNF, IFNG, and TBX21 genes (supplemental Figure 6A-C). This suggests that histone H3 lysine methylation (especially at H3K4me3) may regulate the gene expression of TNF, IFNG, and TBX21 in CD4+ T cells. To functionally validate the impact of H3K4me3 on promoter accessibility and the increased expression of target genes, we assessed H3K4me3 occupancy at the promoter regions of NF-κB targets (NFKB1 and RELA), TBX21, IFNG, and TNF genes in CD4+ T cells from patients with AML in the presence or absence of rhIL-9, using chromatin immunoprecipitation–quantitative real-time polymerase chain reaction (ChIP-qRT-PCR). H3K4me3 occupancy at these promoter regions was observed exclusively in IL-9–stimulated CD4+ T cells, whereas it was absent in untreated cells (Figure 6J).
In summary, IL-9/IL-9R signaling activates JAK-STAT signaling, leading to the upregulation of KMT2A/C in CD4+ T cells. This, results in H3-K4 methylation, which activates CD4+ T cells through TBX21 and NF-κB signaling, promoting cell proliferation and cytokine production.
TNF-α and IFN-γ secreted by activated CD4+ T cells expand LSCs and correlate with disease progression
To investigate the functional role of TNF-α and IFN-γ produced by AML CD4+ T cells on LSCs, we cultured primary AML LSCs with recombinant human (rh)TNF-α or rhIFN-γ and performed a colony forming and replating assay. Treatment with rhTNF-α or rhIFN-γ significantly increased colony formation in the first plating. LSCs stimulated with rhTNF-α did not show a significant increase in colony formation in the secondary platings, whereas the number of rhIFN-γ–stimulated colonies even increased (Figure 7A). This indicates TNF-α and IFN-γ expanded LSCs that retained the capacity of self-renewal in replatings. Our findings were confirmed by culturing primary LSCs with the supernatant of IL-9–activated CD4+ T cells with or without αTNF-α or αIFN-γ neutralization antibodies. The addition of CD4+ T-cell supernatant increased colony forming capability by threefold, and the expanded LSCs maintained their capacity to from colonies in secondary replatings. Treatment with αIFN-γ antibody reduced the colony numbers to levels of nontreated LSCs. In contrast, the addition of αTNF-α antibody did not significantly reduce the colony forming capacity (Figure 7B). The results indicate that although both effector cytokines have the potential to expand LSCs in vitro, CD4+ T cells mainly expand LSCs by secreting IFN-γ. This may be due to the fact that the level of TNF-α produced by CD4+ T cells in cocultures with LSCs is rather low (Figure 5G).
IL-9/IL-9R signaling as well as TNF-α and IFN-γ expression in CD4+ T cells correlate with worse prognosis in patients with AML. (A) Colony forming assays with primary LSCs treated overnight in the presence or absence of rhTNF-α (100 pg/mL) or rhIFN-γ (100 pg/mL), before plating in methylcellulose in the primary plating. Secondary plating was without addition of rhTNF-α or rhIFN-γ (n = 6 patients with AML; each value indicates the average of 3 replicates of 1 individual patient sample). (B) Colony forming assays performed with primary LSCs treated overnight with or without supernatant of IL-9 activated AML CD4+ T cells in the presence or absence of neutralizing αTNF-α (1 μg/mL) or αIFN-γ antibodies (1 μg/mL), before plating in methylcellulose in the primary plating. No further treatment was added for secondary platings (n = 3 patients with AML; each value is average of 3 replicates of 1 individual patient sample). The results were normalized to the colony numbers of LSCs that have been treated with Veh (A) or left untreated (B; dotted line). (C) Kaplan-Meier plots of overall survival (OS) for pooled patients with AML from 3-independent AML cohorts (HOVON-SAKK data set, E-MTAB-3444; NL-Valk data set, GSE6891; Metzeler data set, GSE12417), according to the IL9 and IL9R gene expression (n = 1339 patients with AML). The cutoff for high or low gene expression was assessed by the X-Tile program. (D) Kaplan-Meier plots of OS according to the IL9 gene expression in LSCs or IL9R gene expressions in FACS-purified BM–infiltrating CD4+ T cells from patients with AML (n = 28 LSCs and n = 30 CD4+ T cells). (E) GSEA of 16 LSC-signature genes (IL9 high vs IL9 low in purified LSCs, as determined by the X-Tile program cutoff [D]). (F) Heat map of 16 LSC-signature genes. (G) Correlation between TNF and IFNG in CD4+ T cells and the geometric mean of 16 LSC-signature genes in purified LSCs. (H) Kaplan-Meier plots of OS according to the TNF and IFNG gene expressions in FACS-purified BM–infiltrating CD4+ T cells from patients with AML (n = 30). Statistics: 2-way ANOVA with multiple comparisons and Dunnett post hoc test (A-B) and log-rank test (C-D,H), Pearson correlation (G). ∗P < .05; ∗∗P < .01; ∗∗∗P < .001; ∗∗∗∗P < .0001. ns, not significant.
IL-9/IL-9R signaling as well as TNF-α and IFN-γ expression in CD4+ T cells correlate with worse prognosis in patients with AML. (A) Colony forming assays with primary LSCs treated overnight in the presence or absence of rhTNF-α (100 pg/mL) or rhIFN-γ (100 pg/mL), before plating in methylcellulose in the primary plating. Secondary plating was without addition of rhTNF-α or rhIFN-γ (n = 6 patients with AML; each value indicates the average of 3 replicates of 1 individual patient sample). (B) Colony forming assays performed with primary LSCs treated overnight with or without supernatant of IL-9 activated AML CD4+ T cells in the presence or absence of neutralizing αTNF-α (1 μg/mL) or αIFN-γ antibodies (1 μg/mL), before plating in methylcellulose in the primary plating. No further treatment was added for secondary platings (n = 3 patients with AML; each value is average of 3 replicates of 1 individual patient sample). The results were normalized to the colony numbers of LSCs that have been treated with Veh (A) or left untreated (B; dotted line). (C) Kaplan-Meier plots of overall survival (OS) for pooled patients with AML from 3-independent AML cohorts (HOVON-SAKK data set, E-MTAB-3444; NL-Valk data set, GSE6891; Metzeler data set, GSE12417), according to the IL9 and IL9R gene expression (n = 1339 patients with AML). The cutoff for high or low gene expression was assessed by the X-Tile program. (D) Kaplan-Meier plots of OS according to the IL9 gene expression in LSCs or IL9R gene expressions in FACS-purified BM–infiltrating CD4+ T cells from patients with AML (n = 28 LSCs and n = 30 CD4+ T cells). (E) GSEA of 16 LSC-signature genes (IL9 high vs IL9 low in purified LSCs, as determined by the X-Tile program cutoff [D]). (F) Heat map of 16 LSC-signature genes. (G) Correlation between TNF and IFNG in CD4+ T cells and the geometric mean of 16 LSC-signature genes in purified LSCs. (H) Kaplan-Meier plots of OS according to the TNF and IFNG gene expressions in FACS-purified BM–infiltrating CD4+ T cells from patients with AML (n = 30). Statistics: 2-way ANOVA with multiple comparisons and Dunnett post hoc test (A-B) and log-rank test (C-D,H), Pearson correlation (G). ∗P < .05; ∗∗P < .01; ∗∗∗P < .001; ∗∗∗∗P < .0001. ns, not significant.
To investigate the prognostic value of IL-9/IL-9R signaling on overall survival, we used 3 independent data sets containing gene expression values of nonfractionated BM cells from patients with AML (HOVON-SAKK data set: E-MTAB-344443; NL-Valk data set: GSE689144,45; and Metzeler data set: GSE1241746). Patients with AML with lower expression of IL9 or IL9R had a significantly better overall survival in all 3 data sets (Figure 7C; supplemental Figure 7). Although the prognostic value of IL9 and IL9R in total BM cells in these large data sets is consistent with our hypothesis, it does not allow for concluding on the role of IL-9/IL-9R signaling in CD4+T cells. Thus, we examined the prognostic value of IL9 and IL9R in purified AML LSCs and CD4+ T cells (Figure 7D). The expression of IL9 in LSCs and IL9R in CD4+ T cells correlated with worse overall survival, although not significant due to the small sample size. In addition, LSCs of the IL9-high group patients had a significant higher expression of 16 LSC-signature genes than that of patients in the IL9-low group (Figure 7E-F). Although IFN-γ secreted by CD4+ T cells from patients with AML expands LSCs in vitro, we did not detect IFNG as a hub gene in CD4+ T cells in our network modeling (Figure 2). However, a positive correlation between TNF and IFNG expression in CD4+ T cells with 16 LSC-signature genes in purified AML LSC suggests that CD4+ T cells regulate LSCs through IFN-γ and TNF-α secretion (Figure 7G).
Since IL-9/IL-9R signaling in AML CD4+ T cells increases the secretion of IFN-γ and TNF-α, we investigated their correlation with prognosis. Higher TNF and IFNG expression in purified CD4+ T cells correlated significantly with worse outcome (Figure 7H). Taken together, LSC induce CD4+ T cells to secrete IFN-γ and TNF-α that induces their proliferation and expansion.
Discussion
The immune microenvironment plays a crucial role in leukemia development, progression, and control. For solid tumors, it is well documented that cancer cells shape their immune microenvironment. In contrast to solid tumors, LSCs develop and expand in the BM within a secondary lymphoid structure, in close proximity to naïve and memory lymphocytes.47 CD8+ and CD4+ T cells contribute to the immunosurveillance, recognize leukemia associated antigens and lyse leukemia cells.47 Nevertheless, CD8+ T cells are often dysfunctional in myeloid leukemia.33,48 Furthermore, many CD4+ T-cell subsets with distinct functions on leukemia cells have been described.49 CD4+ Tregs are important part of the HSC niche, and their frequency has been shown to increase in leukemia.50 They frequently cluster with CD8+ T cells in the BM. They have a main function in the immune escape of LSCs by inhibiting adaptive immune responses.50,51 Increased numbers of BM CD4+ Tregs in AML correlate with poor prognosis.17 Although the BM contains all cytokine-producing subsets (Th1, Th2, Th9, Th17, and Th22), their roles in AML development remain poorly understood. Our gene expression analysis of BM–infiltrating CD4+ T cells in AML identified a skewing toward the proinflammatory Th1 subset, whereas Th9 cells were notably absent. We also found an increase in Treg cells in AML, but the expansion of the Th1 subset was much more pronounced, resulting in a higher proportion of inflammatory Th1 cells than immunosuppressive Tregs.
IL-9 is an essential cytokine for CD4+ T-cell proliferation and function.52 IL-9 is produced by a variety of different cells including mast cells, NK cells, T cells, innate lymphoid cells (ILCs), and different Th subsets including specialized Th9 cells.53 In AML, IL9 gene expression was absent in CD4+ T cells. In contrast, IL-9 was produced by AML LSCs independent of molecular risk groups, genetic aberrations, or FAB classification. Due to the high number of LSPCs, IL-9 concentrations in the BM fluid of patients with AML were significantly elevated. IL-9 is an important growth factor not only for immune cells but also for malignant cells including AML. Thus, IL-9 promotes LSC expansion and proliferation in an autocrine loop.
Our correlation network analysis and the functional validation revealed that AML LSCs secrete IL-9 to regulate CD4+ T-cell skewing, proliferation, activation, and cytokine production. IL-9 activates and expands T-helper cells.54 Furthermore, IL-9 suppresses the immunological response to cancer cells by enhancing the function of Foxp3+ Tregs or the growth of myeloid-derived suppressor cells.55-57 Our study now indicates that IL-9/IL-9R signaling in AML induces T-bet expression, which differentiates and expands Th1 cells. In addition, IL9 signaling genes were also expressed in Th2 and NK cells in the BM of patients with AML. This suggests that different immune cells are dependent on the secretion of the growth factor IL-9 by LSCs.
We confirmed that IL-9R signaling activates the Jak-STAT pathway and increased STAT1/3/5B expression. STAT1 is critical for Th1 polarization, whereas STAT3 induces RAR-related orphan receptor gamma (RORγt) and Th17 differentiation. Given the lack of Th1 cytokines and the specific transcription factor, T-bet, in the BM of healthy individuals, it is likely that in AML naïve CD4+ T cells are activated and skewed toward a Th1 phenotype. Inhibiting JAK-STAT signaling blocked TBX21 expression, indicating that IL9/IL9R signaling affects Th1 skewing. In addition, IL-9 may also induce the proliferation of already differentiated Th subsets.
IL-9 expression in LSCs correlates with the expression of genes involved in histone methylation (KMT2A/C) in CD4+ T cells. Histone methylation regulates CD4+ T-cell growth, function, selection, and maturation.58-60 H3K4me increases gene expression, activation, and T-cell differentiation into effector cells.59 H3-K27 methylation induces the development of Tregs.61,62 We showed that IL-9/IL-9R signaling in CD4+ T cells of patients with AML increased histone methylation, particularly at H3K4, leading to CD4+ T-cell activation. It has been shown that histone methylation is regulated by JAK/STAT signaling during CD4+ T-cell activation.61 Accordingly, inhibiting JAK/STAT reduced KMT2A/C expression, but not KMT2E, as well as CD4+ T-cell activation and proliferation, TBX21, TNF, and IFNG expression. Moreover, silencing KMT2A/C, but not KMT2E, reduced CD4+ T-cell activation and proliferation, as well as TNF and IFNG expression. This indicates that IL-9 induces IFN-γ and TNF-α production in CD4+ T cells by regulating KMT2A/C histone methylation genes.
IFN-γ and TNF-α are key inflammatory cytokines secreted by activated CD4+ Th1 cells.57,63 These cytokines stimulate inflammation, recruit immune cells, and alter the tumor microenvironment in cancer.58 IFN-γ and TNF-α may boost the immune response to cancer cells.64,65 In addition, IFN-γ upregulates MHC-I and -II.66 For example, flotetuzumab and chimeric antigen receptor T cells–targeting surface antigens on AML cells upregulate MHC-II expression on AML cells by increasing IFN-γ secretion, leading to improved graft-versus-leukemia effects after transplantation.67 IFN-γ also induces immunosuppression by promoting the synthesis of indoleamine-2,3-dioxygenase and immune checkpoint inhibitory molecules.68,69 We found that CTL-secreted IFN-γ promotes disease progression by expanding LSCs.70 The effect of IFN-γ on LSCs might be dose dependent. Low doses of IFN-γ promote AML LSC self-renewal and disease progression, whereas high doses have anti-AML effects.71 We now documented that the IFN-γ secreted by IL-9–activated CD4+ T cells expand LSCs.
Elevated IL-9 levels in the blood have been associated with poor prognosis therapy outcomes in lymphoma and leukemia.72-74 We found that patients with lower IL9 or IL9R expression in nonfractionated BM cells had a significantly improved overall survival. In addition, IL9 expression in purified LSCs as well as IFNG and TNF expression in purified BM–infiltrating CD4+ T cells predicted poor overall survival in our patient cohort. Thus, IL-9 secreted by AML LSCs activates CD4+ T cells in the BM and skews them toward proinflammatory Th subsets, mainly Th1. Activated CD4+ T cells secrete IFN-γ and TNF-α, expand LSCs, and correlate with poor prognosis. The autocrine and paracrine effects of IL-9 secreted by LSCs may enable a novel therapeutic approach by blocking IL-9R signaling.
Acknowledgments
The authors thank the staff of the Flow Cytometry and Cell Sorting Facility (University Bern, Bern, Switzerland) and the Genomic Facility of the University of Basel and the Department of Biosystems Science and Engineering (Basel, Switzerland) for providing technical assistance.
This work was supported by grants from Krebsliga Schweiz and Swiss National Science Foundation (SNF 310030_192675 [A.F.O.]), as well as Stiftung für klinisch-experimentelle Tumorforschung and Bernische Krebsliga (R.R.). The work was partially supported by Leukemia Research Foundation and MD Anderson Cancer Center Institutional Start-up Funding (H.A.A).
Authorship
Contribution: R.R. designed and performed experiments, analyzed and interpreted data, and wrote the manuscript; C.S., B.W., and H.A.A. analyzed the data; C.R. designed experiments and analyzed the data; and A.F.O. designed experiments, wrote the manuscript, and supervised the project.
Conflict-of-interest disclosure: The authors declare no competing financial interests.
Correspondence: Adrian F. Ochsenbein, Department of Medical Oncology, Inselspital, Bern University Hospital, 3010 Bern, Switzerland; email: adrian.ochsenbein@insel.ch; and Ramin Radpour, Department of Medical Oncology, Inselspital, Inselspital, Bern University Hospital, 3010 Bern, Switzerland; email: ramin.radpour@unibe.ch.
References
Author notes
All transcriptomic data compiled for this study have been deposited in the National Center for Biotechnology Information (NCBI) Gene Expression Omnibus (GEO) database (accession codesGSE117090 and GSE249638). Public repository gene expression data were analyzed using the single-cell RNA sequencing acute myeloid leukemia (AML) data set (GSE239721), HOVON-SAKK AML data set (E-MTAB-3444), NL-Valk AML data set (GSE6891), and normal karyotype AML “Metzeler” data set (GSE12417).
The complete list of differentially expressed genes in CD4+ T cells from patients with AML vs healthy controls is shown in supplemental Data Set 1. The correlation analysis including the list of predicted hub genes and their correlations (edges) are listed in supplemental Data Set 2. The complete list of differentially expressed genes from in vitro stimulated CD4+ T cells is shown as supplemental Data Set 3.
The online version of this article contains a data supplement.
There is a Blood Commentary on this article in this issue.
The publication costs of this article were defrayed in part by page charge payment. Therefore, and solely to indicate this fact, this article is hereby marked “advertisement” in accordance with 18 USC section 1734.

![IL-9/IL-9R signaling as well as TNF-α and IFN-γ expression in CD4+ T cells correlate with worse prognosis in patients with AML. (A) Colony forming assays with primary LSCs treated overnight in the presence or absence of rhTNF-α (100 pg/mL) or rhIFN-γ (100 pg/mL), before plating in methylcellulose in the primary plating. Secondary plating was without addition of rhTNF-α or rhIFN-γ (n = 6 patients with AML; each value indicates the average of 3 replicates of 1 individual patient sample). (B) Colony forming assays performed with primary LSCs treated overnight with or without supernatant of IL-9 activated AML CD4+ T cells in the presence or absence of neutralizing αTNF-α (1 μg/mL) or αIFN-γ antibodies (1 μg/mL), before plating in methylcellulose in the primary plating. No further treatment was added for secondary platings (n = 3 patients with AML; each value is average of 3 replicates of 1 individual patient sample). The results were normalized to the colony numbers of LSCs that have been treated with Veh (A) or left untreated (B; dotted line). (C) Kaplan-Meier plots of overall survival (OS) for pooled patients with AML from 3-independent AML cohorts (HOVON-SAKK data set, E-MTAB-3444; NL-Valk data set, GSE6891; Metzeler data set, GSE12417), according to the IL9 and IL9R gene expression (n = 1339 patients with AML). The cutoff for high or low gene expression was assessed by the X-Tile program. (D) Kaplan-Meier plots of OS according to the IL9 gene expression in LSCs or IL9R gene expressions in FACS-purified BM–infiltrating CD4+ T cells from patients with AML (n = 28 LSCs and n = 30 CD4+ T cells). (E) GSEA of 16 LSC-signature genes (IL9 high vs IL9 low in purified LSCs, as determined by the X-Tile program cutoff [D]). (F) Heat map of 16 LSC-signature genes. (G) Correlation between TNF and IFNG in CD4+ T cells and the geometric mean of 16 LSC-signature genes in purified LSCs. (H) Kaplan-Meier plots of OS according to the TNF and IFNG gene expressions in FACS-purified BM–infiltrating CD4+ T cells from patients with AML (n = 30). Statistics: 2-way ANOVA with multiple comparisons and Dunnett post hoc test (A-B) and log-rank test (C-D,H), Pearson correlation (G). ∗P < .05; ∗∗P < .01; ∗∗∗P < .001; ∗∗∗∗P < .0001. ns, not significant.](https://ash.silverchair-cdn.com/ash/content_public/journal/blood/144/8/10.1182_blood.2024024000/1/m_blood_bld-2024-024000-gr7.jpeg?Expires=1764087266&Signature=ZC83~R718EWdOhFBiqz-4ZrSjuzr7u5poNLfKVw3SOV5BWL492YiUUYgs5Ycu-x8O6iTonLuxpVCwCv8aMDhpj~35y-TfgmpzE5jZOffxKiisBqBulgYfJW9GojTn5P3PhW5im-PJGJfPrJAQNkIGo34A8yrjh4ZifpmtTvq106IRw9snwwgkEGW7HxLPVxyUSNb2fHYULRuJ4AEEhB-FAPj4MC7~FXZVlfECqx~f662O802uSzrXhxbd0dYYIw12ChceMVBQ5ELOimn242bFQ1PlO~IcUpD0PtCDscb35mK3Nk0Sw1tMHeISMDaXFKSWHyDsSO~C8kGZ1xh6f26Wg__&Key-Pair-Id=APKAIE5G5CRDK6RD3PGA)
