Key Points
We unveiled 8 lncRNAs essential for multiple myeloma (MM) cell fitness and associated with poor prognosis and high expression in patients with MM.
We identified lncRNA RP11-350G8.5 as a therapeutic target for MM and characterized its oncogenic role and molecular and structural features.
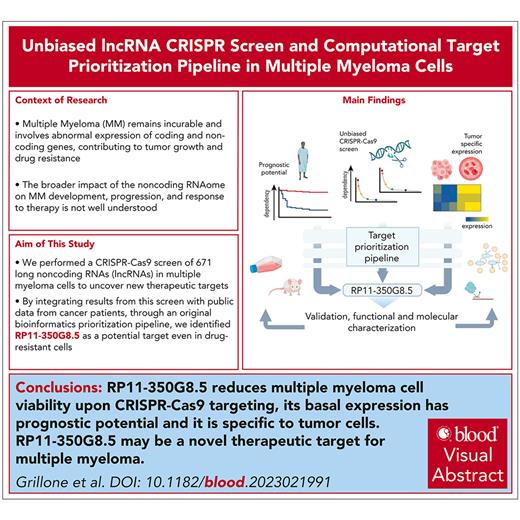
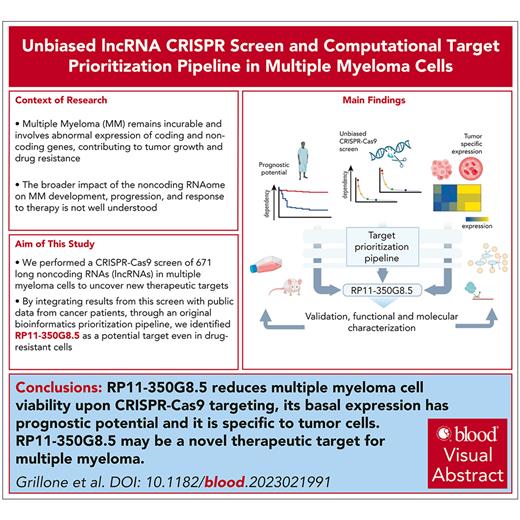
Visual Abstract
Multiple myeloma (MM) is an incurable malignancy characterized by altered expression of coding and noncoding genes promoting tumor growth and drug resistance. Although the crucial role of long noncoding RNAs (lncRNAs) in MM is clearly established, the function of the noncoding RNAome, which might allow the design of novel therapeutics, is largely unknown. We performed an unbiased CRISPR-Cas9 loss-of-function screen of 671 lncRNAs in MM cells and their bortezomib (BZB)–resistant derivative. To rank functionally and clinically relevant candidates, we designed and used a bioinformatic prioritization pipeline combining functional data from cellular screens with prognostic and transcriptional data from patients with MM. With this approach, we unveiled and prioritized 8 onco-lncRNAs essential for MM cell fitness, associated with high expression and poor prognosis in patients with MM. The previously uncharacterized RP11-350G8.5 emerged as the most promising target, irrespective of BZB resistance. We (1) demonstrated the anti-tumoral effect obtained by RP11-350G8.5 inhibition in vitro and in vivo; (2) highlighted a modulation of the unfolded protein response and the induction of immunogenic cell death triggered by the RP11-350G8.5 knockout, via RNA sequencing and molecular studies; (3) characterized its cytoplasmic homing through RNA fluorescence in situ hybridization; and (4) predicted its 2-dimensional structure and identified 2 G-quadruplex and 3 hairpin-forming regions by biophysical assays, including thioflavin T, 1H nuclear magnetic resonance, and circular dichroism, to pave the way to the development of novel targeted therapeutics. Overall, we provided innovative insights about unexplored lncRNAs in MM and identified RP11-350G8.5 as an oncogenic target for treatment-naïve and BZB-resistant patients with MM.
Introduction
Multiple myeloma (MM) is a hematological malignancy characterized by multistep transformations of plasma cells in the bone marrow and multiorgan end damage. The first-in-class proteasome inhibitor bortezomib (BZB) is the leading drug in clinical regimens; however, MM remains an incurable disease because of the emergence of drug resistance.1
The dissection of MM molecular landscape has highlighted aberrations of noncoding genes responsible for MM oncogenesis and drug responsiveness.2-4 Long noncoding RNAs (lncRNAs), including transcripts of >200 nucleotides, have recently emerged as cancer drivers5 and regulators of gene expression at genomic, transcriptional, and posttranscriptional levels.6,7 Therapeutic targeting of aberrant lncRNAs8-10 represents a challenging yet intriguing research avenue because of a potentially reduced toxicity compared with mRNA targeting and enhanced selectivity vs miRNA targeting.8 However, although the relevance of lncRNAs in MM is established, the functional role of most of the noncoding RNAome in this disease remains poorly understood.4
We investigated 671 lncRNAs in MM in vitro models through pooled CRISPR-Cas9 screens,11 which represents the last revolution in genome editing approaches for resolution and scale,12 allowing us to investigate cellular growth–dependency from different genes simultaneously13 and the identification of novel tumor-specific vulnerabilities.11,14-16
Combining screening results with prognostic and gene expression data from patients with MM, we identified novel lncRNA dependencies that could be relevant from a therapeutic target development point of view.
Materials and methods
Cell cultures and viral transduction
Cells were cultured following vendor's instructions. Details are in the supplemental Materials and methods (available on the Blood website). Monocyte-derived dendritic cells were generated as previously described.17 Amplification of lentiviral plasmids (supplemental Table 1), virus production, and transduction are detailed in the supplemental Materials and methods.
CRISPR screen and bioinformatic analyses
Cas9 activity was assessed as previously described15 (supplemental Figure 1; supplemental Table 1). The human paired-guide RNA (pgRNA) library pool (supplemental Figure 2) (Addgene number 89640)11 was used to perform the CRISPR-Cas9 screens (supplemental Materials and methods; supplemental Figures 2, 3, and 4). Resulting data were analyzed with MAGeCK18 (supplemental Figure 5). Bioinformatics and statistical analyses are detailed in the supplemental Materials and methods.
PCRs and Sanger sequencing
Quantitative real-time polymerase chain reaction (qRT-PCR) was performed using the probes indicated in supplemental Table 2. Genomic PCRs were performed with primers listed in supplemental Table 3. Sanger sequencing was performed by Eurofins Genomics Company (Ebersberg, Germany). Details are in the supplemental Materials and methods.
Cell viability, clonogenic and apoptosis assays, and siRNA silencing
Cell viability assay was performed by using CellTiter Glo assay (Promega) following manufacturer’s instructions. Clonogenic assay was performed as in the supplemental Materials and methods. Apoptosis was assessed through annexin V/7-aminoactinomycin D (7AAD) staining (BD). A total of 100 nM of Silencer Select siRNAs against RP11-350G8.5 or negative control (Thermo Fisher Scientific) was delivered in cells via electroporation.
Flow cytometric analyses
All flow cytometric analyses were performed via Attune NxT Flow Cytometer (Thermo Fisher Scientific). Indirect staining of membrane expression of interleukin 6 receptor (IL-6R) or calreticulin (CRT) was performed as previously described,17 using 1 μg/mL of anti–IL-6R (562090; BD), or anti-CRT (ab2907; Abcam, United Kingdom).
RNA-FISH
RNA fluorescence in situ hybridization (FISH) was performed through Stellaris RNA FISH Probes (Biosearch Technologies, United Kingdom). Details about RNA-FISH and colocalization immunofluorescence (IF) are reported in the supplemental Materials and methods.
RNA sequencing, western blot, and phagocytosis assay
RNA sequencing was performed by Eurofins Genomics, according to their INVIEW Transcriptome Discover Protocol. Details are in the supplemental Materials and methods. Western blot (WB) analysis was performed as previously reported3 by using the antibodies listed in supplemental Table 4. Phagocytosis was assessed as previously reported17 and described in the supplemental Materials and methods.
In vivo experiments
In vivo experiments were conducted as in the supplemental Materials and methods. Tumor volume and imaging were acquired as previously reported via digital caliper and IVIS system (Perkin Elmer).19 Histologic analyses were conducted as in the supplemental Materials and methods.
Biophysical assays
RP11-350G8.5 secondary structure was generated by RNAfold.20 Putative quadruplex-forming G-rich sequences (QGRS) were predicted by QGRS Mapper.21 RNA sequences (proven to be >98% pure by nuclear magnetic resonance [NMR]) (supplemental Figure 20A-E), listed in the supplemental Materials and methods, were synthesized as previously reported.22 Thioflavin T assay,23 nuclear magnetic resonance,24 and circular dichroism25 spectroscopies were used. Antisense oligonucleotides (ASOs), listed in supplemental Table 5, were delivered in cells via electroporation. Details are in the supplemental Materials and methods.
Results
lncRNA dropout CRISPR-Cas9 screen of MM cell lines
We performed a recessive pooled CRISPR-Cas9 screen of 671 lncRNAs (Figure 1A; supplemental Materials and methods), using a previously validated third-generation lentiviral CRISPR-Cas9 library, the Zhu library,11 on the MM cell line AMO-1 and its derivative BZB-resistant subclone (ABZB; Figure 1B). Thirty days after library transduction we tracked through next-generation sequencing the pgRNA cassettes integrated in DNA of surviving cells, thus quantifying cell-growth dependency on the targeted lncRNAs based on overrepresentation/underrepresentation with respect to initial amounts.
lncRNA dropout CRISPR-Cas9 screen in MM cell lines. (A) Schematic representation of the CRISPR screening pipeline. (B) Spearman's correlation between pgRNA read count profiles (from DNA collected 30 days after transduction and selection of the library) across screen replicates = 0.85 and 0.88, respectively, for AMO-1 and ABZB, with color bars on top/left indicating cluster membership obtained via hierarchical clustering (complete distance method). (C) Representation of pgRNA abundance log fold changes (logFCs) in DNA collected 30 days after library transduction and selection vs plasmidic amounts for 3 groups of pgRNAs: nontargeting (negative controls [median logFC = 0.27 and 0.35, respectively, for AMO-1 and ABZB]), targeting ribosomal protein genes (control essential genes, median logFC = −0.68 and −0.43, with a logFC ≤−0.5, corresponding to a MAGeCK FDR ≤20%), and lncRNAs, across the 2 screens. Each point represents 1 of the 12 472 pgRNAs in the library with coordinates on the y-axis indicating the median logFC across screen replicates. (D) Gene-wise MAGeCK robust rank aggregation (RRA) scores for significant dependencies identified in the 2 screens at an FDR ≤20%. Top essential control genes, dependencies that are private to each cell line and shared across them (as per the color scheme) are highligted. (E) Number of significantly essential lncRNAs (at an FDR ≤20%) in the 2 screened cell lines and their overlap. MOI, multiplicity of infection.
lncRNA dropout CRISPR-Cas9 screen in MM cell lines. (A) Schematic representation of the CRISPR screening pipeline. (B) Spearman's correlation between pgRNA read count profiles (from DNA collected 30 days after transduction and selection of the library) across screen replicates = 0.85 and 0.88, respectively, for AMO-1 and ABZB, with color bars on top/left indicating cluster membership obtained via hierarchical clustering (complete distance method). (C) Representation of pgRNA abundance log fold changes (logFCs) in DNA collected 30 days after library transduction and selection vs plasmidic amounts for 3 groups of pgRNAs: nontargeting (negative controls [median logFC = 0.27 and 0.35, respectively, for AMO-1 and ABZB]), targeting ribosomal protein genes (control essential genes, median logFC = −0.68 and −0.43, with a logFC ≤−0.5, corresponding to a MAGeCK FDR ≤20%), and lncRNAs, across the 2 screens. Each point represents 1 of the 12 472 pgRNAs in the library with coordinates on the y-axis indicating the median logFC across screen replicates. (D) Gene-wise MAGeCK robust rank aggregation (RRA) scores for significant dependencies identified in the 2 screens at an FDR ≤20%. Top essential control genes, dependencies that are private to each cell line and shared across them (as per the color scheme) are highligted. (E) Number of significantly essential lncRNAs (at an FDR ≤20%) in the 2 screened cell lines and their overlap. MOI, multiplicity of infection.
AMO-1 and ABZB screens’ quality was within expected ranges for screens performed with the Zhu library or other previously published screens11 (supplemental Materials and methods; supplemental Figure 6A-C).
lncRNA-targeting pgRNAs exhibited wide ranges of depletion log fold changes (FCs) compared with nontargeting guides and control essential genes (Figure 1C). Excluding ribosomal protein genes and other controls in the CRISPR library, we identified 42 non–protein-coding loci significantly reducing cell growth or inducing death in MM cells on CRISPR-Cas9 targeting (14 in AMO-1 and 37 in ABZB) at a MAGeCK18 false discovery rate (FDR) ≤20% (supplemental Table 6; Figure 1D; supplemental Materials and methods). Of these, 9 dependencies were in common across the 2 cell lines (Figure 1E) and tended to be more significantly essential than the 33 dependencies exclusive to only 1 cell line (Student t test P = .006 and .001, respectively, for ABZB and AMO-1; supplemental Figure 6D). This supports the MM specificity and genomic-context independence of these hits. Only 4% of the depleted hits in at least 1 of the screened cell lines was previously associated with cancer (supplemental Table 7), according to the CRlncRNA database,26 with most of them being functionally uncharacterized.
Prioritization of oncogenic lncRNA candidates
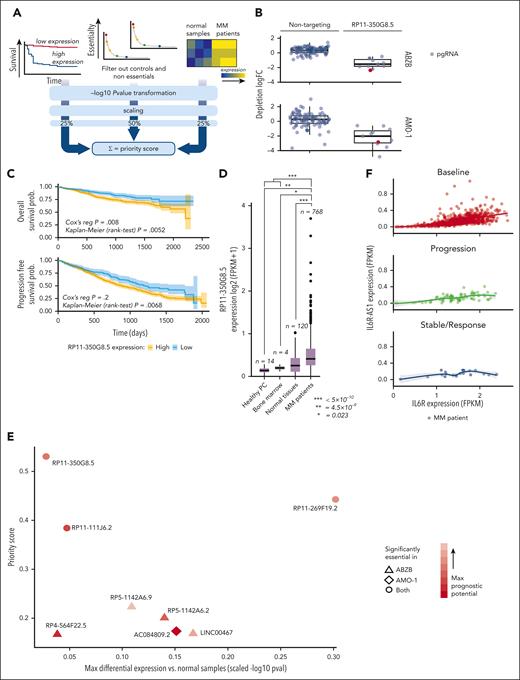
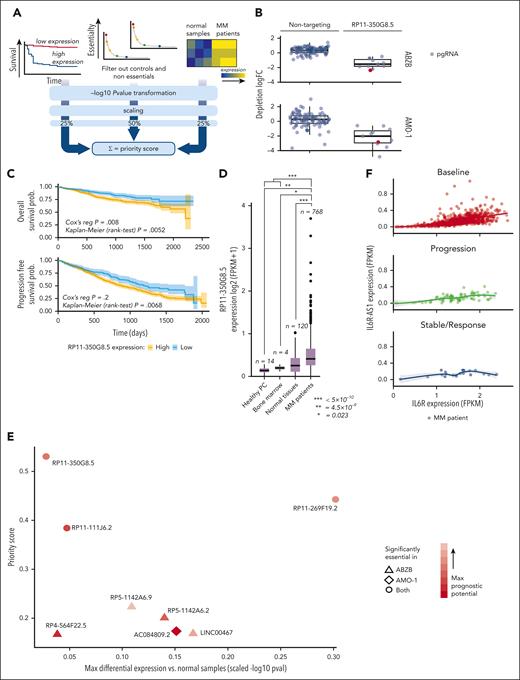
To prioritize candidate lncRNAs emerging from the CRISPR-Cas9 screen based on their putative oncogenic potential, we designed and used a computational pipeline combining screening results with prognostic and gene expression data from patients with MM, similar to our previous approach14 (supplemental Materials and methods; Figure 2A; supplemental Tables 8-10).
lncRNA prioritization scheme and results. (A) The lncRNA prioritization scheme integrating results from the CRISPR-Cas9 screens, prognostic relevance of lncRNAs and their differential expression (DE) in patients with MM contrasted to normal tissues, from publicly available data sets. (B) CRISPR-Cas9 depletion log fold change (logFC) of individual nontargeting pgRNAs and pgRNAs targeting the top-priority hit RP11-350G8.5, across the 2 screens. The pgRNAs selected and used for the follow-up experimental validations are reported in red. (C) Association between high basal expression of RP11-350G8.5 and poorer overall (OS)/progression-free survival (PFS) in patients with MM (from the MMRF/coMMpass study). Reported P values are from a Cox proportional hazards regression model and from a Kaplan-Meier log-rank test performed across a partition induced by the best discriminating patient-percentile threshold of RP11-350G8.5 expression (40% and 31%, respectively, for OS and PFS), which was determined in a supervised manner, for visualization purposes. (D) Basal expression comparison for RP11-350G8.5 across patients with MM, normal tissues, healthy bone marrow, and plasma cells. In the prioritization pipeline, DE is computed via a generalized linear model. Here, for visualization purposes, a Student t test has been performed across groups and resulting P values are reported. (E) High-priority oncogenic lncRNAs outputted by the prioritization pipeline. Each point is an lncRNA with coordinates on the 2 axes indicating, respectively, best scaled -log transformed P values from 2 DE analyses comparing patients with MM with normal samples (x-axis), and priority scores (y-axis). Shapes indicate the cell line in which the lncRNAs were found significantly essential, according to the screen; color intensities are proportional to the best P value from OS/PSF based on the lncRNA expression observed in patients with MM. (F) Comparison of basal expression of RP11-350G8.5 (IL-6R-AS1) and its antisense gene (IL-6R) showing only a mild significant positive correlation between sense and antisense genes in each group of patients across groups of patients with MM segmented on the basis of their response to bortezomib treatment.
lncRNA prioritization scheme and results. (A) The lncRNA prioritization scheme integrating results from the CRISPR-Cas9 screens, prognostic relevance of lncRNAs and their differential expression (DE) in patients with MM contrasted to normal tissues, from publicly available data sets. (B) CRISPR-Cas9 depletion log fold change (logFC) of individual nontargeting pgRNAs and pgRNAs targeting the top-priority hit RP11-350G8.5, across the 2 screens. The pgRNAs selected and used for the follow-up experimental validations are reported in red. (C) Association between high basal expression of RP11-350G8.5 and poorer overall (OS)/progression-free survival (PFS) in patients with MM (from the MMRF/coMMpass study). Reported P values are from a Cox proportional hazards regression model and from a Kaplan-Meier log-rank test performed across a partition induced by the best discriminating patient-percentile threshold of RP11-350G8.5 expression (40% and 31%, respectively, for OS and PFS), which was determined in a supervised manner, for visualization purposes. (D) Basal expression comparison for RP11-350G8.5 across patients with MM, normal tissues, healthy bone marrow, and plasma cells. In the prioritization pipeline, DE is computed via a generalized linear model. Here, for visualization purposes, a Student t test has been performed across groups and resulting P values are reported. (E) High-priority oncogenic lncRNAs outputted by the prioritization pipeline. Each point is an lncRNA with coordinates on the 2 axes indicating, respectively, best scaled -log transformed P values from 2 DE analyses comparing patients with MM with normal samples (x-axis), and priority scores (y-axis). Shapes indicate the cell line in which the lncRNAs were found significantly essential, according to the screen; color intensities are proportional to the best P value from OS/PSF based on the lncRNA expression observed in patients with MM. (F) Comparison of basal expression of RP11-350G8.5 (IL-6R-AS1) and its antisense gene (IL-6R) showing only a mild significant positive correlation between sense and antisense genes in each group of patients across groups of patients with MM segmented on the basis of their response to bortezomib treatment.
First, we identified lncRNAs significantly affecting MM cellular fitness upon CRISPR-Cas9 targeting using MAGeCK18 (supplemental Materials and methods). We filtered out control essential genes and nontargeting pgRNAs alongside lncRNAs not showing a significant effect on fitness on CRISPR targeting (MAGeCK FDR >20%) in any of the screened cell lines. Next, we selected lncRNAs whose basal expression in 768 patients with MM, annotated on the coMMpass data set27 for overall survival (OS) and progression-free survival, showed significant prognostic power (Cox proportional-hazards regression P < .05) (Figure 2C; supplemental Table 8). Moreover, we considered lncRNAs that were significantly overexpressed in 768 patients with MM profiled through RNA sequencing (RNA-seq) on coMMpass,27 in contrast to 120 normal tissues, 4 bone marrow normal plasma cells profiled on The Cancer Genome Atlas,28 and 14 healthy plasma cell samples from published studies (supplemental Materials and methods; Figure 2D). We filtered out lncRNAs down-regulated in patients with MM. With this approach, we prioritized 8 uncharacterized lncRNAs as putatively oncogenic and potential therapeutic targets for MM (supplemental Materials and methods; Figure 2E; supplemental Table 9).
Selection of high-priority oncogenic lncRNA candidates
Among the 8 prioritized lncRNAs essential for AMO-1 and/or ABZB cell fitness, the previously uncharacterized RP11-350G8.5 (ENST00000424435, alias IL6R-AS1), emerged as top-priority hit (supplemental Table 9). The high priority score of RP11-350G8.5 was due to its significant strong essentiality in both AMO-1 and ABZB (Figure 1D) (depletion logFC = −1.53 and −2.02, MAGeCK FDR = 6.5 × 10⁻⁴ and 2.6 × 10⁻⁴; Figure 2B), significant association with poor prognosis in patients with MM (OS Cox proportional-hazards regression P = .008; Figure 2C), and upregulation in patients with MM compared with normal tissues (FDR = 5.46 × 10⁻⁹; Figure 2D).
Comparing expression levels of RP11-350G8.5 and its antisense gene (IL-6R) in baseline or BZB-treated patients (Figure 2F) did not provide evidence of a possible negative regulation of the oncogenic IL-6R that can be ascribed to RP11-350G8.5, regardless of drug response. In addition, because IL-6R is not essential in AMO-1 (as per Project Score data29; supplemental Table 11; supplemental Figure 6E), the detrimental effect on cellular fitness exerted by CRISPR-Cas9 targeting of RP11-350G8.5 does not involve the modulation of its antisense gene.
To validate the sensitivity of our prioritization scheme concerning milder hits (Figure 2E), we selected the ABZB-exclusive dependency LINC00467 (ENST00000423222). LINC00467 had a lower priority score but was among the top significantly depleted lncRNAs yielded by a direct MAGeCK comparison of ABZB vs AMO-1 pgRNA abundance after library transduction/selection and cells’ expansion (supplemental Table 6; supplemental Figure 6F). Furthermore, it was one of the lncRNAs with the highest positive differential expression in patients with MM vs normal plasma cells (logFC = 2.46; FDR = 5.93 × 10⁻⁷) (supplemental Table 9), or other normal tissues (logFC = 0.64; FDR = 1.16 × 10⁻¹²) (supplemental Figure 7A), and showed predictive prognostic ability of the OS of patients with MMD (P = 3.05 × 10⁻²; supplemental Figure 7B). Interestingly, by mining publicly available in vitro drug response data30 paired with the basal expression profiles of the screened cell lines,31 we observed a significant effect size association (Cohen D = 0.88; Student t test P < .15; supplemental Materials and methods) between increased expression of LINC00467 and reduced sensitivity to bortezomib, but not to other drugs affecting protein stability and degradation (supplemental Figure 7C-D).
LINC00467 has been described as onco-lncRNA for several cancers,32 but to our knowledge, we report the first evidence of its oncogenic potential in BZB-resistant MM.
RP11-350G8.5 and LINC00467 expression assessment
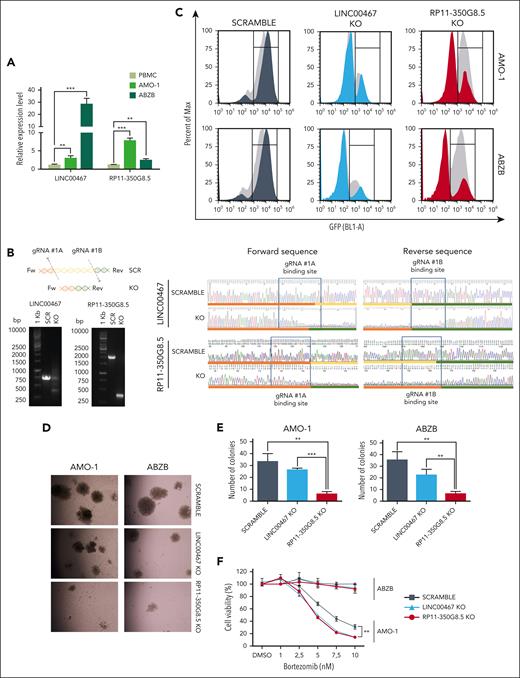
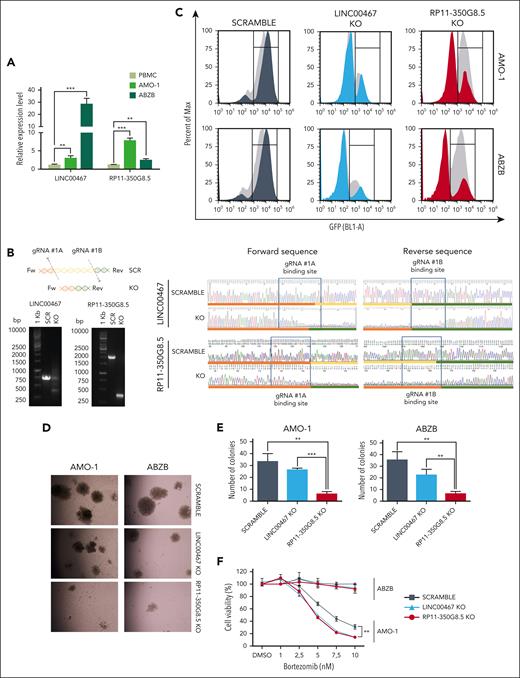
Consistent with our analysis of RNA-seq data from the coMMpass data set, we observed through quantitative real time PCR that RP11-350G8.5 and LINC00467 are overexpressed in both ABZB and AMO-1 cell lines compared with peripheral blood mononuclear cells from healthy donors (Figure 3A). In addition, RP11-350G8.5 showed a lower basal expression compared with LINC00467 in cells, as well as patients with MM (supplemental Table 9). In agreement with our CRISPR screen results, the significant LINC00467 overexpression in ABZB compared with AMO-1 (Figure 3A) suggests a potential driving role of this lncRNA in BZB-resistant cells only. Although warranting additional study, if further demonstrated, this finding will pave the way to multiple approaches to tackling BZB resistance in MM.
Functional validation of prioritized oncogenic lncRNA candidates. (A) RP11-350G8.5 and LINC00467 basal expression levels via quantitative real time PCR (qRT-PCR) in MM cell lines and peripheral blood mononuclear cells (PBMCs) from healthy donors (values are normalized to the expression of GAPDH). (B) Representative image of genomic PCR products before and after KO of LINC00467 and RP11-350G8.5 in AMO-1 cells, visualized on 1.5% agarose gels. On the right: Sanger sequence of the amplicons encompassing the CRISPR-targeted region. Blue rectangles highlight pgRNA binding sites, whereas colored lines refer to the schematic picture of the KO reported above the gel picture (on the left). (C) Representative image of flow cytometric monitoring of AMO-1 and ABZB cells transduced with a SCRAMBLE-GFP-CRISPR vector (dark gray) or LINC00467/KO-GFP-CRISPR vector (light blue) or RP11-350G8.5/KO- GFP-CRISPR vector (red). Light-gray curves represent the percentage of viable cells at day 0 (48 hours after lentiviral transduction) with overlapping colored curves at day 20. (D) Representative images of colony assay of AMO-1 and ABZB GFP-sorted cells, 15 days after plating, were generated using EVOS XL-Core microscope (Invitrogen by Thermo Fisher) (magnification ×10). (E) Number of colonies in 3 independent wells. (F) Dose-response curves 24 hours after treatment with bortezomib (1-10 nM). Percentage of viable cells ± standard deviation are normalized with respect to DMSO-treated cells (vehicle) for each experimental condition. Statistical differences were assessed across all plots via Student t test; ∗P < .05, ∗∗P < .01, and ∗∗∗P < .001.
Functional validation of prioritized oncogenic lncRNA candidates. (A) RP11-350G8.5 and LINC00467 basal expression levels via quantitative real time PCR (qRT-PCR) in MM cell lines and peripheral blood mononuclear cells (PBMCs) from healthy donors (values are normalized to the expression of GAPDH). (B) Representative image of genomic PCR products before and after KO of LINC00467 and RP11-350G8.5 in AMO-1 cells, visualized on 1.5% agarose gels. On the right: Sanger sequence of the amplicons encompassing the CRISPR-targeted region. Blue rectangles highlight pgRNA binding sites, whereas colored lines refer to the schematic picture of the KO reported above the gel picture (on the left). (C) Representative image of flow cytometric monitoring of AMO-1 and ABZB cells transduced with a SCRAMBLE-GFP-CRISPR vector (dark gray) or LINC00467/KO-GFP-CRISPR vector (light blue) or RP11-350G8.5/KO- GFP-CRISPR vector (red). Light-gray curves represent the percentage of viable cells at day 0 (48 hours after lentiviral transduction) with overlapping colored curves at day 20. (D) Representative images of colony assay of AMO-1 and ABZB GFP-sorted cells, 15 days after plating, were generated using EVOS XL-Core microscope (Invitrogen by Thermo Fisher) (magnification ×10). (E) Number of colonies in 3 independent wells. (F) Dose-response curves 24 hours after treatment with bortezomib (1-10 nM). Percentage of viable cells ± standard deviation are normalized with respect to DMSO-treated cells (vehicle) for each experimental condition. Statistical differences were assessed across all plots via Student t test; ∗P < .05, ∗∗P < .01, and ∗∗∗P < .001.
Confirmation of RP11-350G8.5 and LINC00467 essentiality in MM cells
We induced a selective knockout (KO) of RP11-350G8.5 and LINC00467 in the AMO-1 and ABZB Cas9-expressing cells via a CRISPR–green fluorescent protein (GFP) lentiviral vector encoding for the most efficient and selective pgRNAs among those included in the Zhu library (Figure 2B; supplemental Figure 8A-C). A CRISPR-GFP vector encoding for a nontargeting pgRNA was used as negative control (SCRAMBLE). After verifying the genomic cutting at the desired regions via Sanger sequencing (Figure 3B), by monitoring GFP expression over time via flow cytometry, we observed a selective reduction of GFP+ cells only when using the targeting pgRNAs (Figure 3C). Consistent with the pooled CRISPR screen results and prioritization score, we observed a strong reduction of the population of KO-GFP+ cells (Figure 3C), 3-dimensional (3D) colony formation (Figure 3D-E) of RP11-350G8.5 KO in both cell lines, and a moderate effect of LINC00467 KO in ABZB cells only. Moreover, we observed a significant increase of sensitivity to BZB treatment in AMO-1 following the KO of both lncRNAs (Figure 3F).
Characterization of RP11-350G8.5 as a new target for MM
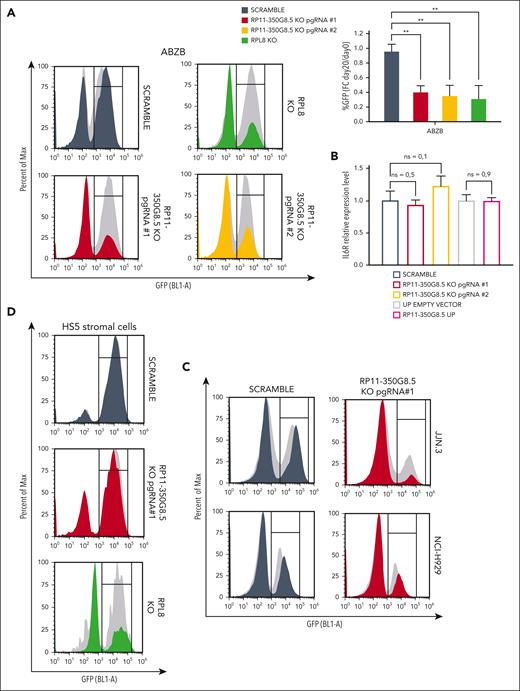
After confirming the target-dependent reduction of cell viability on AMO-1 and ABZB using custom-designed pgRNAs, not included in the library, for both LINC00467 and RP11-350G8.5 (Figure 4A; supplemental Figure 9A-F), we sought to functionally characterize the top-priority oncogenic lncRNA candidate RP11-350G8.5. Before this, we validated the biological effect of a siRNA targeting RP11-350G8.5. Consistent with our CRISPR data, we observed an ∼60% reduced cell viability and a 2-fold increase in apoptosis in AMO-1 and ABZB cells compared with controls (supplemental Figure 9G). Further validation comparing the effects of RP11-350G8.5 depletion with a ribosomal protein gene (RPL8) KO showed similar viability reduction (Figure 4A; supplemental Figures 10 and 11), indicating RP11-350G8.5's essential role in MM cell survival. Moreover, coculture experiments revealed that the loss of RP11-350G8.5 increased apoptotic MM cells even in presence of protective human-derived bone marrow stromal cells (supplemental Figure 12).
Additionally, we confirmed the selectivity of the pgRNAs used by assessing the RNA level of IL-6R, following RP11-350G8.5 KO (Figure 4B). This was expected as the pgRNA binding sites are not overlapping with the coding sequence of IL-6R (supplemental Figure 13). Furthermore, in the context of RP11-350G8.5 overexpression (UP), we found no significant alteration in the IL-6R transcript. This confirmation underscores that the expression of IL-6R is independent from its antisense lncRNA (Figure 4B).
Next, we extended our validation to other in vitro models: the MM cell lines JJN.3 and NCI-H929 and the nontumor cell line with stromal origin HS5 (supplemental Figure 14A-B), observing a strong and moderate detrimental effect on viability for RP11-350G8.5 KO JJN.3 and NCI-H929, respectively (Figure 4C; supplemental Figure 14C), and no reduction of viability in HS5, which was nevertheless sensitive to the KO of RPL8 (Figure 4D). The strong sensitivity to RP11-350G8.5 KO of JJN.3 was also reflected in the impairment of clonogenic potential (supplemental Figure 14D). Taken together, these results confirmed the model unspecificity of RP11-350G8.5 essentiality and its tumor-cell selectivity. Because the biological effect triggered by the RP11-350G8.5 KO was not pgRNA specific, and the 2 pgRNAs had a similar on-target efficiency and effect on cell viability (Figure 4A-B; supplemental Figure 15A-C), and BZB sensitization (Figure 3E; supplemental Figure 15D), we used only 1 pgRNA (number 1) for further investigations.
Moreover, because the intracellular localization of lncRNAs provides an effective means to unveil their functions,6,33,34 we determined the subcellular homing of RP11-350G8.5, which we found slightly expressed compared with the housekeeping GAPDH (Figure 4E, left panel) and localized in the cytoplasm (Figure 4E).
On the other hand, following the overexpression of RP11-350G8.5 on AMO-1 and ABZB through a lentiviral-GFP vector, we observed a moderate increase in colony formation (supplemental Figure 16A), a positive shift in GFP median fluorescent intensity 4 days after transduction (supplemental Figure 16B) in both cellular models, and a decrease in BZB-treatment sensitivity in AMO-1 (Figure 4F).
Finally, we initiated an investigation of the effect of RP11-350G8.5 loss on tumor growth in vivo. We observed a significant impairment of tumor growth in ABZB RP11-350G8.5 KO on a limited population of xenografted mice (n = 2 per group; Figure 4G) with a significant reduction of the tumor volume (Figure 4H-I) and of the weights of the retrieved tumor masses (Figure 4J) over time, compared with xenografted mice injected with SCRAMBLE vectors. Although these results are highly suggestive, the expiration of the funded project time frame after manuscript submission did not allow a further investigation in a larger cohort of mice. Therefore, the conclusion from our in vivo preliminary study is tentative until more animals can be investigated to confirm the critical role of RP11-350G8.5 in MM in vivo.
Molecular and functional characterization of RP11-350G8.5 KO in MM cells
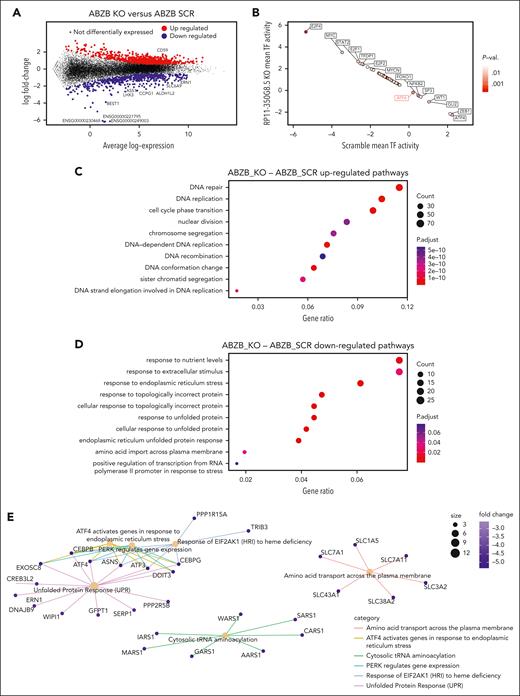
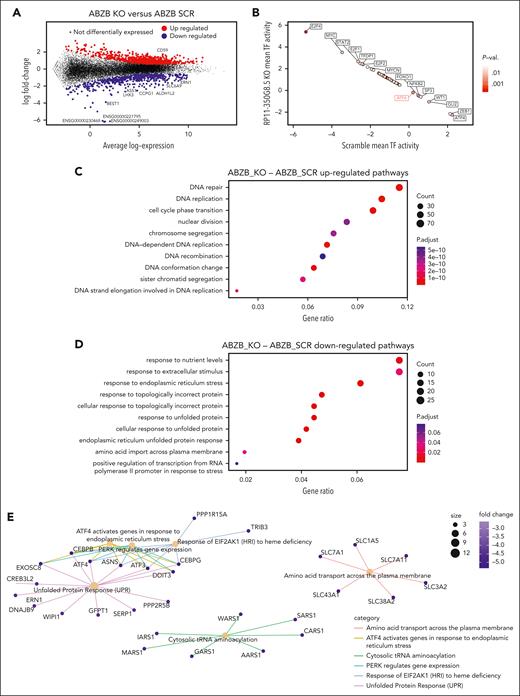
To reveal the molecular changes triggered by RP11-350G8.5 KO, we profiled ABZB SCRAMBLE and KO cells via RNA-seq. Differential expression analysis across the 2 conditions revealed 815 upregulated genes (FC >1.5 and FDR <5%) and 511 downregulated genes (FC <−1.5 and FDR <5%) (Figure 5A; supplemental Figure 17; supplemental Table 12). A DoRothEA analysis35 highlighted a strong modulation of the regulatory activity of transcription factors downstream of key cancer pathways (Figure 5B).
Differential expression and pathway enrichment analysis of ABZB cell lines on RP11-350G8.5 KO. (A) Differential expression analysis: each point is a gene, significantly differentially expressed genes in RP11-350G8.5 KO vs SCRAMBLE (SCR) are highlighted, with top 10 differentially expressed ones in the insets. (B) Transcription factors differentially active in RP11-350G8.5 KO vs SCR computed by DoRothEA. (C-D) Gene Ontology (GO) BP Enrichment Analysis of the upregulated and downregulated genes. (E) Cnet plot details for the Reactome Pathway Enrichment Analysis of the downregulated genes.
Differential expression and pathway enrichment analysis of ABZB cell lines on RP11-350G8.5 KO. (A) Differential expression analysis: each point is a gene, significantly differentially expressed genes in RP11-350G8.5 KO vs SCRAMBLE (SCR) are highlighted, with top 10 differentially expressed ones in the insets. (B) Transcription factors differentially active in RP11-350G8.5 KO vs SCR computed by DoRothEA. (C-D) Gene Ontology (GO) BP Enrichment Analysis of the upregulated and downregulated genes. (E) Cnet plot details for the Reactome Pathway Enrichment Analysis of the downregulated genes.
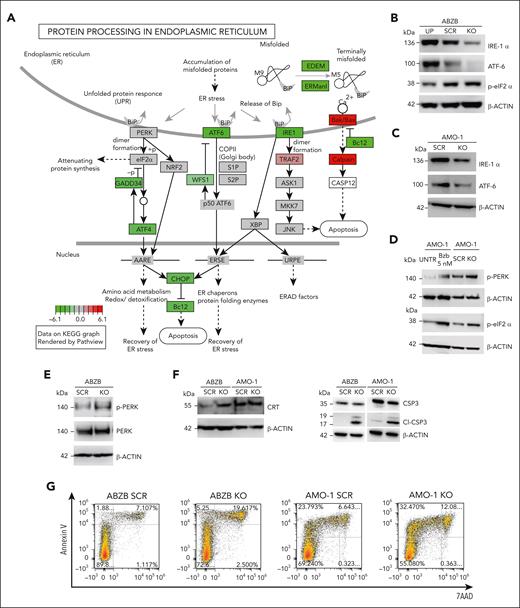
Moreover, a gene ontology enrichment analysis revealed an expected overactivation of pathways involved in nucleotide-excision DNA repair/gap-filling system (Fisher exact test [FET] adjusted P = 8.8 × 10⁻¹⁶) and DNA strand elongation/replication (FET P = 1.34 × 10⁻¹⁰) that occur to repair the double-strand break induced by the RNA-guided CRISPR-Cas9 cutting (Figure 5C). Interestingly, when looking at downregulated genes, we found significant enrichments of the endoplasmic reticulum (ER) unfolded protein response (UPR) system (FET P = 3.00 × 10⁻⁴; Figure 5D), widely considered as an actionable therapeutic target for MM and known to be involved in mechanisms of resistance to proteasome inhibitors, including BZB.36,37 Reactome Pathway Enrichment and Kyoto Encyclopedia of Genes and Genomes analyses revealed a perturbed network surrounding PERK, ATF6 and IRE1a (ERN1) as main regulators (Figures 5E and 6A; supplemental Figure S18).
WB data confirmed the ATF6 and IRE1α down-modulation, and the increase of eIF2α (downstream of PERK kinase) phosphorylated (p) form after KO, and the reverted phenotype, following overexpression (Figure 6B). Moreover, we observed the modulation of the same players of the UPR system also in AMO-1 KO cells (Figure 6C-D). Furthermore, because a Reactome analysis specifically highlighted a PERK-dependent UPR modulation (Figure 5E), we focused on PERK status in AMO-1 (Figure 6D) and ABZB (Figure 6E) RP11-350G8.5 KO or BZB treated cells to investigate the effect of target depletion on BZB sensitivity. We observed an increase in PERK-phosphorylation cascade after KO in both cell lines like that observed upon BZB treatment at 5 nM in AMO-1 cells. This confirmed that the KO of RP11-350G8.5 in ABZB (cultured in the presence of BZB 10 nM) can restore PERK phosphorylation cascade, which is reduced in the case of BZB resistance. This activation could trigger the switch from the adaptive to the terminal UPR, allowing apoptotic tumor cell death,38 as demonstrated by observing the increase of cleaved caspase-3 in KO cells (Figure 6F), and the increase of late apoptotic events, detected by flow cytometry (Figure 6G).
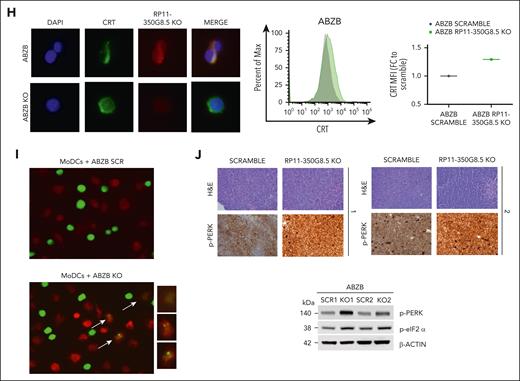
On the other hand, consistent with previous findings,17,39 we supposed the PERK-dependent induction of immunogenic cell death,40 which is triggered by the translocation on tumor cell surface of the ER marker CRT.39 We validated (1) the overexpression of CRT following KO via WB (Figure 6F) and (2) the increase in CRT cell-surface translocation via IF (Figure 6H, left) and flow cytometry (Figure 6H, right) in KO cells with respect to SCRAMBLE cells.
After 18 hours of coculture of ABZB SCRAMBLE or KO cells with monocyte-derived dendritic cells from healthy donors (at a 5:1 effector:target ratio), we demonstrated the increase of engulfed cells on RP11-350G8.5 depletion, confirmed by both IF and flow cytometric analysis (Figure 6I; supplemental Figure S19).
Finally, to confirm our in vitro findings, we assessed PERK phosphorylation level in RP11-350G8.5 KO tumors explanted from animals observing the expected strong increase, with both immunohistochemistry and WB analysis (Figure 6J).
Characterization of RP11-350G8.5 structural features and selection of G-rich oligonucleotides in vitro
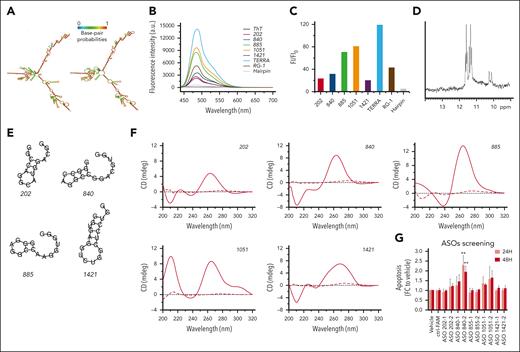
To structurally characterize RP11-350G8.5, we used the RNAfold computational tool20 to predict its 2-dimensional structure, which showed large regions of folding complexity (Figure 7A). Moreover, we investigated the structural features of RP11-350G8.5 sequence available on RNAcentral database41 to identify functional domains, by focusing on RNA G-quadruplex (G4) forming-regions, of great relevance for biological and therapeutic purposes.42 Via QGRS mapper,21 we identified 10 putative G4-forming sequences, each containing 4 repeats of 2 consecutive guanines (supplemental Table 13). We selected and synthesised the top scoring sequences (named 202, 840, 885, 1051, and 1421, based on their starting position on RP11-350G8.5 transcript; Table 1) for further experimental characterization in K+-containing buffer43 via thioflavin T (ThT) assay, NMR, and circular dichroism (CD) spectroscopies.
Characterization of RP11-350G8.5 structural features. (A) RNA secondary structure prediction of RP11-350G8.5 computed using the RNAfold web server: (left) MFE and (right) centroid structures (structures are colored by base-pairing probabilities). (B) Fluorescence emission spectra of ThT (1 μM) in the absence (black line) and presence of various RNA molecules (2.0 μM): 202, 840, 885, 1051, 1421, compared with TERRA, RG-1 positive controls, and a hairpin-forming RNA sequence (negative control). (C) Bar graph of fluorescence enhancement of ThT in the presence of the RNAs. The addition of the 5 RNA molecules resulted in fluorescence enhancements, with FI/FI0 values of 23, 32, 71, 81, and 20 for 202, 840, 885, 1051, and 1421, respectively. Two G4-forming positive controls, TERRA and RG-1, exhibited FI/FI0 values of 119 and 43, respectively, whereas the negative control (hairpin) showed a value of 5. (D) Imino proton region of the 1-dimensional (1D) 1H-NMR spectrum of 1051 recorded at 10°C. (E) Predicted secondary structures for the RNA sequences analyzed by RNAfold. (F) CD spectra of 202, 840, 885, 1051, and 1421 recorded at 10 and 100°C (solid and dashed lines, respectively). (G) ASO screening: bar graphs representative of the induction of apoptosis (fold change to vehicle) 24 and 48 hours after electroporation with 50 nM of different ASOs targeting the regions upstream (1) and downstream (2) to the 5 RNA sequences indicated as 202-840-855-1051-1421. Values on the x-axis refer to the fold change to vehicle of the percentage of cells positive for both annexin V/7AAD apoptotic markers. For the most efficient ASO (840-2), a representative annexin V/7AAD staining and a cell viability curve is provided in supplemental Figure S22B-C. Statistics were analyzed using 2-way analysis of variance test (cutoff ∗P < .05, ∗∗P < .01).
Characterization of RP11-350G8.5 structural features. (A) RNA secondary structure prediction of RP11-350G8.5 computed using the RNAfold web server: (left) MFE and (right) centroid structures (structures are colored by base-pairing probabilities). (B) Fluorescence emission spectra of ThT (1 μM) in the absence (black line) and presence of various RNA molecules (2.0 μM): 202, 840, 885, 1051, 1421, compared with TERRA, RG-1 positive controls, and a hairpin-forming RNA sequence (negative control). (C) Bar graph of fluorescence enhancement of ThT in the presence of the RNAs. The addition of the 5 RNA molecules resulted in fluorescence enhancements, with FI/FI0 values of 23, 32, 71, 81, and 20 for 202, 840, 885, 1051, and 1421, respectively. Two G4-forming positive controls, TERRA and RG-1, exhibited FI/FI0 values of 119 and 43, respectively, whereas the negative control (hairpin) showed a value of 5. (D) Imino proton region of the 1-dimensional (1D) 1H-NMR spectrum of 1051 recorded at 10°C. (E) Predicted secondary structures for the RNA sequences analyzed by RNAfold. (F) CD spectra of 202, 840, 885, 1051, and 1421 recorded at 10 and 100°C (solid and dashed lines, respectively). (G) ASO screening: bar graphs representative of the induction of apoptosis (fold change to vehicle) 24 and 48 hours after electroporation with 50 nM of different ASOs targeting the regions upstream (1) and downstream (2) to the 5 RNA sequences indicated as 202-840-855-1051-1421. Values on the x-axis refer to the fold change to vehicle of the percentage of cells positive for both annexin V/7AAD apoptotic markers. For the most efficient ASO (840-2), a representative annexin V/7AAD staining and a cell viability curve is provided in supplemental Figure S22B-C. Statistics were analyzed using 2-way analysis of variance test (cutoff ∗P < .05, ∗∗P < .01).
Biophysical characterization of G-rich oligonucleotides in vitro
We performed ThT assay to distinguish G4 and non-G4 RNA structures.23,38 ThT fluorescence intensity (FI) increases significantly on specific binding to a G4, whereas it remains weak in the presence of other RNA forms (Figure 7B). Because G4-forming sequences lead to FI/FI0 values >40 on average, only 885 and 1051 clearly showed the ability to form it (Figure 7C).
We then recorded 1-dimensional 1H-NMR spectra to assess G4 formation,39 with respect to other nucleic acid conformations,44 such as hairpin structures.45 Direct evidence of G4 formation is provided by peaks only in the 10.0- to 12.0-ppm spectral region (Hoogsteen base pairing), as observed for 1051 (Figure 7D). The 885 also showed signals in that region only, but with broad and low-intensity resonances (supplemental Figure 21C), suggesting a heterogeneous mixture of G4s, probably including higher-order G4 species. The spectra of 202, 840, and 1421 suggest that they are more likely to form hairpin structures (supplemental Figure 21A-B-D).
These results were supported by RNAfold web server analysis20 showing that 1051 has no tendency to form a hairpin, whereas 885 may form a hairpin only poorly favored from a thermodynamic point of view, suggesting its greater propension for G4 formation (Figure 7E; Table 1). Conversely, the other RNAs could form hairpin structures with some stability.
Finally, we performed CD experiments to validate the conformational properties of the RNAs according to the band positivity (supplemental Materials and methods). CD spectra suggested that all RNA sequences form secondary structures in solution (Figure 7F). By analyzing the differences at shorter wavelengths, to discriminate G4 formation from A-type duplexes (positive and negative bands at 210 nm),25,42 we confirmed the ability of 1051 and 885 to form a G4s, whereas the spectra of 202, 840, and 1421 supported the formation of A-type duplexes rather than G4s (Figure 7F).
Sigmoidal melting curves were obtained by CD melting experiments (supplemental Figure 21E-I) giving melting temperature values above 50°C (Table 1), which indicate the formation of stable secondary structures at physiological temperature. Almost identical heating and cooling curves for 202, 840, 1051, and 1421 imply unimolecular formation: G4 for 1051, hairpin for others. Conversely, 885 showed hysteresis, suggesting intermolecular G4s or higher-order structures via G4 self-association (supported by ThT and NMR results).
ASO-mediated targeting of RP11-350G8.5
To validate the effect of RP11-350G8.5 loss with an independent method, we sought to target it at the transcript level through antisense oligonucleotides (ASOs), an efficient and well-established system for targeting lncRNAs,2,46,47 which is also potentially translatable into clinical practice.48,49 To this aim, we screened a panel of ASOs binding the sites upstream or downstream the 5 RNA sequences in supplemental Table 5 to hamper the formation of functional pockets by targeting the adjacent, more accessible, regions and to validate the effect induced by the loss of RP11-350G8.5 at the transcriptomic level. Once we verified the ASO uptake efficiency and stability (supplemental Figure 22A), we observed a significant increase of apoptosis, detected by annexin V/7AAD staining, 24 and 48 hours after electroporation, mainly induced by the 4 ASOs targeting RP11-350G8.5 transcript in correspondence of regions flanking the hairpin-like structure 840 (Figure 7G; supplemental Figure 22B), and the G-quadruplex forming structure 1051 (Figure 7G). However, because we observed variability among the biological replicates, further efforts will be required to optimize the delivery strategy as well as the chemical structure of ASOs to increase their effectiveness, before moving toward in vivo validation.
Discussion
MM is a lethal plasma cell malignancy in which high and multistep genetic heterogeneity and the protective role of bone marrow milieu cause resistance to therapy.1 Several studies have demonstrated that MM is susceptible to the targeting of onco-lncRNAs because of their key role in MM onset, progression, crosstalk with microenvironment, and drug response.4 Nevertheless, protein–noncoding RNAs continue to be largely unexplored,2 and there is a burgeoning trend in systematically using genome editing technologies to address this research gap.50 Morelli and colleagues50 aimed at identifying novel MM vulnerabilities through systematic CRISPRi screens of MM cells, assembling a gRNA library in a MM patient- and model-guided manner. Pursuing an orthogonal strategy, we performed an unbiased CRISPR-Cas9 loss-of-function screen of MM cell lines (AMO-1 and its BZB resistant derivative, named ABZB). Similarly to our previous approach,14 we designed a computational lncRNA prioritization strategy combining screening results with transcriptional data and prognostic relevance of the targeted lncRNAs. Our study revealed RP11-350G8.5 (IL-6R-antisense lncRNA) as the most relevant vulnerability. The important role of IL-6R for MM cell progression has been previously demonstrated,51 whereas, to the best of our knowledge, no information is available for the antisense gene. Our results exclude a reciprocal regulation between IL-6R and RP11-350G8.5 and highlight the anti-tumoral effect exerted by RP11-350G8.5 inhibition in vitro and in vivo. Molecular studies on MM RP11-350G8.5 knocked-out cells highlighted a down-modulation in the UPR system, which is considered one of the main pathways essential for MM cell survival,52 because of the overproduction of a monoclonal immunoglobulin (protein M) by the malignant plasma cells, which induces ER stress and then activation of proteasome degradation to escape the ER stress-induced cell death.53 Because of this tumor-specific feature, the proteasome inhibitor BZB is administered as anti-MM first-line treatment.54 However, drug resistance commonly occurs.55 We demonstrated that the activation of PERK-phosphorylation cascade is able to trigger the shift from the proadaptive to the proapoptotic UPR-mediated effect,38,52,56 to activate an immunogenic cascade34 on tumor cells and to stimulate the phagocytic activity of primary immune cells, which was also observed in BZB-resistant models. These findings are particularly important considering that MM is a tumor characterized by an immunosuppressive microenvironment, and resistance to BZB negates its recently discovered ability to act as immunogenic inducer.57 Moreover, the selective targeting of a tumor-specific lncRNA regulating the UPR system may provide a great advantage in terms of efficacy and reduced toxicity compared with other pan inhibitors. Considering the insights into lncRNA subcellular localization and structural features presented in this study, future research will leverage this information to unravel the RNA-interactome map. The objective will be to achieve a more comprehensive understanding of the molecular axis governing our observed biological effects. This, in turn, will contribute to refining targeted therapeutic strategies for use in conjunction with conventional treatments, including BZB.
RP11-350G8.5 might be targeted in patients by small molecules or effective locked nucleic acid ASOs, which have been just successfully translated into clinical practice for noncoding RNA silencing by our group.48,58 Given the absence of 3D structural information for RP11-350G8.5 and the inherent limitations posed by its extensive sequence (1756 bp), which compromises the reliability of prediction tools59 and demands substantial time and resources for exploration, our findings provide valuable insights into the structural features of this lncRNA. Specifically, we highlight more accessible regions for ASO binding, located between positions 821 and 1080. This revelation is anticipated to facilitate the development of targeted therapeutics, as it suggests a focused investigation into a constrained region of 411 bp. Such studies can then be directed toward reconstructing the 3D conformation of functionally relevant pockets within our candidate. This approach will pave the way to a deeper understanding of the interactive partners of this cytoplasmic-homed lncRNA and then to the design and validation of a therapeutic strategy on patient-derived in vivo models that better recapitulate MM pathophysiology.
In conclusion, our findings, based on an unbiased functional screen and a bioinformatic target prioritization pipeline, provide novel information on 8 genetic vulnerabilities never associated before to MM, moving a step forward correlative studies so far mostly based on expression analyses only and not relying on functional validation. Moreover, we demonstrated, for the first time, the oncogenic role of RP11-350G8.5, providing a molecular, biological, and structural overview, which might pave the way to the design of next-generation therapeutics for MM and other incurable diseases.
Acknowledgments
The authors thank Gabriele Picco and Piero Carninci for reading their manuscript and providing valuable suggestions and critical feedback. They thank Christoph Driessen for kindly providing AMO-1 and ABZB cell lines, and Wensheng Wei and Kosuke Yusa for providing all the plasmid DNAs used in their study and deposited on Addgene. They thank the members of Giuseppe Viglietto’s research team (Donatella Malanga, Maria Chiara Sarubbi, Carmela De Marco, and Gemma Antonucci) for allowing them to use some instruments in their laboratory at the Magna Græcia University of Catanzaro. They thank the members of Giovanni Cuda’s research team (Elvira Immacolata Parrotta, Valeria Lucchino, and Stefania Scalise) for allowing them to use the fluorescence microscope in their laboratory at the Magna Græcia University of Catanzaro by providing technical support when required. They acknowledge the efforts of the Multiple Myeloma Research Foundation and all the centers that contribute to the coMMpass data set and The Cancer Genome Atlas research network.
This work has mainly been supported by an Italian Association for Cancer Research (AIRC) investigator grant, project number 21588, to P. Tassone), and partially supported by an AIRC investigator grant, project number 28772, to F.I. Moreover, this work was partially supported by contributions from the Italian Ministry of Health PSC SALUTE 2014-2020–POS4 “Cal-Hub-Ria” (grant T4-AN-09) and from PNRR project CN00000041 “National Center for Gene Therapy and Drugs based on RNA Technology.”
Authorship
Contribution: K.G. conceptualized and designed the study, contributed to the execution of the experiments, performed data analysis/representation, and wrote and edited the manuscript; S. Ascrizzi contributed to biological experiments and analyzed and curated results; P.C. executed bioinformatic analyses, curated results, and designed figures; J.A. and B.P. conceptualized and designed the biophysical experiments and contributed to the manuscript writing; O.C. contributed to bioinformatic analysis revision, curated results and designed figures; N.P. contributed to in vitro and in vivo experiments; R.R. performed in silico computational predictions and curated results; D.C. contributed to performing in vivo experiments; C.R. contributed to performing biological experiments; F.C. performed immunohistochemistry analysis; R.G. and D.B. performed biophysical experiments; S. Alcaro supervised structural predictive analyses; A.R. supervised the biophysical analysis; P. Tagliaferri edited and reviewed the manuscript by providing critical feedback; F.I. conceived the prioritization pipeline, designed and supervised bioinformatic analyses, wrote and edited the manuscript, and contributed to overall study supervision; and P. Tassone supervised the study and supervised manuscript writing and editing; and all authors read and approved the final manuscript.
Conflict-of-interest disclosure: F.I. receives funds from Open Targets, a public-private initiative involving academia and industry, and performs consultancy for the Cancer Research Horizons–AstraZeneca Functional Genomics Centre and Mosaic Therapeutics. The remaining authors declare no competing financial interests.
Correspondence: Francesco Iorio, Computational Biology Research Centre, Human Technopole, Viale Rita Levi Montalcini, 1, 20157 Milan, Italy; email: francesco.iorio@fht.org; and Pierfrancesco Tassone, Dipartimento di Medicina Sperimentale e Clinica, Università Magna Græcia di Catanzaro, Viale Europa, 88100 Catanzaro, Italy; email: tassone@unicz.it.
References
Author notes
F.I. and P.T. are joint senior authors and contributed equally to this study.
The CRISPR-screen data are available, at different levels of preprocessing, alongside the data underlying the differential expression analysis and the data-intensive figures on FigShare (https://doi.org/10.6084/m9.figshare.23576214).
Raw and processed RNA-sequencing data are available on Gene Expression Omnibus (https://www.ncbi.nlm.nih.gov/geo/) with accession number GSE273796.
The bioinformatic code reproducing results and figures is available at https://github.com/0774v10/MM-CRISPR-lncRNA.
The online version of this article contains a data supplement.
There is a Blood Commentary on this article in this issue.
The publication costs of this article were defrayed in part by page charge payment. Therefore, and solely to indicate this fact, this article is hereby marked “advertisement” in accordance with 18 USC section 1734.

![lncRNA dropout CRISPR-Cas9 screen in MM cell lines. (A) Schematic representation of the CRISPR screening pipeline. (B) Spearman's correlation between pgRNA read count profiles (from DNA collected 30 days after transduction and selection of the library) across screen replicates = 0.85 and 0.88, respectively, for AMO-1 and ABZB, with color bars on top/left indicating cluster membership obtained via hierarchical clustering (complete distance method). (C) Representation of pgRNA abundance log fold changes (logFCs) in DNA collected 30 days after library transduction and selection vs plasmidic amounts for 3 groups of pgRNAs: nontargeting (negative controls [median logFC = 0.27 and 0.35, respectively, for AMO-1 and ABZB]), targeting ribosomal protein genes (control essential genes, median logFC = −0.68 and −0.43, with a logFC ≤−0.5, corresponding to a MAGeCK FDR ≤20%), and lncRNAs, across the 2 screens. Each point represents 1 of the 12 472 pgRNAs in the library with coordinates on the y-axis indicating the median logFC across screen replicates. (D) Gene-wise MAGeCK robust rank aggregation (RRA) scores for significant dependencies identified in the 2 screens at an FDR ≤20%. Top essential control genes, dependencies that are private to each cell line and shared across them (as per the color scheme) are highligted. (E) Number of significantly essential lncRNAs (at an FDR ≤20%) in the 2 screened cell lines and their overlap. MOI, multiplicity of infection.](https://ash.silverchair-cdn.com/ash/content_public/journal/blood/144/16/10.1182_blood.2023021991/3/m_blood_bld-2023-021991-gr1.jpeg?Expires=1769342537&Signature=ILjd8Nq3s94nxuQf1IOHPxODVh0ruYh-2F8ekcDa~N4M1thFZFjydteF5o0eOXky9KRItnBzNSRBkoeQRrXmrKuv71yjeLT4ERtPQrQxh99POZ7W3Fr~2y7HVn4lfaFRqd-XG6ocWniQSRjVIP5jc7mIV7Q6y60YJyjl6U5s7TBtrYKTKqWxcHC0QCFisT3fmLwlEHJ~drtvIbcmh7HoSDUSOhxQNC1iozCbf~QNIF72s9F31VlDvsFG-h5-osnpHr2aCaySLI4dkVqgaMmqmAyKVE8ZFqY7ySGDUScRIa7rbfzyFp~t8LodvDVx0ByvbSmFdQaDlTTqOoz4a7R-3A__&Key-Pair-Id=APKAIE5G5CRDK6RD3PGA)


![lncRNA dropout CRISPR-Cas9 screen in MM cell lines. (A) Schematic representation of the CRISPR screening pipeline. (B) Spearman's correlation between pgRNA read count profiles (from DNA collected 30 days after transduction and selection of the library) across screen replicates = 0.85 and 0.88, respectively, for AMO-1 and ABZB, with color bars on top/left indicating cluster membership obtained via hierarchical clustering (complete distance method). (C) Representation of pgRNA abundance log fold changes (logFCs) in DNA collected 30 days after library transduction and selection vs plasmidic amounts for 3 groups of pgRNAs: nontargeting (negative controls [median logFC = 0.27 and 0.35, respectively, for AMO-1 and ABZB]), targeting ribosomal protein genes (control essential genes, median logFC = −0.68 and −0.43, with a logFC ≤−0.5, corresponding to a MAGeCK FDR ≤20%), and lncRNAs, across the 2 screens. Each point represents 1 of the 12 472 pgRNAs in the library with coordinates on the y-axis indicating the median logFC across screen replicates. (D) Gene-wise MAGeCK robust rank aggregation (RRA) scores for significant dependencies identified in the 2 screens at an FDR ≤20%. Top essential control genes, dependencies that are private to each cell line and shared across them (as per the color scheme) are highligted. (E) Number of significantly essential lncRNAs (at an FDR ≤20%) in the 2 screened cell lines and their overlap. MOI, multiplicity of infection.](https://ash.silverchair-cdn.com/ash/content_public/journal/blood/144/16/10.1182_blood.2023021991/3/m_blood_bld-2023-021991-gr1.jpeg?Expires=1769542211&Signature=oK4V97NqArHz~6t54R4Lgo4lECTMOuPR7gUsIq1EcWz7tL8NpGYr7k6apDmSJldjnopYgNraik9whPpNN0L02Frgu18sVZRvGiKB2t7iiIb~aLzrAHiGlJTnR1qdGTGssYkJP7km3OYEBRZnci7fSrgXCvNT0VNczgrKBJ93M3dl~i28kwZaFkmPinsRqtnp~Aq2nVnPERNzEBDcoddKNnZN-o093-IqKENYp1towIJyNo0dQ6aj4ANlNOLBiEMkamICxsPVnH0pxhP029MVKOSioYaMAlH3lYs0kqNNPpxIn6Q2D-d~ro4mTsJwsXgSHWFJEYnil0abgaTcAe0EmQ__&Key-Pair-Id=APKAIE5G5CRDK6RD3PGA)
![RP11-350G8.5 putative oncogenic role: in vitro validation and preliminary data from in vivo models. (A) Flow cytometric monitoring of GFP expression in ABZB cells transduced with a SCRAMBLE-GFP-CRISPR negative control vector, an RPL8/KO-GFP-CRISPR positive control vector (selected from Project Score [37]), and 2 GFP-CRISPR constructs encoding for 2 pgRNAs targeting RP11-350G8.5. Gray curves represent the percentage of viable cells at day 0 (48 hours after lentiviral transduction), while colored curves represent the percentage of viable cells at day 20. Bars on the right represent the fold change in percentage of GFP-expressing cells 20 days after target depletion against day 0. (B) Evaluation of IL-6R RNA expression level through quantitative real time PCR (qRT-PCR) on ABZB after transduction with SCRAMBLE vector or KO of RP11-350G8.5 with pgRNA#1 or pgRNA#2 or with a vector overexpressing RP11-350G8.5 (UP). (Data are normalized to the expression of GAPDH.) Statistics were obtained using multiple t-tests, resulting in no significant (ns) differences, as per the reported P values. (C) Flow cytometric monitoring of GFP in JJN.3 and NCI-H929 MM transduced cells, and percentage of GFP-positive cells is reported by overlapping curves referred to day 20 (colored curves) against day 0 (light gray curves). (D) Validation of RP11-350G8.5 KO in nontumoral cells, performed as described for A and C. (E) Representative images of RNA-FISH analysis. Nuclei are counterstained with DAPI (blue signal), whereas C3-fluorescein–conjugated GAPDH (green signal) has been used as cytoplasmic marker. Customly designed Stellaris probes targeting RP11-350G8.5 have been conjugated with 5-carboxytetramethylrhodamine (TAMRA) dye (red signal). Representative pictures acquired with a DMI6000-AF6000 Leica (Wetzlar, Germany) fluorescence microscope at magnification ×63 are reported, followed by specific regions of interest (ROIs), which are represented as enlarged images. (F) Dose-response curves 24 hours after treatment with bortezomib in AMO-1 cells overexpressing RP11-350G8.5 (1-10 nM). Statistics were analyzed using multiple t-tests (cutoff ∗P < .05, ∗∗P < .01). (G) In vivo imaging of engrafted ABZB cells. A total of 5 × 10⁶ ABZB cells, which previously underwent highly efficient transduction (multiplicity of infection = 1) of RP11-350G8.5 KO-GFP or the SCRAMBLE vectors, were subcutaneously inoculated in mice (n = 2 per group). Images of tumors were acquired when the tumoral masses became palpable (identified as DAY 1), and at the end of the experiment (DAY 16, when tumors reached 2 cm in diameter). Both DAY 1 and DAY 16 were set up by considering SCRAMBLE mice, because SCRAMBLE cells have been faster to generate tumoral masses, due to their higher proliferative rate, and to grow up to 2 cm in diameter, with respect to KO cells. Tumors appear as yellow high-density signals on the right flank of the mice. Pictures were obtained with the IVIS (Perkin Elmer) system. (H) Tumor growth as mean measurement ± standard deviation (SD) across mice groups (n = 2). (I) Photographs of excised tumors were captured by a digital camera. (J) Weights of excised tumors, reported as mean ± SD across mice groups. Statistics were analyzed using multiple t-tests (cutoff: ∗P < .05).](https://ash.silverchair-cdn.com/ash/content_public/journal/blood/144/16/10.1182_blood.2023021991/3/m_blood_bld-2023-021991-gr4ej.jpeg?Expires=1769542211&Signature=JYHJAMnUDJWvGFY4KDDHoiZZ7WLhaywiDdmPBvoTWg5KSMTyx53YLUxNDq0TOCZEJMsv6KYT6mwI8SJw~0aKV6XwgaBVTkBwZQ5HZtMacH266q-qcF799Ud3aB4Ukv7O55eF8N-NI16qTQ4ohv4G-8PWp4LrETuG2-hw7ceZAG4IumjaD9SZlNo73Sr90nVYd8FVfbMq~jgSpZLDE07EaPs32vHotLYBRcK~M1yhbi3WbdFZCzeQRrSG6qsmZ7cErb3lKNP9Dmlvk~JSwo~2S3Bi5PQXy79L3jIbQvsV-xxM6TAMoPkp8~De3dbtMtum2B18oDwkGJYXDDWP1Yo5yQ__&Key-Pair-Id=APKAIE5G5CRDK6RD3PGA)
