Key Points
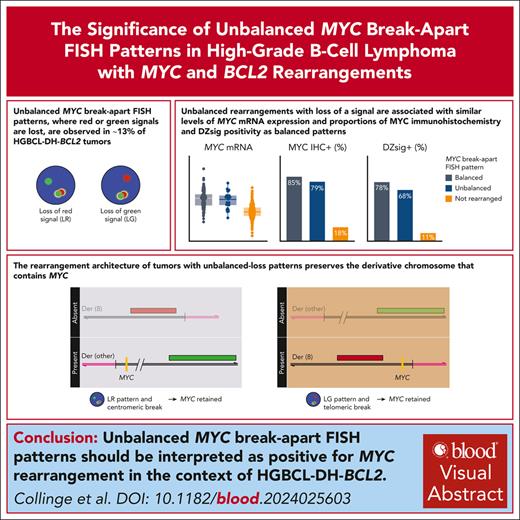
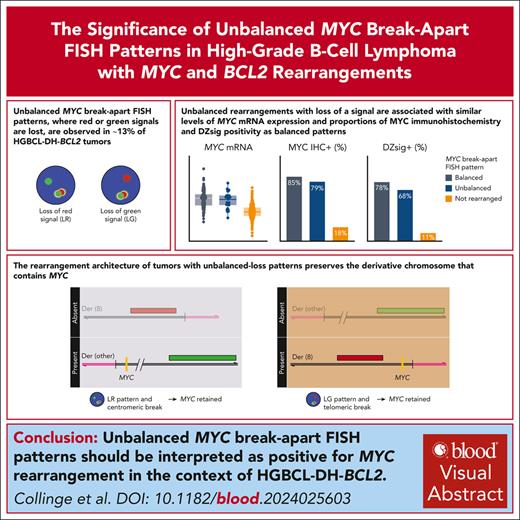
Unbalanced MYC break-apart FISH patterns, in which red or green signal is lost, are observed in ∼13% of HGBCL-DH-BCL2 tumors.
Balanced and unbalanced MYC rearrangements have the same biological consequences and should be reported as positive for rearrangement.
Visual Abstract
Fluorescence in situ hybridization (FISH) using break-apart probes is recommended for identifying high-grade B-cell lymphoma with MYC and BCL2 rearrangements (HGBCL-DH-BCL2). Unbalanced MYC break-apart patterns, in which the red or green signal is lost, are commonly reported as an equivocal result by clinical laboratories. In a cohort of 297 HGBCL-DH-BCL2, 13% of tumors had unbalanced MYC break-apart patterns with loss of red (LR; 2%) or loss of green (LG; 11%) signal. To determine the significance of these patterns, MYC rearrangements were characterized by sequencing in 130 HGBCL-DH-BCL2, including 3 LR and 14 LG tumors. A MYC rearrangement was identified for 71% of tumors with LR or LG patterns, with the majority involving immunoglobulin loci or other recurrent MYC rearrangement partners. The architecture of these rearrangements consistently preserved the rearranged MYC allele, with the MYC gene predicted to be on the derivative chromosome containing the signal that is still present in nearly all cases. MYC protein expression, MYC messenger RNA expression, and the proportion of tumors expressing the dark-zone signature was not significantly different between balanced and unbalanced groups. These results support a recommendation that unbalanced MYC break-apart FISH patterns be reported as positive for MYC rearrangement in the context of diagnosing HGBCL-DH-BCL2.
Introduction
Tumors with diffuse large B-cell lymphoma (DLBCL) or high-grade morphology that harbor MYC and BCL2 rearrangements (high-grade B-cell lymphoma with MYC and BCL2 rearrangements [HGBCL-DH-BCL2]) are recognized as a distinct diagnostic entity.1,2 HGBCL-DH-BCL2 are universally of germinal center B-cell–like (GCB) cell of origin (COO) and typically express a “dark-zone” gene expression signature (DZsig), reflecting shared biology with the physiological dark-zone B cells of the germinal center.3-5 As a group, HGBCL-DH-BCL2 are associated with poor outcomes after R-CHOP (rituximab, cyclophosphamide, doxorubicin, vincristine, and prednisone) immunochemotherapy,6 leading many centers to use escalated treatment regimens in these patients.
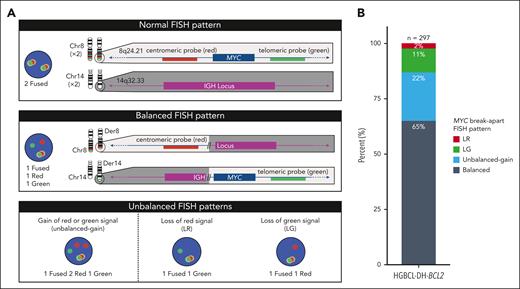
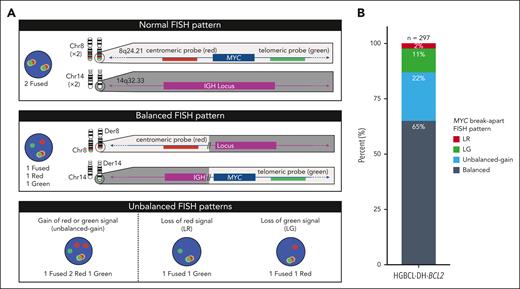
Diagnosing HGBCL-DH-BCL2 requires accurate detection of MYC rearrangements. In approximately half of HGBCL-DH-BCL2 tumors, MYC is rearranged to an immunoglobulin locus (IGH, IGL, or IGK), whereas a range of nonimmunoglobulin (non-IG) rearrangement partners are observed in the remaining tumors.7,8 Rearrangements with IG or recurrent non-IG partners (BCL6 and PAX5) lead to elevated MYC expression, although other non-IG partners have less clear biological consequences.9,10 Due to the diversity of potential MYC rearrangement partners, fluorescence in situ hybridization (FISH) using break-apart probes is recommended for detecting MYC rearrangements.11 Typical MYC break-apart probes include red and green probes, which hybridize to regions centromeric and telomeric to MYC, respectively. When the MYC locus is intact, fused signals are observed, whereas a rearrangement of the MYC locus results in separation of probe signals (Figure 1A). Although balanced MYC break-apart patterns (equal numbers of break-apart probe signals) are widely interpreted as evidence of MYC rearrangement, the significance of unbalanced patterns is less clear. This is particularly true when a break-apart signal is lost, as such patterns raise the possibility that a region of the MYC locus is deleted rather than rearranged. A recent survey found that over half of laboratories reported unbalanced FISH patterns as being equivocal for MYC rearrangement, and a small proportion reported them as being negative.12
Patterns of MYC break-apart FISH probe signals and their proportions in HGBCL-DH-BCL2. (A) Representative MYC break-apart FISH patterns. When the MYC locus is undisturbed, the red (centromeric) and green (telomeric) signals are in close proximity and produce a fused signal. An example of a rearrangement producing a balanced break-apart pattern is depicted using MYC and IGH as example loci. (B) Frequency of break-apart FISH patterns observed in 297 HGBCL-DH-BCL2 tumors. Balanced represents equal number of break-apart probe signals, whereas unbalanced gain indicates that both red and green break-apart signals are present but not equal in numbers.
Patterns of MYC break-apart FISH probe signals and their proportions in HGBCL-DH-BCL2. (A) Representative MYC break-apart FISH patterns. When the MYC locus is undisturbed, the red (centromeric) and green (telomeric) signals are in close proximity and produce a fused signal. An example of a rearrangement producing a balanced break-apart pattern is depicted using MYC and IGH as example loci. (B) Frequency of break-apart FISH patterns observed in 297 HGBCL-DH-BCL2 tumors. Balanced represents equal number of break-apart probe signals, whereas unbalanced gain indicates that both red and green break-apart signals are present but not equal in numbers.
Given this uncertainty, along with its impact on diagnostic accuracy and clinical decision-making, the significance of these unbalanced FISH patterns requires clarification. Here, we report the incidence of unbalanced MYC break-apart FISH patterns in HGBCL-DH-BCL2, the architecture of these rearrangements, and the biological consequences, as measured by MYC messenger RNA (mRNA) expression, MYC protein expression, and DZsig status.
Study design
Tumors with DLBCL or high-grade morphology harboring MYC rearrangements, detected by break-apart FISH, were identified in the Lymphoid Cancer Database, BC Cancer. Patterns of MYC rearrangements were defined as follows: (1) balanced, representing equal number of break-apart probe signals; (2) unbalanced gain, red and green break-apart signals both present but not in equal numbers; (3) loss of red (LR), only green break-apart signal(s) present; and (4) loss of green (LG), only red break-apart signal(s) present (Figure 1A; supplemental Figure 1, available on the Blood website). Further analysis was restricted to 297 HGBCL-DH-BCL2 tumors, defined as having one of the above MYC break-apart patterns and a concurrent BCL2 rearrangement detected by FISH (supplemental Table 1).
MYC rearrangement architecture and partner gene were predicted from previously published whole-genome sequencing and/or capture sequencing of 130 tumors9,10,13-17 using Manta18 and GRIDSS2.19 MYC immunohistochemistry (IHC) was performed on 216 biopsies with staining in ≥40% of tumor cells considered positive.20,MYC mRNA expression, COO, and DZsig status were determined for 187 biopsies by digital gene expression profiling using the DLBCL90 assay on the nanoString nCounter platform, as previously described.4 Tumors were assigned into refined COO groups, with COO prioritized over DZsig status for activated B-cell–like (ABC) tumors. GCB and unclassified tumors that were DZsig+ were assigned to the DZsig+ group, whereas DZsig− and DZsigind tumors were assigned to their respective COO subgroups.5 A comparison group of 333 GCB-DLBCL that were negative for MYC rearrangement by break-apart FISH were drawn from a previously described cohort.5 Digital gene expression profiling (DLBCL90 assay) was available for all 333 biopsies, and MYC IHC was available for 262 biopsies (supplemental Table 2). Additional methodological details and further description of the contributing patient cohorts are presented in the supplement. Statistical analyses were performed in R 4.2.2. This study was approved by The University of British Columbia/BC Cancer Research Ethics Board, in accordance with the Declaration of Helsinki.
Results and discussion
A total of 297 HGBCL-DH-BCL2 tumors were identified by MYC and BCL2 break-apart FISH. Balanced MYC break-apart FISH patterns were observed in 65% of tumors, whereas unbalanced patterns were observed in 35% of tumors, comprising 22% unbalanced gain, 11% LG, and 2% LR (Figure 1B). The combined incidence of 13% of tumors with unbalanced-loss patterns (LR or LG) is consistent with the previously reported incidence of 12% in a study that additionally included other MYC rearranged aggressive B-cell lymphoma.21
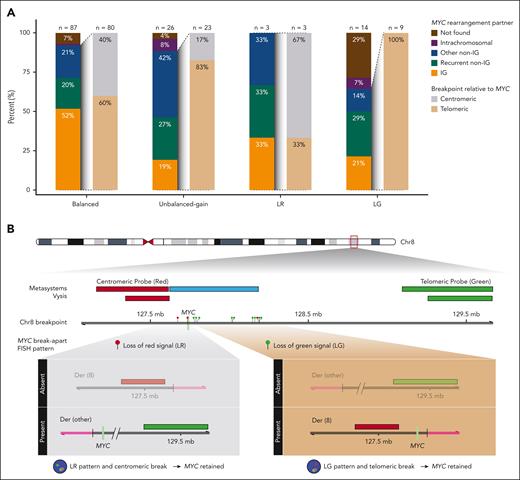
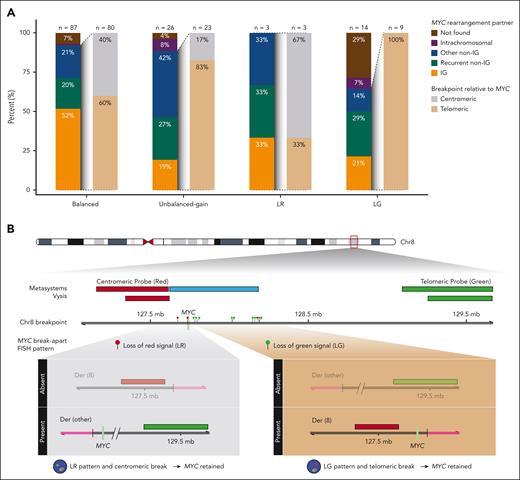
DNA sequencing was available for 130 of 297 HGBCL-DH-BCL2 tumors (44%). A MYC rearrangement partner was identified in 80 of 87 tumors (91%) with a balanced pattern, compared with 23 of 26 tumors (88%) with an unbalanced-gain pattern (P = .69) and 12 of 17 tumors (71%) with an unbalanced-loss pattern (P = .025), including 3 of 3 LR (100%) and 9 of 14 LG patterns (64%; Figure 2A). Notably, for unbalanced-loss patterns in which a MYC rearrangement partner was identified, 9 of 12 (75%) involved an IG or recurrent non-IG partner (BCL6 or PAX5). In comparison, IG and recurrent non-IG partners constituted 62 of 87 identified partners (71%) for balanced patterns and 12 of 23 unbalanced-gain patterns (52%). In summary, although the proportion of identified break points is lower for the unbalanced-loss patterns (71%) relative to the balanced group (91%), a partner locus known to drive MYC expression was identified in most of these tumors.
MYC partner gene and rearrangement architecture in HGBCL-DH-BCL2 according to MYC break-apart FISH pattern. (A) Frequency of MYC rearrangement partners and break points relative to the MYC gene determined in whole-genome and/or capture sequencing. Rearrangement partners are grouped as IG (IGH, IGK, or IGL), recurrent non-IG (BCL6 or PAX5), other non-IG (all other partners), intrachromosomal, or not found. Intrachromosomal rearrangements were defined as structural events involving the MYC locus and another region of chromosome 8 >20kb away. Intragenic breaks occurring in intron 1 of MYC are included in the centromeric group. (B) MYC breakpoint location in tumors with LR and LG patterns, showing that the MYC gene is predicted to be on the derivative chromosome with the signal that is still present in almost all tumors.
MYC partner gene and rearrangement architecture in HGBCL-DH-BCL2 according to MYC break-apart FISH pattern. (A) Frequency of MYC rearrangement partners and break points relative to the MYC gene determined in whole-genome and/or capture sequencing. Rearrangement partners are grouped as IG (IGH, IGK, or IGL), recurrent non-IG (BCL6 or PAX5), other non-IG (all other partners), intrachromosomal, or not found. Intrachromosomal rearrangements were defined as structural events involving the MYC locus and another region of chromosome 8 >20kb away. Intragenic breaks occurring in intron 1 of MYC are included in the centromeric group. (B) MYC breakpoint location in tumors with LR and LG patterns, showing that the MYC gene is predicted to be on the derivative chromosome with the signal that is still present in almost all tumors.
Among tumors with an identified rearrangement partner, the breakpoint was centromeric to MYC in 2 of 3 tumors (67%) with a LR pattern, whereas 9 of 9 tumors (100%) with a LG pattern had a breakpoint telomeric to MYC (Figure 2A-B). For a centromeric break, the resulting rearrangement places MYC on the derivative chromosome containing the green signal, whereas for a telomeric break, MYC is placed on the derivative chromosome containing the red signal (Figure 2B). As such, based on the breakpoint locations and observed FISH signals, the lost signal is expected to be from the derivative chromosome that does not contain MYC for 13 of 14 tumors (93%) with an unbalanced-loss pattern. Thus, the rearrangement architecture of unbalanced-loss patterns preserves the derivative chromosome that contains MYC.
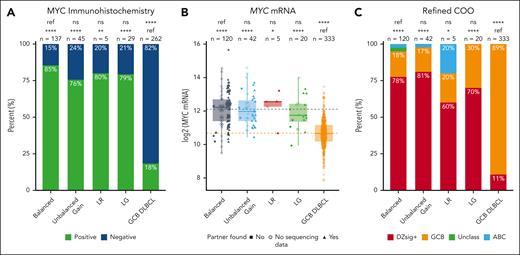
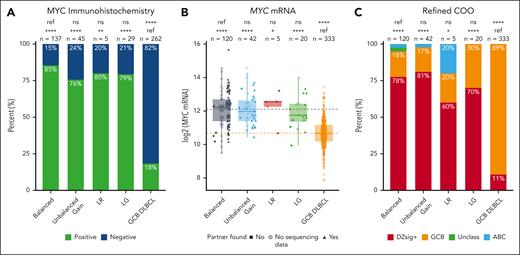
We next determined whether unbalanced patterns were associated with elevated MYC protein and MYC mRNA expression. Among tumors with a balanced pattern, 117 of 137 (85%) were positive for MYC protein expression by IHC (Figure 3A). There was no significant difference in the proportion of tumors positive by MYC IHC among LR (4/5 [80%]; P = .56), LG (23/29 [79%]; P = .41), and unbalanced-gain patterns (34/45 [76%]; P = .17) compared with tumors with a balanced pattern. In contrast, the proportion of tumors positive by MYC IHC was significantly greater for all 4 break-apart patterns (balanced, P < .0001; unbalanced gain, P < .0001; LR, P = .006; LG, P < .0001) compared with MYC break-apart FISH negative GCB-DLBCL (48/262 [18%]). The 15% rate of MYC IHC negativity in tumors with balanced MYC rearrangements strongly suggests that MYC IHC should not be used as an ancillary method for confirming the presence of a productive MYC rearrangement. Mechanisms that confer false negative MYC IHC have been described, including polymorphisms and mutations in the gene.22
Impact of MYC break-apart FISH patterns on MYC and DZsig expression. (A) Proportion of tumors positive for MYC protein expression by IHC. P values are from Fisher exact tests. (B) MYC mRNA expression, as determined by digital gene expression profiling. P values are from t tests. Dotted lines indicate the mean MYC mRNA expression for the balanced (gray) and GCB DLBCL (orange) groups. (C) Proportion of tumors positive for DZsig, as determined by the DLBCL90 assay. P values are from χ2 tests. ∗P < .05; ∗∗P < .01; ∗∗∗P < .001; ∗∗∗∗P < .0001. ns, not significant; ref, reference group.
Impact of MYC break-apart FISH patterns on MYC and DZsig expression. (A) Proportion of tumors positive for MYC protein expression by IHC. P values are from Fisher exact tests. (B) MYC mRNA expression, as determined by digital gene expression profiling. P values are from t tests. Dotted lines indicate the mean MYC mRNA expression for the balanced (gray) and GCB DLBCL (orange) groups. (C) Proportion of tumors positive for DZsig, as determined by the DLBCL90 assay. P values are from χ2 tests. ∗P < .05; ∗∗P < .01; ∗∗∗P < .001; ∗∗∗∗P < .0001. ns, not significant; ref, reference group.
There was similarly no significant difference in the level of MYC mRNA expression between tumors with a balanced and unbalanced patterns (unbalanced gain, P = .97; LR, P = .76; LG, P = .43). In contrast, all 4 break-apart patterns were associated with significantly higher MYC mRNA expression than GCB-DLBCL (balanced, P < .0001; unbalanced gain, P < .0001; LR, P = .02; LG, P < .0001; Figure 3B). Additionally, the proportion of tumors that were DZsig+ was not significantly different in tumors with balanced FISH patterns (93/120 [78%]) compared with those with unbalanced gain (34/42 [81%]; P = .83), LR (3/5 [60%]; P = .33), and LG (14/20 [70%]; P = .57), whereas a significantly higher proportion of tumors were DZsig+ in all 4 break-apart groups compared with GCB-DLBCL (36/333 [11%]; balanced, P < .0001; unbalanced gain, P < .0001; LR, P = .01; LG, P < .0001; Figure 3C).
Although this is a large study of HGBCL-DH-BCL2, tumors with unbalanced-loss FISH patterns are uncommon and the number of these tumors profiled is still modest. However, in aggregate, these analyses show that most HGBCL-DH-BCL2 tumors with unbalanced MYC break-apart FISH patterns are predicted to have rearrangements that preserve the MYC gene and involve recurrent partner loci known to drive constitutive MYC expression. Accordingly, unbalanced FISH patterns were associated with similar biological consequences as balanced patterns, assessed by MYC protein, MYC mRNA, and DZsig expression. Although dual-fusion FISH for MYC and the IG loci could be performed to identify the presence of a MYC::IG rearrangement, which additionally has prognostic signficance,8 a negative result would not exclude rearrangement with a non-IG partner, which is common in HGBCL-DH-BCL2. Ideally, corroboration could be provided by a GCB COO, DZsig positivity, and elevated MYC mRNA levels, but methods to provide these molecular results are not currently in widespread use. Therefore, in the routine practice setting, we recommend that unbalanced MYC break-apart FISH patterns be reported and interpreted as positive for MYC rearrangement in the context of diagnosing HGBCL-DH-BCL2.
Acknowledgments
This study was supported by the Canadian Cancer Society Research Institute (grants 704848 and 705288), Genome Canada (grants 4108 and 13124), Genome British Columbia (grants 141LYM and 271LYM), the Canadian Institutes of Health Research (grants GPH-129347, GPI-155873, and 300738), the Terry Fox Research Institute (grants 1061 and 1043), the British Columbia Cancer Foundation, and the National Institutes of Health, National Cancer Institute (grant 1P01CA229100). B.C. is supported by a Canada Graduate Scholarships Doctoral program award from the Canadian Institutes of Health Research and a Doctoral Fellowship and from The University of British Columbia. W.A. is supported by the Kuwait Ministry of Health, the Leukemia and Lymphoma Society of Canada/Canadian Institutes of Health Research Clinician Scientist Fellow award, and the Michael Smith Health Research, British Columbia Research Trainee award. D.W.S. is supported by a Michael Smith Foundation for Health Research Health Professional Investigator award (18646).
Authorship
Contribution: B.C., S.B.-N., and D.W.S. conceived and designed the study; B.C., S.B.-N., L.K.H., W.A., T.T., G.W.S., P.F., J.W.C., M.B., B.M., and D.W.S. performed the research and analyzed data; B.C. and L.K.H. performed statistical analysis; D.V., A.S.G., L.H.S., and K.J.S. participated in the collection and analysis of clinical data; R.D.M., A.J.M., and C.S. collected and analyzed molecular data; B.C. and D.W.S. wrote the manuscript; and all authors edited and approved the final version of the manuscript.
Conflict-of-interest disclosure: T.T. has received honoraria from AstraZeneca and Merck and research funding from Pfizer. J.W.C. has provided consultancy/expert testimony for Bayer and received honoraria from BeiGene. D.V. reports consulting/honoraria from AbbVie, AstraZeneca, BeiGene, Bristol Myers Squibb (BMS)/Celgene, Gilead/Kite, Incyte, Janssen, Merck, Roche, and ZetaGene and research funding (to the institution) from AstraZeneca and Roche. A.S.G. reports consultancy/honoraria from AbbVie, AstraZeneca, BeiGene, and Janssen and research funding (to the institution) from AbbVie, AstraZeneca, Janssen, and Roche. L.H.S. reports consulting/honoraria from AbbVie, Amgen, AstraZeneca, BeiGene, BMS/Celgene, Genmab, Kite/Gilead, Incyte, Janssen, Merck, Seagen, and Roche/Genentech and research funding from Roche/Genentech and Teva. K.J.S. reports honoraria/consulting fees from BMS, Merck, Seagen, and AbbVie; research funding from BMS; and has served on the drug safety monitoring committee for Regeneron. C.S. has performed consultancy for Bayer and Eisai and has received research funding from Epizyme and Trillium Therapeutics. D.W.S. has received honoraria from AbbVie, AstraZeneca, Genmab, Roche, and Veracyte; research funding from Roche/Genentech; and is an inventor on patents describing the use of gene expression to subtype aggressive B-cell lymphomas, one of which is licensed to NanoString Technologies. The remaining authors declare no competing financial interests.
Correspondence: David W. Scott, BC Cancer Research Institute, 675 West 10th Ave, Vancouver, BC V5Z 1L3, Canada; email: dscott8@bccancer.bc.ca.
References
Author notes
B.C. and S.B.-N. contributed equally to this study.
All DNA sequencing data has been previously published and is deposited in the European Genome-Phenome Archive (accession numbers EGAD00001004142, EGAD00001006087, EGAS00001007053, EGAS50000000328, EGAD00001002897) or the database of Genotypes and Phenotypes (accession number phs000532.v18.p6).9,10,13-17 A summary of all sequencing data with associated publications and accession numbers is available in supplemental Table 3.
The online version of this article contains a data supplement.
There is a Blood Commentary on this article in this issue.
The publication costs of this article were defrayed in part by page charge payment. Therefore, and solely to indicate this fact, this article is hereby marked “advertisement” in accordance with 18 USC section 1734.

