Key Points
Normal HSCs under physioxia exhibit upregulation of self-renewal genes and downregulation of genes involved in inflammatory pathways.
Reduced Tet2 activity contributes to the enhanced HSC functions under physioxia.

Abstract
Hematopoietic stem cells (HSCs) manifest impaired recovery and self-renewal with a concomitant increase in differentiation when exposed to ambient air as opposed to physioxia. Mechanism(s) behind this distinction are poorly understood but have the potential to improve stem cell transplantation. Single-cell RNA sequencing of HSCs in physioxia revealed upregulation of HSC self-renewal genes and downregulation of genes involved in inflammatory pathways and HSC differentiation. HSCs under physioxia also exhibited downregulation of the epigenetic modifier Tet2. Tet2 is α-ketoglutarate, iron- and oxygen-dependent dioxygenase that converts 5-methylcytosine to 5-hydroxymethylcytosine, thereby promoting active transcription. We evaluated whether loss of Tet2 affects the number and function of HSCs and hematopoietic progenitor cells (HPCs) under physioxia and ambient air. In contrast to wild-type HSCs (WT HSCs), a complete nonresponsiveness of Tet2−/− HSCs and HPCs to changes in oxygen tension was observed. Unlike WT HSCs, Tet2−/− HSCs and HPCs exhibited similar numbers and function in either physioxia or ambient air. The lack of response to changes in oxygen tension in Tet2−/− HSCs was associated with similar changes in self-renewal and quiescence genes among WT HSC-physioxia, Tet2−/− HSC-physioxia and Tet2−/− HSC-air. We define a novel molecular program involving Tet2 in regulating HSCs under physioxia.
Introduction
HSCs generate all mature blood cells and reproduce themselves in a still relatively poorly understood process of self-renewal.1,2 HSCs reside in a bone marrow (BM) microenvironment with distinctive low oxygen tension.3 In contrast to the physiological status of HSCs in the BM (∼1% to 5% O2), almost all ex vivo HSC studies have been conducted by collecting and processing BM in ambient air with extraphysiologic oxygen tension (∼21% O2 compared with 1%-5% O2 tension in BM). We previously reported a novel method of collecting and processing higher numbers of young and aging mouse BM, mobilized peripheral blood (PB) and human cord blood HSCs under physioxia.4-6 Our previous work evaluating normal mouse BM revealed a significant loss in the number and function of HSCs upon exposure to extraphysiologic oxygen shock/stress in ambient air. HSCs collected and processed under physioxia demonstrate higher engraftment and self-repopulating capacity than HSCs collected and processed under ambient air. The exposure to ambient air and sudden oxygenation induces rapid differentiation of HSCs to multipotent and committed hematopoietic progenitor cells (HPCs).4 However, the mechanisms that dictate these changes are still unclear.
Throughout life, HSCs accumulate somatic mutations at a rate that increases with age.7 Although most of the acquired mutations are insignificant, rare mutations in HSCs enhance self-renewal and outcompete unaffected HSC clones over time. The most prevalent somatic mutations include genes encoding epigenetic modifiers, such as DNA (cytosine-5)-methyltransferase 3A (DNMT3A) and Ten-eleven translocation dioxygenase 2 (TET2) or Additional sex combs like 1 (ASXL1) mutation.8 HSCs and HPCs with such driver mutations are commonly considered preleukemic as they have the potential to accumulate second-hit somatic mutations and progress to full-blown myeloid malignancies.9-11 Evaluation of Tet2 mutation in the BM of knockout mouse model (Tet2−/−) revealed an increase in Lin−Sca-1+c-Kit+ (LSK) cells and enhanced engraftment capacity compared with WT LSK cells.12,13
TET family proteins are α-KG, iron- and oxygen-dependent epigenetic modifiers that catalyze the oxidation of 5-methylcytosine to 5-hydroxymethylcytosine (5-hmC).14-18 Growing evidence suggests a regulatory interaction of TET enzymes and oxygen-sensing pathways in a variety of cell types and oxygen tensions.19-21 In this regard, TET expression and activity is likely to vary according to the cell type and oxygen availability. Under low oxygen conditions, TET might function as an adaptation mechanism to promote cell survival and differentiation. TET1 is upregulated under hypoxia, leading to accumulation of 5-hmC and facilitation of hypoxia-inducible factor (HIF-1α) binding to hypoxia-responsive genes in neuroblastoma.22 In breast tumor cells, HIF-1α enhances TET1 and TET3 expression, resulting in increased 5-hmC levels under low oxygen tension.23 In erythroid cells, HIF-1α upregulates TET3 expression and induces erythroid gene expression in hypoxic conditions.24 Intriguingly, TET enzyme activity can also be inhibited under hypoxic conditions. For instance, hypoxia suppresses TET activity in many mouse and human cell lines, leading to a 5-hmC reduction and hypermethylation of tumor suppressor gene promotors and enhancers, contributing to tumor progression and growth advantage.25 Although there is significant disparity with regards to how low oxygen tension regulates TET expression and activity, it is clear that the role of Tet2 in physioxic condition in regulating WT or mutant preleukemic HSCs remains unknown. In the present study, we demonstrate an essential role for Tet2 in regulating the enhanced self-renewal of HSCs under conditions of physioxia.
Methods
Mice
C57BL/6J mice (CD45.2), Tet2-deficient mice (Tet2−/−, CD45.2),12 competitor Boy/J (CD45.1) mice, and recipient B6xBoy/J F1 (F1; dual CD45.2/CD45.1) mice were used for BM collection and transplantation studies. C57BL/6J, Boy/J, and B6xBoy/J F1 mice were obtained from the In Vivo Therapeutics Core facility at Indiana University School of Medicine. Mice husbandry and care were performed under 21°C to 24°C temperatures and 12-hour light, 12-hour dark cycles; group housed according to age, sex, and genotype; and fed ad libitum. C57Bl/6J and Tet2−/− mice were 3 to 4 months of age when used. Boy/J (CD45.1) and B6xBoy/J F1 (F1; dual CD45.2/CD45.1) mice were 8 to 10 weeks of age when used for experiments. Both male and female mice were used; we did not observe any difference in function or phenotypes between males and females. All experiments were approved by the Institutional Animal Care and Use Committee at Indiana University School of Medicine.
BM cell collection and processing
BM cell collection was conducted in a hypoxia chamber, maintained at 3% O2, 5% CO2, and N2 balance. All reagents and supplies were equilibrated in the hypoxia chamber for at least 18 hours before cell harvest.4 BM harvest was performed by flushing femurs diaphysis with ice-cold phosphate-buffered saline/2% fetal bovine serum and crushed epiphysis, resuspending cells into single-cell suspension, and filtering the cells in a 40 μm cell strainer. Flow cytometry staining and fixation, HPC colony assays, and intravenous injections for in vivo transplantation were conducted in the hypoxia chamber for the 3% O2 physiologic oxygen (physioxia) groups. For ambient air control groups, half of the cells were immediately removed from the hypoxia chamber to acclimate in ambient air (∼21% O2) for 1 to 6 hours before applying equivalent techniques. Colony-forming unit assays cells were incubated at 5% O2 and 5% CO2 for both physioxia and ambient air collected groups as this enhances the detection of optimal growth of granulocyte macrophage colony-forming unit (CFU-GM), erythrocyte burst-forming units (BFU-E), and granulocyte, erythrocyte, macrophage, and megakaryocyte colony-forming unit (CFU-GEMM) colonies.26
Additional methods
Additional methods including Cellular Indexing of Transcriptomes and Epitopes by Sequencing (CITE-seq), bulk RNA sequencing (bulk RNA-seq), flow cytometry immunophenotyping, colony forming unit HPC assays, transplantation assays, 5-hmC levels, and statistical methods are provided in supplemental Methods (available on the Blood Web site).
Results
HSCs in physioxia exhibit increased expression of HSC self-renewal genes and reduced expression of Tet2
To explore the potential molecular pathways that regulate the response of HSCs to physioxia, we conducted a CITE-seq experiment. HSC sorting and sequencing in physioxia is not feasible using conventional methods as flow cytometry sorting operates in ambient air. We therefore used CITE-seq as an alternative method to retrospectively sort HSCs and (multipotent progenitors) MPPs based on their defined surface proteins.27 We enriched LSK cells in physioxia and ambient air and then stained LSK cells with a panel of barcoded Total-seq-A antibodies, including antibodies against surface proteins c-Kit, Sca-1, CD150, CD48, and CD135. The LSK cells consist of both HSCs as well as more committed progenitors, such as MPPs. All biological samples were hashed and pooled in equal numbers into 2 groups, ambient air and physioxia. CITE-seq data of labeled cells was further collected using 10X Genomics Chromium system27,28 (supplemental Methods). CITE-seq data were further analyzed to identify the functional changes in HSCs under physioxia vs ambient air (Figure 1A).
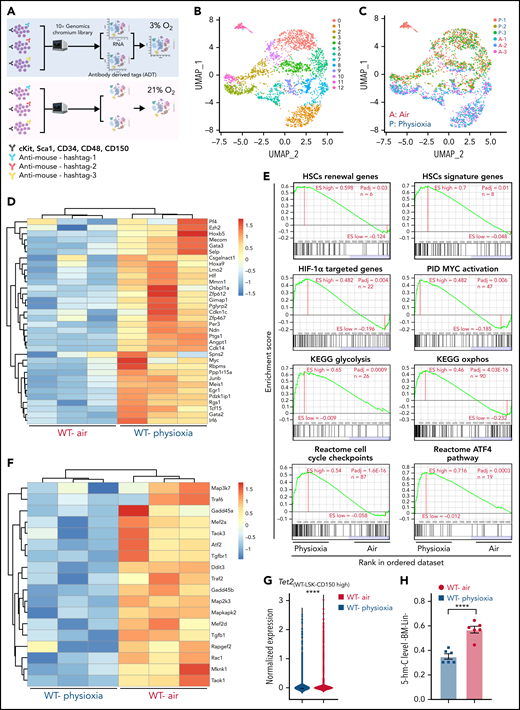
Altered gene expression profiles in HSCs derived from physioxia and ambient air exposure as assessed by CITE-seq analysis. Three biological replicates are analyzed. (A) CITE-seq and cell hashing workflow under physioxia and ambient air. (B) UMAP of CITE-seq data colored by computationally predicted cell clusters. LSK cell types can be discerned by their surface protein marker expression profiles: (1) CD150-CD117-air, (2) CD150-CD117-physioxia, (3) CD150-CD117-physioxia, (4) CD150-CD117-CD48-physioxia, (5) CD150-CD117-CD48-air, (6) CD150 high-physioxia, (7) CD150 high-air, (8) CD150 very high-physioxia, (9) CD150 very high-air, (10) CD48 high-physioxia, (11) CD48 high-air, (12) CD48 mid-air. (C) UMAP of WT BM CD150hi cells under physioxia and ambient air. (D) Heatmap of averaged expression level of HSC renewal and marker genes in WT CD150hi cells under physioxia and ambient air. (E) GSEA plots of selected differentially expressed pathways in WT CD150hi cells under physioxia and ambient air. (F) Heatmap of averaged expression level and GSEA of genes in the p38 MAPK pathway in WT CD150hi cells under physioxia and ambient air. (G) The violin plots show the normalized expression of Tet2 in WT LSK CD150hi cells under physioxia and ambient air. (H) 5-hmC levels in WT BM Lin− cells under physioxia and ambient air; data are presented as mean ± standard error of the mean. ****P < .0001 when analyze by Wilcoxon rank sum test (G) and Student t test (H). KEGG, Kyoto Encyclopedia of Genes and Genomes; PID, The Pathway Interaction Database; UMAP, Uniform Manifold Approximation and Projection.
Altered gene expression profiles in HSCs derived from physioxia and ambient air exposure as assessed by CITE-seq analysis. Three biological replicates are analyzed. (A) CITE-seq and cell hashing workflow under physioxia and ambient air. (B) UMAP of CITE-seq data colored by computationally predicted cell clusters. LSK cell types can be discerned by their surface protein marker expression profiles: (1) CD150-CD117-air, (2) CD150-CD117-physioxia, (3) CD150-CD117-physioxia, (4) CD150-CD117-CD48-physioxia, (5) CD150-CD117-CD48-air, (6) CD150 high-physioxia, (7) CD150 high-air, (8) CD150 very high-physioxia, (9) CD150 very high-air, (10) CD48 high-physioxia, (11) CD48 high-air, (12) CD48 mid-air. (C) UMAP of WT BM CD150hi cells under physioxia and ambient air. (D) Heatmap of averaged expression level of HSC renewal and marker genes in WT CD150hi cells under physioxia and ambient air. (E) GSEA plots of selected differentially expressed pathways in WT CD150hi cells under physioxia and ambient air. (F) Heatmap of averaged expression level and GSEA of genes in the p38 MAPK pathway in WT CD150hi cells under physioxia and ambient air. (G) The violin plots show the normalized expression of Tet2 in WT LSK CD150hi cells under physioxia and ambient air. (H) 5-hmC levels in WT BM Lin− cells under physioxia and ambient air; data are presented as mean ± standard error of the mean. ****P < .0001 when analyze by Wilcoxon rank sum test (G) and Student t test (H). KEGG, Kyoto Encyclopedia of Genes and Genomes; PID, The Pathway Interaction Database; UMAP, Uniform Manifold Approximation and Projection.
We identified 12 cell clusters based on total-seq antibody capture (Figure 1B). Although the input population for CITE-seq was highly pure for LSK cells, some of the detected cell clusters lacked CD117 or Sca1 expression as these surface proteins might have been bound by the magnetic beads used in the enrichment process. Given that LSK CD150-high subpopulation contains higher numbers of long-term engrafting HSCs,29,30 we investigated the LSK cell clusters expressing high levels of CD150 surface protein (LSK-CD150hi) in order to capture a higher-resolution HSC transcriptome (Figure 1C). Although the number of LSK-CD150hi was comparable under physioxia and ambient air, ambient air samples contained substantially more CD48-expressing cells (supplemental Figure 1A). Given that CD48 is a marker for HPCs rather than HSCs,31 the increased frequency of CD48-expressing cells in ambient air samples suggested greater differentiation of these cells from HSCs to MPPs.
In comparison with LSK-CD150hi cells harvested in air, LSK-CD150hi cells harvested under physioxia exhibited enhanced expression of a number of well-characterized markers of long-term engrafting HSCs, including Slamf1 (supplemental Figure 1B),29,30Tcf15,32Hlf,33,34 and Hoxb535 (Figure 1D). Furthermore, LSK-CD150hi-physioxia cells upregulated genes promoting HSC self-renewal and quiescence via a variety of mechanisms. For instance, LSK-CD150hi-physioxia cells upregulated Meis1, which maintains HSC quiescence and self-renewal by activating Hif-1α and promoting glycolytic metabolism36; Cdkn1c, which maintains HSCs in quiescence by regulating HSCs cell cycle37; and Ndn, which maintains HSC quiescence under steady-state conditions (Figure 1D).38 Other genes that are upregulated in LSK-CD150hi-physioxia cells that are linked to HSC maintenance and self-renewal include Mecom,39Nfya,40Gata3,41Ezh2,42 and Egr143 (Figure 1D).
We next performed single-sample gene set enrichment analysis (ssGSEA) to explore differentially enriched pathways between physioxia and ambient air in LSK-CD150hi cells.44 LSK-CD150hi-physioxia cells showed upregulation in pathways involved in promoting HSC self-renewal and survival, including the Hif-1α–regulated pathway and Myc activation (Figure 1E) (supplemental Table 2). HSCs deficient in HIF-1a demonstrate loss of quiescence and impaired repopulating capability.45 N-Myc and c-Myc both promote HSC self-renewal and survival, whereas c-Myc alone is required for HSC differentiation.46
Although LSK-CD150hi-physioxia cells showed upregulated metabolic programing characteristic of HSCs including anaerobic glycolysis, those cells also upregulated mitochondrial oxidative phosphorylation program (Figure 1E). We believe that the metabolic switch is likely attributed to the prolonged in vitro processing–induced stress and resultant HSC activation47 as observed by the activation of genes involved in regulating cell cycle checkpoints. We also detected upregulation of the ATF4 pathway in LSK-CD150hi-physioxia cells, which likely serves as a prosurvival integrated stress response in HSCs48 (Figure 1E). In contrast, LSK-CD150hi-air cells showed upregulation of several inflammatory and innate immune pathways, including the p38 MAPK (Figure 1F; supplemental Figure 1C) and TNF receptor associated factor 6 (TRAF6)-mediated NF-κB canonical pathway (supplemental Figure 1C; supplemental Table 2). ROS generation via the p38 MAPK pathway and the subsequent exhaustion of stem cells has been described before.49 HSCs expressing some of the p38 MAPK regulated genes such as Gadd45a have been shown to induce stem cell differentiation without affecting their survival.50 Similarly, LSK-CD150hi-air cells showed enhanced expression of genes known to be involved in the differentiation of HSCs into committed progenitors, such as Rock1,51Lmna,52 and Pik3ca53 (supplemental Figure 1D). Additionally, we observed an upregulation of proapoptotic genes in LSK-CD150hi-air cells compared with LSK-CD150hi-physioxia cells, suggesting that HSCs collected and processed in physioxia demonstrate greater survival (supplemental Figure 1E).
Remarkably, while mining the CITE-seq data, we noted a substantial downregulation in the expression of Tet2 in LSK-CD150hi-physioxia cells compared with Tet2 expression in LSK-CD150hi-air cells (Figure 1G). Consistent with reduced expression of Tet2 in LSK-CD150hi-physioxia cells, 5-hmC levels in WT lineage-negative (Lin−) BM cells under physioxia was significantly reduced compared with Lin−WT BM cells under air (Figure 1H). Taken together, these data demonstrate that HSCs under physioxia express a gene profile and molecular signature that is consistent with those associated with increased engraftment and self-renewal of HSCs. Importantly, Tet2 downregulation in HSCs under physioxia, along with a concomitant decrease in 5-hmC levels, suggests that Tet2 may play a role in regulating the enhanced HSC recovery and engraftment under physioxia.
Tet2−/− HSC and HPC numbers are not affected by collection/processing in ambient air
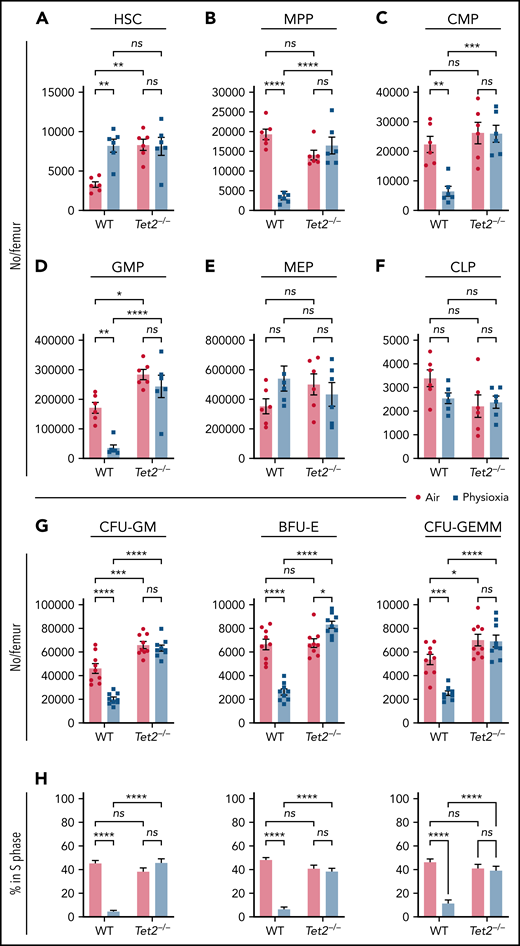
In light of the observed reduction in Tet2 expression in HSCs under physioxia, we evaluated the HSC and HPC content in WT and Tet2−/− mice BM after 1 hour incubation under physioxia and ambient air. WT and Tet2−/− HSCs and HPCs were stained and fixed inside the hypoxia chamber or in ambient air. The stained/fixed cells were analyzed by flow cytometry (supplemental Figure 2A) to determine phenotype. HPCs were plated in supplemented methylcellulose culture medium to assess HPC colony function on day 6. As reported,4,5 recovery of WT HSC-physioxia cells was significantly higher than WT-HSC-air cells (Figure 2A). In contrast, WT MPP, CMP, and GMP numbers were significantly reduced under physioxia condition (Figure 2B-D). MEP and CLP numbers were not statistically different between the 2 groups (Figure 2E-F). Remarkably, Tet2−/− HSCs as well as multipotent and committed progenitor compartments (MPP, MEP, CMP, GMP, and CLPs) were not statistically different regardless of the oxygen tension they were harvested under (Figure 2A-F). In agreement with previous studies,12,13Tet2−/− LSK, HSC, and GMP numbers collected in ambient air were significantly higher than WT (Figure 2A,D) cells. HPC colony assay was conducted on BM cells from WT and Tet2−/− mice (Figure 2G-H). Numbers (Figure 2G) and cycling (Figure 2H) of WT CFU-GM, BFU-E, and CFU-GEMM (percent in S-phase as assessed by high specific activity 3HTdr kill assay) collected and processed in physioxia were significantly reduced compared with the ambient air condition. However, numbers (Figure 2G) and cycling (Figure 2H) of Tet2−/− HPCs were not significantly different between air and physioxia. Thus, in contrast to WT HSCs and HPCs, Tet2−/− HSCs and HPCs show no differences in their numbers or function under either physioxia or ambient air.

Physioxia does not impact the recovery of Tet2−/− HSCs and HPCs. (A-F) A combination of 2 independent experiments is shown; each experiment assessed 3 mice. BM was harvested and processed in a hypoxic chamber (3% O2, 5% CO2, N2) or ambient air (∼21% O2) and analyzed by flow cytometry for HSC and HPC numbers. Numbers of HSCs (A), MPPs (B), CMPs (C), GMPs (D), MEPs (E), and CLPs (F) per femur. (G-H) A combination of 3 independent experiments is shown; each experiment assessed 3 mice. Progenitor cell numbers were analyzed using a functional HPC colony assay examining CFU-GM, BFU-E, and CFU-GEMM number (G) per femur and S-phase percentage (H). Data are presented as mean ± standard error of the mean. *P < .05; **P < .01; ***P < .001; ****P < .0001 when analyzed by 2-way analysis of variance with a post hoc Tukey’s multiple comparison test. CLPs, Common lymphoid progenitors; CMPs, Common myeloid progenitors; GMPs, Granulocyte-macrophage progenitors; MEPs, Megakaryocyte erythrocyte progenitors; ns, not significant.
Physioxia does not impact the recovery of Tet2−/− HSCs and HPCs. (A-F) A combination of 2 independent experiments is shown; each experiment assessed 3 mice. BM was harvested and processed in a hypoxic chamber (3% O2, 5% CO2, N2) or ambient air (∼21% O2) and analyzed by flow cytometry for HSC and HPC numbers. Numbers of HSCs (A), MPPs (B), CMPs (C), GMPs (D), MEPs (E), and CLPs (F) per femur. (G-H) A combination of 3 independent experiments is shown; each experiment assessed 3 mice. Progenitor cell numbers were analyzed using a functional HPC colony assay examining CFU-GM, BFU-E, and CFU-GEMM number (G) per femur and S-phase percentage (H). Data are presented as mean ± standard error of the mean. *P < .05; **P < .01; ***P < .001; ****P < .0001 when analyzed by 2-way analysis of variance with a post hoc Tukey’s multiple comparison test. CLPs, Common lymphoid progenitors; CMPs, Common myeloid progenitors; GMPs, Granulocyte-macrophage progenitors; MEPs, Megakaryocyte erythrocyte progenitors; ns, not significant.
Tet2−/− HSCs functionally behave the same under ambient air and physioxia conditions
To further explore the functional behavior of Tet2−/− HSCs under physioxia, we carried out 2 independent, competitive limiting-dilution experiments to assess engrafting and repopulating capacity of donor WT and Tet2−/− HSCs. Donor chimerism was assessed at months 1 and 2 and in PB and in PB and BM at month 4. BM cells were collected at month 4 for detailed phenotypic analysis. Consistent with previously reported results4,5 and present data (Figure 2), WT HSC-physioxia cells demonstrated significantly enhanced engraftment compared with WT HSC-air cells (Figure 3). However, PB and BM chimerism of Tet2−/− HSCs showed similar engraftment using both physioxia and ambient air-collected and processed cells (Figure 3A-B; supplemental Figure 2B). We performed limiting-dilution engraftment analysis to determine the CRUs and frequency of functional HSCs. CRUs were higher in the WT cells collected and processed in physioxia compared with WT cells collected and processed in air for PB (Figure 3C-D) and for BM (Figure 3E-F) in the engrafted mice. Tet2−/− donor cell engraftment showed modest myeloid lineage bias under air and physioxia compared with WT donor cell engraftment (Figure 3G). WT-physioxia donor cells also showed significantly increased repopulation in lethally irradiated secondary mice at month 4 (Figure 3H), indicating that physioxia-collected and processed cells have enhanced self-renewal capacity compared with cells harvested under ambient air. However, the repopulating capacity of Tet2−/− cells was similar under physioxia and ambient air conditions. Tet2−/− HSC-air cells overall exhibited enhanced engraftment in comparison with WT HSC-air cells. Remarkably, the engraftment of Tet2−/− HSCs and WT HSC-physioxia cells was comparable, reinforcing the idea that physioxia-induced reduction in Tet2 expression in WT HSCs contributes significantly to the enhanced recovery and self-renewal of these cells and that Tet2−/− HSCs are resistant to ambient air extraphysiologic oxygen shock.
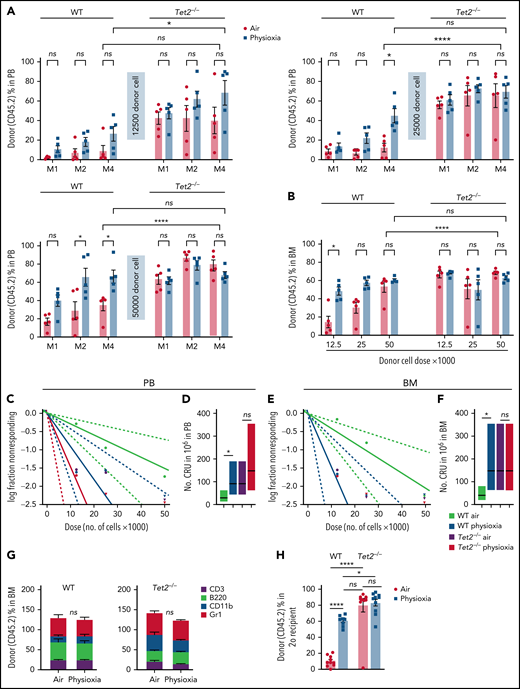
Engraftment of WT and Tet2−/− cells collected and processed in 3% O2 vs ambient air (∼21% O2), assessed by competitive BM transplantation and limiting-dilution analysis. Five recipient mice per group are shown. Donor (CD45.2+) cells were injected intravenously at doses of 12 500, 25 000, and 50 000 cells into lethally irradiated F1 host mice (CD45.1+CD45.2+) in air or physioxia. Competitor Boy/J BM cells (CD45.1+) were injected intravenously at 100 000 cells in air. The percentage of donor-derived cells in the PB was assessed by flow cytometry at months (M) 1, 2, and 4 (A). The percentage of donor-derived cells in the BM was assessed at month 4 (B). Poisson statistical analysis from the limiting-dilution transplantation PB data (C) and BM (E) are shown. Solid line indicates best-fit linear model. Dotted lines represent 95% confidence intervals. Squares represent the percentage of negative mice for each dose. Triangles indicate that all tested mice were positive in this group. Numbers of CRUs in 106 cells in PB (D) and BM (F) are shown. (G) The myeloid (CD11b+ and GR1+)/lymphoid (CD3+ and B220+) ratio in the PB at month 4 was assessed by flow cytometry. Engraftment in secondary recipients at month 4 (H) is shown. Data are presented as mean ± standard error of the mean. *P < .05; ****P < .0001 when analyzed by 2-way analysis of variance with a post hoc Tukey’s multiple comparison test and Poisson statistical analysis. CRUs, competitive repopulating units; ns, not significant.
Engraftment of WT and Tet2−/− cells collected and processed in 3% O2 vs ambient air (∼21% O2), assessed by competitive BM transplantation and limiting-dilution analysis. Five recipient mice per group are shown. Donor (CD45.2+) cells were injected intravenously at doses of 12 500, 25 000, and 50 000 cells into lethally irradiated F1 host mice (CD45.1+CD45.2+) in air or physioxia. Competitor Boy/J BM cells (CD45.1+) were injected intravenously at 100 000 cells in air. The percentage of donor-derived cells in the PB was assessed by flow cytometry at months (M) 1, 2, and 4 (A). The percentage of donor-derived cells in the BM was assessed at month 4 (B). Poisson statistical analysis from the limiting-dilution transplantation PB data (C) and BM (E) are shown. Solid line indicates best-fit linear model. Dotted lines represent 95% confidence intervals. Squares represent the percentage of negative mice for each dose. Triangles indicate that all tested mice were positive in this group. Numbers of CRUs in 106 cells in PB (D) and BM (F) are shown. (G) The myeloid (CD11b+ and GR1+)/lymphoid (CD3+ and B220+) ratio in the PB at month 4 was assessed by flow cytometry. Engraftment in secondary recipients at month 4 (H) is shown. Data are presented as mean ± standard error of the mean. *P < .05; ****P < .0001 when analyzed by 2-way analysis of variance with a post hoc Tukey’s multiple comparison test and Poisson statistical analysis. CRUs, competitive repopulating units; ns, not significant.
Bulk RNA-seq revealed significant transcriptomic changes between physioxia and ambient air in WT LSK cells but a muted response in Tet2−/− LSK cells
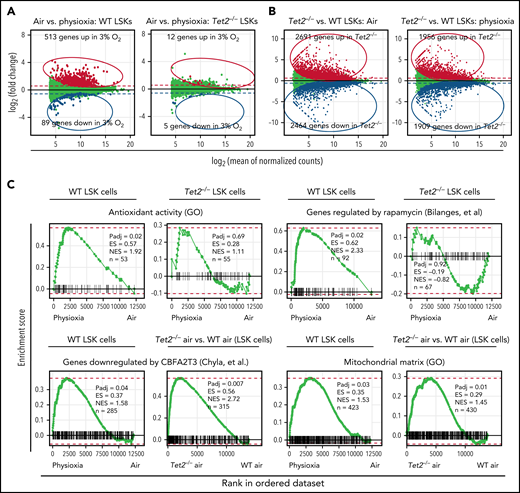
Although the results described above clearly shed light on the critical role of low oxygen tension in regulating genes and pathways associated with highly enriched HSCs, we enriched LSK cells under physioxia and ambient air conditions and performed bulk RNA sequencing to gain a better understanding of the molecular pathways that regulate responses of WT and Tet2−/− HPCs to ambient air. Our analysis revealed that 513 genes were upregulated and 89 genes downregulated in WT LSK-physioxia cells compared with WT LSK-air cells (Figure 4A). In contrast, Tet2−/− LSK cells showed minimal transcriptomic changes between the 2 conditions, with only 12 genes showing upregulation and 5 genes downregulation in Tet2−/− LSK-physioxia cells compared with Tet2−/− LSK-air cells (Figure 4A). Remarkably, the Tet2−/− LSK cell transcriptomic profile was significantly different in comparison with WT LSK cell profile under both physioxia and ambient air (Figure 4B).

Transcriptomic changes in WT and Tet2−/− LSK cells in response to ambient air exposure. Four biological replicates per group. (A) Y-axis shows differential expression (fold change); x-axis shows average normalized expression across all samples. Differential expression values are calculated as physioxia/air (upregulation means gene expression is increased in physioxia compared with ambient air cells; downregulated means gene expression is decreased in physioxia compared with ambient air cells). Red/blue (upregulated/downregulated) points indicate significantly differentially expressed genes (adjusted P < .05). Dashed lines represent a reference point for a ±1.5-fold change in expression on the graph. (B) Y-axis shows differential expression (fold change); x-axis shows average normalized expression across all samples. Differential expression values are calculated as Tet2−/−/WT (upregulation means upregulated by Tet2−/−; downregulated means downregulated by Tet2−/−). Red/blue (upregulated/downregulated) points indicate significantly differentially expressed genes (adjusted P < .05). Dashed lines represent a reference point for a ±1.5-fold change in expression on the graph. (C) Fast gene set enrichment analysis (FGSEA) is shown for differential expression analysis comparing physioxia isolation to ambient air exposure. ES, enrichment score; GO, Gene Ontology; n, number of genes in gene set and ranking list; NES, normalized enrichment score; Padj, adjusted P value for FGSEA; rank 1, gene most significantly upregulated by physioxia; rank ∼12 500, gene most significantly downregulated by physioxia.
Transcriptomic changes in WT and Tet2−/− LSK cells in response to ambient air exposure. Four biological replicates per group. (A) Y-axis shows differential expression (fold change); x-axis shows average normalized expression across all samples. Differential expression values are calculated as physioxia/air (upregulation means gene expression is increased in physioxia compared with ambient air cells; downregulated means gene expression is decreased in physioxia compared with ambient air cells). Red/blue (upregulated/downregulated) points indicate significantly differentially expressed genes (adjusted P < .05). Dashed lines represent a reference point for a ±1.5-fold change in expression on the graph. (B) Y-axis shows differential expression (fold change); x-axis shows average normalized expression across all samples. Differential expression values are calculated as Tet2−/−/WT (upregulation means upregulated by Tet2−/−; downregulated means downregulated by Tet2−/−). Red/blue (upregulated/downregulated) points indicate significantly differentially expressed genes (adjusted P < .05). Dashed lines represent a reference point for a ±1.5-fold change in expression on the graph. (C) Fast gene set enrichment analysis (FGSEA) is shown for differential expression analysis comparing physioxia isolation to ambient air exposure. ES, enrichment score; GO, Gene Ontology; n, number of genes in gene set and ranking list; NES, normalized enrichment score; Padj, adjusted P value for FGSEA; rank 1, gene most significantly upregulated by physioxia; rank ∼12 500, gene most significantly downregulated by physioxia.
FGSEA was performed to determine gene programs that are differentially expressed between WT and Tet2−/− LSK cells under physioxia and ambient air. WT LSK-physioxia cells upregulated multiple gene programs compared with LSK-air cells, including genes involved in antioxidant response and rapamycin target genes (Figure 4C). The upregulation of antioxidant genes likely provides protection against the detrimental effects of ROS generated during harvesting and removal from the BM microenvironmental survival signals.4 Increased expression of the rapamycin signaling pathway may be a stress response to a hypoxic microenvironment to maintain energy balance.54 Inhibition of mTORC1 via rapamycin has been shown to preserve HSC quiescence.55 In contrast to WT LSK cells, Tet2−/− LSK-physioxia cells did not upregulate these gene programs compared with Tet2−/− LSK-air cells. In addition to these gene programs, there were also gene programs that were enriched in both WT LSK-physioxia cells compared with WT LSK-air cells and in Tet2−/− LSK cells compared with WT LSK cells. These gene programs may shed light on the enhanced HSC function in WT LSK-physioxia and Tet2−/− LSK-physioxia/air cells such as increased expression of myeloid translocation gene CBFA2T3 regulated genes. CBFA2T3 maintains leukemia stem cell gene signature and normal HSC quiescence.56,57 WT LSK-physioxia cells and Tet2−/− LSK physioxia/air cells also exhibit increased expression of mitochondrial matrix genes that are essential for HSC homeostasis.58 Taken together, bulk RNA-seq analysis revealed significant transcriptomic changes between WT LSK- physioxia cells and WT LSK-air cells but only minimal changes between Tet2−/− LSK cells under both oxygen tensions, which is consistent with the lack of biological changes noted in transplant studies and in vitro colony formation studies derived from Tet2−/− cells collected and processed underphysioxia or air.
Physioxia or Tet2 loss of function in HSCs upregulates similar gene programs associated with enhanced HSC fitness
Utilizing the same approach as the one described in Figure 1 (CITE-seq profiling), we further evaluated Tet2−/− LSK-CD150hi cells under physioxia and ambient air and compared them to WT LSK-CD150hi cells under both oxygen conditions (Figure 5A-B; supplemental Figure 3A). Analysis of LSK cells demonstrated higher numbers of CD150hi cells in the Tet2−/− LSK subset compared with the WT LSK subset (supplemental Figure 3B). We also examined genes that were upregulated in WT LSK-CD150hi-physioxia cells and Tet2−/− LSK-CD150hi-physioxia cells and compared them with WT LSK-CD150hi-air cells in order to understand how these groups showed comparable engraftment and self-renewing capacity upon transplantation. Both cell groups expressed elevated levels of markers for long-term engrafting HSCs such as Slamf1 (supplemental Figure 3C) and Hoxb5, as well as genes involved in HSC quiescence, such as Csgalnact1,59 and homing, such as Spns260 and Selp61 (Figure 5C). A significant number of additional HSC self-renewal genes were similarly induced in WT and Tet2−/− LSK-CD150hi-physioxia cells vs WT LSK-CD150hi-air cells, including Tcf15, Cdkn1c, Hlf, Meis1, Hoxa9, Gata2, Mecom, and Ndn (Figure 5C). Along these lines, ssGSEA analysis revealed remarkable upregulation of genes involved in HSC self-renewal pathways in Tet2−/− LSK-CD150hi-air cells compared with WT LSK-CD150hi-air cells. (Figure 5D). Tet2−/− LSK-CD150hi-air cells exhibited reduced expression of oxidative phosphorylation genes compared with WT LSK-CD150hi-air cells, indicating that Tet2−/− LSK-CD150hi cells are more reliant on anaerobic glycolysis (Figure 5D). Consistent with the lack of functional differences between Tet2−/− LSK CD150hi-physioxia cells and Tet2−/− LSK CD150hi-air cells, ssGSEA analysis revealed similar expression of the Hif-1α–regulated pathway in Tet2−/− LSK-CD150hi-air cells and Tet2−/− LSK-CD150hi-physioxia cells.
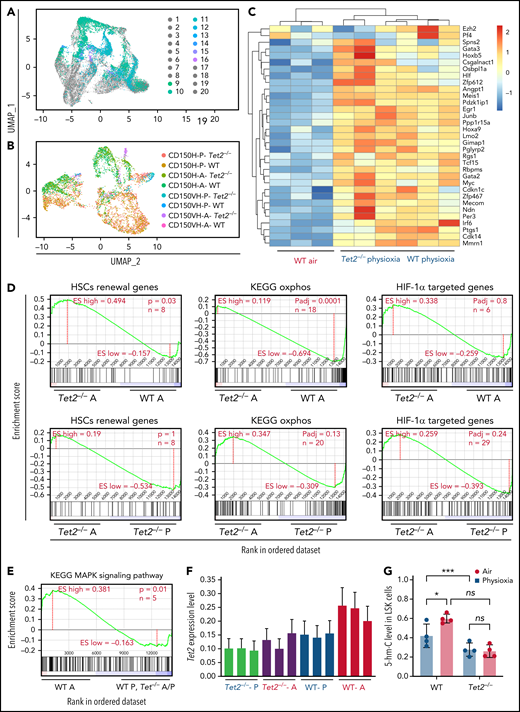
Surface proteins and transcriptomic changes in WT and Tet2−/− LSK cells in response to ambient air exposure. (A) Two-dimensional UMAP visualization of the full scRNA-seq data, in which samples were colored by the cell type determined by surface proteins and experimental conditions. (1) Tet2−/−CD150-CD117-physioxia, (2) WT CD150-CD117-physioxia, (3) Tet2−/−CD150-CD117-air, (4) WT CD150-CD117-air, (5) Tet2−/−CD150-CD117-CD48-physioxia, (6) WT CD150-CD117-CD48-physioxia, (7) Tet2−/−CD150-CD117_ CD48-air, (8) WT CD150-CD117-CD48-air, (9) Tet2−/−CD150-physioxia, (10) WT CD150-physioxia, (11) Tet2−/−CD150-air, (12) WT CD150-air, (13) Tet2−/−CD150-very high-physioxia, (14) WT CD150 very high-physioxia, (15) Tet2−/−CD150 very high-air, (16) WT CD150 vey high-air, (17) Tet2−/−CD48-physioxia, (18) WT CD48-physioxia, (19) Tet2−/−CD48-air, (20) WT CD48-air. (B) UMAP of LSK-CD150hi cells collected from the 4 conditions. (C) Heatmap of select HSC renewal and marker genes that are differentially expressed in Tet2−/− LSK-CD150hi-physioxia, and WT LSK-CD150hi-physioxia/air cells. (D-E) GSEA plots of select differentially expressed pathways between Tet2−/− LSK CD150hi-air cells and WT LSK-CD150hi-air cells. (F) Expression status of Tet2 in the CD150hi cells in physioxia and ambient air. (G) 5-hmC levels in WT and Tet2−/− LSK cells under physioxia and ambient air. Data are presented as mean ± standard error of the mean. *P < .05; ***P < .001 when analyzed by 2-way ANOVA with a post hoc Tukey’s multiple comparison test. A combination of 2 independent experiments is shown. KEGG, Kyoto Encyclopedia of Genes and Genomes; ns, not significant; Tet2−/−A, Tet2−/− air; Tet2−/− P, Tet2−/− physioxia; UMAP, Uniform Manifold Approximation and Projection; WT A, WT air; WT P, WT physioxia.
Surface proteins and transcriptomic changes in WT and Tet2−/− LSK cells in response to ambient air exposure. (A) Two-dimensional UMAP visualization of the full scRNA-seq data, in which samples were colored by the cell type determined by surface proteins and experimental conditions. (1) Tet2−/−CD150-CD117-physioxia, (2) WT CD150-CD117-physioxia, (3) Tet2−/−CD150-CD117-air, (4) WT CD150-CD117-air, (5) Tet2−/−CD150-CD117-CD48-physioxia, (6) WT CD150-CD117-CD48-physioxia, (7) Tet2−/−CD150-CD117_ CD48-air, (8) WT CD150-CD117-CD48-air, (9) Tet2−/−CD150-physioxia, (10) WT CD150-physioxia, (11) Tet2−/−CD150-air, (12) WT CD150-air, (13) Tet2−/−CD150-very high-physioxia, (14) WT CD150 very high-physioxia, (15) Tet2−/−CD150 very high-air, (16) WT CD150 vey high-air, (17) Tet2−/−CD48-physioxia, (18) WT CD48-physioxia, (19) Tet2−/−CD48-air, (20) WT CD48-air. (B) UMAP of LSK-CD150hi cells collected from the 4 conditions. (C) Heatmap of select HSC renewal and marker genes that are differentially expressed in Tet2−/− LSK-CD150hi-physioxia, and WT LSK-CD150hi-physioxia/air cells. (D-E) GSEA plots of select differentially expressed pathways between Tet2−/− LSK CD150hi-air cells and WT LSK-CD150hi-air cells. (F) Expression status of Tet2 in the CD150hi cells in physioxia and ambient air. (G) 5-hmC levels in WT and Tet2−/− LSK cells under physioxia and ambient air. Data are presented as mean ± standard error of the mean. *P < .05; ***P < .001 when analyzed by 2-way ANOVA with a post hoc Tukey’s multiple comparison test. A combination of 2 independent experiments is shown. KEGG, Kyoto Encyclopedia of Genes and Genomes; ns, not significant; Tet2−/−A, Tet2−/− air; Tet2−/− P, Tet2−/− physioxia; UMAP, Uniform Manifold Approximation and Projection; WT A, WT air; WT P, WT physioxia.
To further understand the compromised engraftment of WT HSC-air cells compared with WT HSC-physioxia cells, Tet2−/− HSC-air cells, and Tet2−/− HSC-physioxia cells, we interrogated genes that are differentially expressed in WT LSK-CD150hi-air cells compared with WT LSK-CD150hi-physioxia cells, Tet2−/− LSK-CD150hi-air cells, and Tet2−/− LSK-CD150hi-physioxia cells. Our analysis revealed an increase in the expression of p38 MAPK pathway in WT LSK-CD150hi-air cells, which has been implicated in regulating stem cell fitness49 (Figure 5E; supplemental Table 2).
Consistent with previously published work,12,13Tet2−/− cells exhibited decreased expression of Tet2 in BM cells in air. However, unlike WT BM cells, which showed a significant reduction in both Tet2 expression and 5-hmC levels in physioxia, Tet2−/− cells showed a similar reduction in the gene and protein expression of Tet2 (Figure 5F; supplemental Figure 3D) and 5-hmC levels (Figure 5G; supplemental Figure 3E), regardless of being in physioxia or in ambient air. Taken together, utilizing CITE-seq as an alternative method to sort and analyze HSC transcriptome in physioxia, we describe several overlapping upregulated transcriptional programs between WT HSC -physioxia cells and Tet2−/− HSC-physioxia cells, which may contribute to the enhanced functions observed in WT HSCs harvested under physioxia.
Restoration of Tet2 activity in WT BM cells under physioxia results in reduction of HSC number
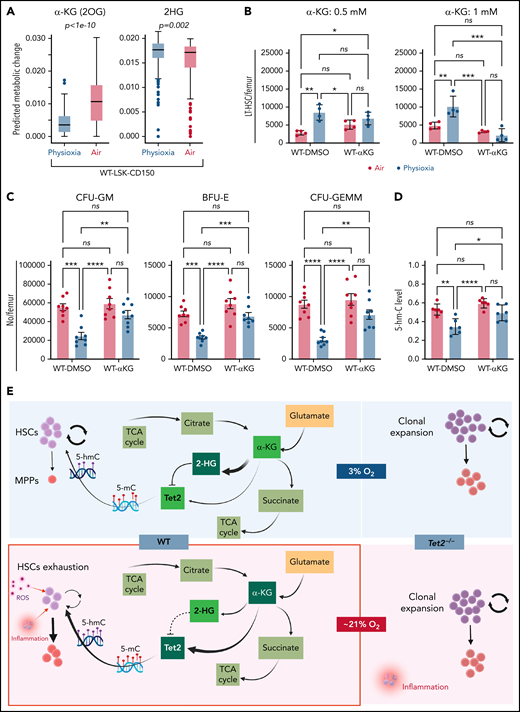
We sought to understand the molecular basis for the low Tet2 expression/activity in WT LSK-CD150hi cells under physioxia. The decreased expression and low activity of Tet2 under physioxia compared with ambient air in WT LSK-CD150hi cells could be attributed to potential metabolic changes during the sudden oxygenation process (extraphysiologic oxygen shock/stress). Previous studies have reported significant metabolic changes under hypoxia.62 We employed a metabolic flux predictor (single-cell flux estimation analysis) to predict changes in central metabolic pathways, including glycolysis, tricarboxylic acid (TCA) cycle, and glutamine metabolic pathways in the CITE-seq data for WT and Tet2−/− LSK-CD150hi cells (supplemental Figure 4A).63 Given that α-KG is an essential cofactor for Tet2 activity,14-18 we estimated the changes in α-KG and its byproduct 2-hydroxyglutarate (2-HG) in WT and Tet2−/− LSK-CD150hi cells under air and physioxia. We considered 2 major sources of α-KG (also known as 2-oxoglutarate) influx in this study: isocitrate in the TCA cycle and mitochondrial glutamate in glutaminolysis, as well as 2 possible sources of 2-oxoglutarate outflux: succinyl-coenzyme A in the TCA cycle and 2-HG (supplemental Figure 4A). We predicted a significant reduction in the abundance of α-KG in WT CD150hi-physioxia cells compared with WT CD150hi- air cells (Figure 6A), likely caused by the decreased influx from glutaminolysis and higher outflux to 2-HG in WT CD150hi-physioxia cells.64 Additionally, we observed a substantial increase in the abundance in 2-HG when WT CD150hi-physioxia cells were compared with WT CD150hi-air cells (Figure 6A), which is mostly due to reduced flux from α-KG to 2-HG in the WT CD150hi-air cells (Figure 6A; supplemental Table 3). Thus, the reduction in Tet2 activity in WT BM cells is due to deficiency in the supply of α-KG cofactor. Additionally, the accumulated 2-HG may act as an α-KG antagonist and a competitive inhibitor of α-KG-dependent dioxygenases, including Tet2.65

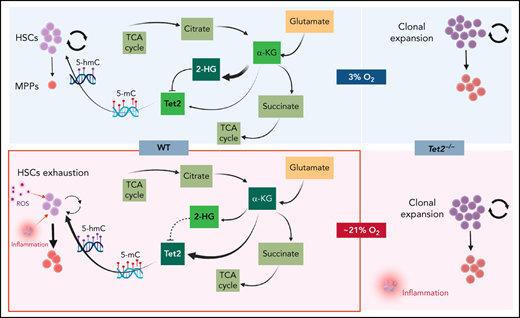
WT BM cells’ response to α-KG treatment under physioxia and ambient air. (A) The box plots show the relative abundance of 2OG and 2HG levels in WT LSK-CD150hi cells in physioxia and ambient air estimated by single-cell flux estimation analysis. P value calculated by Wilcoxon rank sum test. (B) Number of WT HSCs after a 6-hour incubation with α-KG under physioxia and ambient air. (C) Number of WT-HPCs after a 6-hour incubation with α-KG under physioxia and ambient air. (D) 5-hmC levels in BM cells treated with α-KG or DMSO under physioxia and air. Data are presented as mean ± standard error of the mean. *P < .05; **P < .01; ***P < .001; ****P < .0001 when analyzed by Wilcoxon rank sum test for (A) and by 2-way analysis of variance with a post hoc Tukey’s multiple comparison test for (B-D). (E) Graphical abstract of WT and Tet2−/− cell behavior and underlying mechanism in physioxia and ambient air. Under physioxia, WT HSC pool is maintained as a result of diminished Tet2 activity, which is inhibited as a result of reduced levels of α-KG (Tet2 cofactor) and increased levels of 2-HG (Tet2 inhibitor). Under ambient air, WT HSC is induced to differentiate to MPPs by increased ROS levels, increased Tet2 activity, and activated p38 MAPK pathway. Tet2−/− cells demonstrate resistance to extraphysiologic oxygen effect. 2HG, 2-Hydroxyglutarate; 2OG, 2-Oxoglutarate; DMSO, dimethyl sulfoxide; ns, not significant.
WT BM cells’ response to α-KG treatment under physioxia and ambient air. (A) The box plots show the relative abundance of 2OG and 2HG levels in WT LSK-CD150hi cells in physioxia and ambient air estimated by single-cell flux estimation analysis. P value calculated by Wilcoxon rank sum test. (B) Number of WT HSCs after a 6-hour incubation with α-KG under physioxia and ambient air. (C) Number of WT-HPCs after a 6-hour incubation with α-KG under physioxia and ambient air. (D) 5-hmC levels in BM cells treated with α-KG or DMSO under physioxia and air. Data are presented as mean ± standard error of the mean. *P < .05; **P < .01; ***P < .001; ****P < .0001 when analyzed by Wilcoxon rank sum test for (A) and by 2-way analysis of variance with a post hoc Tukey’s multiple comparison test for (B-D). (E) Graphical abstract of WT and Tet2−/− cell behavior and underlying mechanism in physioxia and ambient air. Under physioxia, WT HSC pool is maintained as a result of diminished Tet2 activity, which is inhibited as a result of reduced levels of α-KG (Tet2 cofactor) and increased levels of 2-HG (Tet2 inhibitor). Under ambient air, WT HSC is induced to differentiate to MPPs by increased ROS levels, increased Tet2 activity, and activated p38 MAPK pathway. Tet2−/− cells demonstrate resistance to extraphysiologic oxygen effect. 2HG, 2-Hydroxyglutarate; 2OG, 2-Oxoglutarate; DMSO, dimethyl sulfoxide; ns, not significant.
We aimed to restore Tet2 activity in WT CD150hi-physioxia cells by introducing its cofactor, α-KG. We collected and processed WT and Tet2−/− BM cells under physioxia and ambient air. WT and Tet2−/− BM cells were supplemented with cell-permeable α-KG or DMSO and incubated under physioxia and ambient air for 6 hours. In comparison with the DMSO-treated cells, WT BM cells treated with α-KG demonstrated no significant changes in HSCs, HPC numbers or 5-hmC levels between the physioxia and air samples (Figure 6B-D; supplemental Figure 4B).
To confirm whether α-KG–induced changes are due to restoration of Tet2 activity, we assessed 5-hmC levels in WT BM cells treated with α-KG or DMSO. In comparison with the DMSO treated cells, WT BM cells treated with α-KG cells demonstrated no significant changes in 5-hmC levels between the physioxia and air conditions. In addition, we examined the effect of α-KG and DMSO treatment on Tet2−/− BM cells under physioxia and in ambient air. Remarkably, the number of HSCs or HPCs were comparable across all conditions (physioxia plus α-KG, physioxia plus DMSO, air plus α-KG, and air plus DMSO) (supplemental Figure 4C-D), supporting the notion that α-KG activates Tet2 in physioxia and restores its activity, which leads to HSC differentiation. Taken together, these findings indicate that, under physioxia, α-KG is consumed and antagonized by its byproduct 2-HG, leading to diminished Tet2 enzymatic activity. Because Tet2 regulates HSC differentiation,66,67 WT HSC differentiation under physioxia is reduced, resulting in a greater number of HSCs and a lower number of HPCs in WT cells under physioxia. Supplementing these cells with the Tet2 cofactor α-KG partially restores Tet2 enzymatic activity and promotes HSC differentiation (Figure 6E).
Discussion
Molecular programs regulating HSCs under physiologic oxygen remain poorly understood, mainly because of the technical difficulties of isolating and sequencing HSCs under physiologic oxygen. Here, we developed a strategy for studying the transcriptome of normal and preleukemic HSCs under physioxia by leveraging CITE-seq as an alternate method for sorting and sequencing HSCs. Our analysis of WT and Tet2−/− HSCs and HPCs revealed contrasting responses when exposed to ambient air. Although WT HSCs and HPCs exhibit significant changes in number and function in response to ambient air exposure, Tet2−/− HSCs and HPCs were resistant to such effect as evidenced by similar numbers and functions between the physioxia and ambient air groups. Notably, Tet2 expression was reduced in WT BM-physioxia cells. The reduction in Tet2 expression and activity in WT BM-physioxia cells, combined with the similar engraftment of WT HSCs-physioxia cells and Tet2−/− HSCs-physioxia/air cells, suggests that perhaps the downregulation of Tet2 activates a common molecular program that promotes their survival and regenerative capacity. Our present CITE-seq revealed several physioxia-upregulated genes linked to HSC self-renewal, quiescence, and pathways involving stress response, cellular maintenance, and Hif-1α–regulated programs that may contribute to the enhanced engraftment in WT HSCs-physioxia. Conversely, we observed an upregulation of genes involved in HSC differentiation, apoptosis, and p38 MAPK and innate inflammatory pathways in WT HSCs-air cells, which have been shown to impair HSC recovery and function. Supplementing BM cells under physioxia with α-KG, restored Tet2 activity and generated a phenotype similar to WT HSCs and HPCs under air, providing further evidence of Tet2's potential role in promoting HSC self-renewal under physioxia.
Our data shed light on Tet2s interactions with oxygen sensing mechanism in the hematopoietic compartment.18,68 Hypoxia is critical to maintain HSCs quiescence and reduced oxidative stress status.69 Hypoxia effects are primarily mediated by HIF-1α.70 Under ambient air, HIF-1α is hydroxylated by prolyl hydroxylases (PHDs) to be recognized by von Hippel-Lindau E3 ubiquitin ligase for ubiquitination and subsequent proteasomal degradation.71 Under hypoxia, HIF-1α is stabilized and translocated to the nucleus to activate transcription of hypoxia responsive genes. However, evidence of noncanonical HIF-1α regulation has been reported.72 TET1 physically interacts with and regulates HIF-1α response under chronic stress conditions.73 TETs also interact with HIF-1α in neuroblastoma cells22 and hematopoietic cells.24 Furthermore, TET2 enzymes and HIF-1α form a multilayered mechanism regulating the hypoxia responsive gene.21
Compared with WΤ HSCs, we did not detect significant difference in Hif-1α–targeted genes in Tet2−/− -air and Tet2−/− -physioxia, which may contribute to their comparable enhanced engraftment and self-repopulating capacities. Our data and those of others21,22,24,74 encourage further genome-wide studies under physiologic oxygen to explore the crossregulatory interactions between HIF-1α, TETs, and other factors regulating the oxygen-sensing pathway, such as NF-κB, p53, Myc, and AP1.73
Because α-KG is a substrate of HIF-PHDs, supplementing cells with α-KG might activate PHD and thereby destabilize Hif-1α.75 However, it is unlikely that Hif-1α’s potential destabilization in BM cells plays a role in the α-KG treatment-resultant decrease in HSC numbers or increase in HPCs in physioxia. The unresponsiveness of Tet2−/− BM cells to α-KG treatment as well as the significant changes in 5-hmC levels in WT BM cells supplemented with α-KG indicate that the latter restores Tet2 function rather than alters Hif-1α activity. Further, previous evaluation of Hif-1a−/− cells under physioxia revealed no significant difference in HSC numbers compared with ambient air.4 Based on these data, we suggest that any potential destabilization in Hif-1α following α-KG treatment likely does not lead to a decrease in HSC numbers.
Chronic inflammation is one of the hallmarks of the Tet2−/− BM cells.76-79 Although WT HSCs/HPCs are negatively affected by chronic inflammation, Tet2-mutated BM cells upregulate NF-kB/IL-6/Stat3/Morrbid signaling and confer resistance to inflammation-induced detrimental effect.77Tet2−/− BM cells may also bypass and repurpose the chronic inflammatory milieu by upregulating TRAF6 and switching proapoptotic canonical NF-κB pathway to noncanonical NF-κB, which may contribute to clonal expansion.80 This study highlights the need to reevaluate HSCs and their response to various stimuli under low oxygen tension conditions as opposed to ambient air.
Acknowledgements
These studies were supported by Public Health Service grants from National Institutes of Health (R35 HL139599 and U54 DK106846) (H.E.B), (R01-CA134777, RO1-HL140961, and RO1-CA17385206) (R.K.), and (NSF DBI IIBR 2047631) (C.Z.). A.A and J.R. are supported by T32 DK007519 training grant to H.E.B.
This body of work is dedicated to Hal E. Broxmeyer for his contributions to the field of hematology and his mentorship, leadership, friendship, and love for scientific discoveries; he will always be remembered for these attributes.
Authorship
Contribution: A.A., R.K., and H.E.B. conceptualized the study; A.A. and J.R. designed experiments; A.A., J.R., L.R.P., B.R., S.C., and M.L.C. performed experiments; A.A., R.K., H.E.B., C.Z., J.R., and W.C. interpreted data; and A.A., R.K., C.Z., and J.R. wrote the manuscript.
Conflict-of-interest disclosure: The authors declare no competing financial interests.
Hal E. Broxmeyer died on 8 December 2021.
Correspondence: Reuben Kapur, Department of Pediatrics, Indiana University School of Medicine, R4-168, Wells Center for Pediatric Research, Indianapolis, IN 46202; e-mail: rkapur@iupui.edu.
All bulk RNA-seq and CITE-seq data are deposited in the Gene Expression Omnibus (accession number GSE192993).
The online version of this article contains a data supplement.
There is a Blood Commentary on this article in this issue.
The publication costs of this article were defrayed in part by page charge payment. Therefore, and solely to indicate this fact, this article is hereby marked “advertisement” in accordance with 18 USC section 1734.