Key Points
Patient-derived KIT D816V iPSCs and CRISPR-engineered KIT D816V ESCs model SM disease heterogeneity and serve as a drug screening platform.
Nintedanib selectively targets KIT D816V iPSC- and ESC-derived cells and primary samples from SM patients.

Abstract
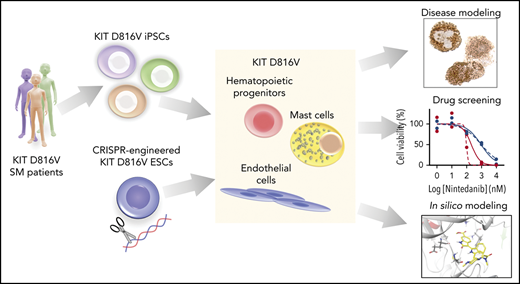
The KIT D816V mutation is found in >80% of patients with systemic mastocytosis (SM) and is key to neoplastic mast cell (MC) expansion and accumulation in affected organs. Therefore, KIT D816V represents a prime therapeutic target for SM. Here, we generated a panel of patient-specific KIT D816V induced pluripotent stem cells (iPSCs) from patients with aggressive SM and mast cell leukemia to develop a patient-specific SM disease model for mechanistic and drug-discovery studies. KIT D816V iPSCs differentiated into neoplastic hematopoietic progenitor cells and MCs with patient-specific phenotypic features, thereby reflecting the heterogeneity of the disease. CRISPR/Cas9n-engineered KIT D816V human embryonic stem cells (ESCs), when differentiated into hematopoietic cells, recapitulated the phenotype observed for KIT D816V iPSC hematopoiesis. KIT D816V causes constitutive activation of the KIT tyrosine kinase receptor, and we exploited our iPSCs and ESCs to investigate new tyrosine kinase inhibitors targeting KIT D816V. Our study identified nintedanib, a US Food and Drug Administration–approved angiokinase inhibitor that targets vascular endothelial growth factor receptor, platelet-derived growth factor receptor, and fibroblast growth factor receptor, as a novel KIT D816V inhibitor. Nintedanib selectively reduced the viability of iPSC-derived KIT D816V hematopoietic progenitor cells and MCs in the nanomolar range. Nintedanib was also active on primary samples of KIT D816V SM patients. Molecular docking studies show that nintedanib binds to the adenosine triphosphate binding pocket of inactive KIT D816V. Our results suggest nintedanib as a new drug candidate for KIT D816V–targeted therapy of advanced SM.
Introduction
Mastocytosis is a group of hematopoietic malignancies that is characterized by abnormal proliferation and accumulation of neoplastic mast cells (MCs) in 1 or multiple tissues and organs, including bone marrow (BM), spleen, liver, and skin.1,2 The degree of MC infiltration, number of tissues/organs involved, and mutational load contribute to a heterogeneous pathology and distinct disease categories in systemic mastocytosis (SM): indolent SM, smoldering SM, aggressive SM (ASM), MC leukemia (MCL), and SM with an associated hematological disease (SM-AHD).1,3,4 ASM, MCL, and SM-AHD represent advanced forms of SM that are characterized by pronounced MC infiltration compromising organ function, rapid disease progression, and poor prognosis. Only a few therapeutic options are available for these patients.4-6
Mutations in the gene encoding the KIT receptor are central to the evolution of SM, and the KIT D816V mutation is the most prevalent and identified in all SM categories.3,6-8 This mutation leads to constitutive activation of KIT and abnormal expansion and accumulation of MCs in affected organs.6,8,9 Several tyrosine kinase inhibitors (TKIs) were reported to inhibit KIT activity in neoplastic MCs.10-14 However, KIT D816V confers resistance to several of these TKIs, including imatinib.11,15 Other TKIs, such as midostaurin, suppress the growth of KIT D816V neoplastic MCs, and, recently, midostaurin was approved for the treatment of advanced SM.16-18 More recently, 2 additional compounds targeting KIT D816V, ripretinib (DCC-2618) and avapritinib (BLU-285), were identified and are being tested in clinical trials for advanced SM.19-21 However, the performance of, and patient tolerability to, these TKIs can be variable because SM is a heterogeneous pathology; therefore, further efforts are needed to establish preclinical models and identify new TKIs.
Primary samples of SM patients represent a scarce and highly variable cell source for preclinical studies. Moreover, MCs often represent a minor fraction in BM aspirates. In addition, few human MC lines are available; among those, only 2, HMC-1.2 and ROSAD816V, express KIT D816V.8 Additionally, engineered or established KIT D816V cell lines do not fully recapitulate KIT D816V SM, because additional mutations in genes such as ASXL1, CBL, RUNX1, SRSF2, and TET2 are commonly found in patients with KIT D816V ASM and MCL.8,22-24 These concurring mutations contribute to disease heterogeneity and progression. Therefore, to study SM pathology and to screen for compounds targeting SM cells, more authentic disease models that more faithfully recapitulate the genetic and functional features of SM are required.
Patient-derived induced pluripotent stem cells (iPSCs) provide an inexhaustible cell source for disease modeling and drug screening while retaining the patient-specific genetic background, including disease-specific and/or associated mutations.25-27 Additionally, iPSCs and embryonic stem cells (ESCs) are readily subjected to genome engineering by CRISPR/Cas9 to precisely introduce or repair oncogenic mutations.26,28,29
We report here on the generation of KIT D816V iPSCs from SM patients. SM-derived KIT D816V iPSCs differentiated into hematopoietic progenitor cells (HPCs) and MCs with patient-specific features. Additionally, we introduced the KIT D816V mutation into human ESCs by CRISPR/Cas9n, thus generating a panel of KIT D816V and KIT-unmutated iPSC and ESC lines. Compound screening identified the TKI nintedanib (Vargatef, Ofev) and its analogs as potent novel KIT D816V inhibitors. This finding was recapitulated in iPSC- and ESC-derived KIT D816V hematopoietic cells and SM primary samples, thereby demonstrating KIT D816V–specific targeting by nintedanib.
Materials and methods
iPSC generation and culture
Reprogramming of SM primary samples (supplemental Table 1; available on the Blood Web site) and cultivation of iPSCs were performed as described previously.29 KIT D816V mutation was detected by allele-specific PCR (supplemental Table 2).
Generation of KIT D816V ESCs by CRISPR/Cas9n editing
Human HES-3 ESCs (ES03) were from the WiCell Research Institute and were cultured as described for iPSCs.29 ESC studies were approved by German authorities, Robert Koch Institute, Berlin, Germany (permit no. 1710-79-1-4-79). KIT D816V ESCs were generated as described previously using the pX335 vector (Addgene 42335) and oligonucleotides listed in supplemental Table 3.29
Cytogenetic analysis and Epi-Pluri test
Immunofluorescence staining
iPSCs and ESCs were stained for pluripotency markers, and endothelial cells were stained for CD31 and CD144 (supplemental Table 4), essentially as described previously.29
Hematopoietic differentiation of iPSCs and ESCs
iPSCs were differentiated into hematopoietic progenitor cells and MCs using an embryonic body (EB)-based protocol.31,32 ESCs were differentiated toward the hematopoietic lineage by adapting a hypoxia-based protocol.29 CD34+ HPCs were isolated by magnetic-activated cell sorting (MACS; Miltenyi Biotec) and expanded for up to 12 days at 37°C and 5% CO2 in hematopoietic differentiation medium.31
Compound testing on hematopoietic cells, MCs, and endothelial cells
MACS-selected KIT+ or KIT− hematopoietic cells derived from iPSCs or ESCs were cultured with compounds in a 96-well format (Greiner), with 104 cells per well, in 90 µL of drug screening medium (RPMI 1640 supplemented with 10% fetal calf serum, 2 mM l-glutamine, 100 U/mL penicillin, and 100 µg/mL streptomycin; all from Thermo Fisher Scientific) for 66 hours. Cell viability was determined using a CellTiter-Glo Luminescent Cell Viability Assay, SpectraMAX i3 Plate Reader, and SoftMax Pro Software.
CD45+KIThigh iPSC-derived MCs were seeded at a density of 5 × 10³ cells per well and subjected to compound testing, as above. Endothelial cells (104 cells per well) were treated with compounds in fully supplemented EGM-2 medium (Lonza) for 48 hours and then analyzed as above.
Detailed methods for next-generation sequencing (NGS) analysis, endothelial cell differentiation, proliferation assay, low-density lipoprotein (LDL) uptake assay, flow cytometry analysis and sorting, apoptosis assay, western blotting, colony-forming unit (CFU) assay, cytospin preparations, drug sensitivity and resistance testing (DSRT) assay, compound testing on primary cells, animal studies, reverse transcription polymerase chain reaction (RT-PCR) analysis, and molecular docking are provided in supplemental Methods.
Results
KIT D816V iPSCs express a constitutively active KIT receptor
KIT D816V iPSCs were generated from 14 KIT D816V/H SM patients by reprogramming peripheral blood or BM mononuclear cells (supplemental Table 1). More than 1000 iPSC lines were obtained, and 5 KIT D816V iPSC lines (3 from patient 1, 1 from patient 2, and 1 from patient 3) and 5 unmutated KIT iPSC lines (2 from patient 1, 1 from patient 2, and 2 from patient 3; hereafter referred to as controls) were used in this study. All 10 iPSC lines were pluripotent, as determined by morphology; expression of the pluripotency markers OCT4, NANOG, TRA-1-60, and TRA-1-81; and by Epi-Pluri-Score analysis (Figure 1A; supplemental Figure 1A-B).30 Karyotype analysis of all iPSCs showed normal GTG banding and no numeric abnormalities (supplemental Figure 1C).
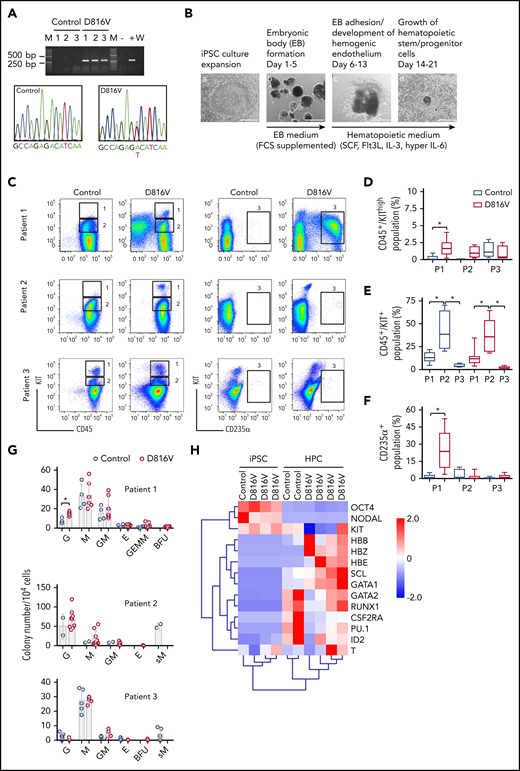
Hematopoietic differentiation of patient-specific KIT D816V iPSCs. (A) KIT D816V mutation in iPSCs by allele-specific PCR (upper panel). KIT D816V mutation in iPSCs by Sanger sequencing (lower panels). Control 1-3, iPSCs without mutation; D816V 1-3, iPSCs with mutation; M, molecular weight marker; W, water control; -, HMC-1.1 cell line; +, HMC-1.2 cell line. (B) Hematopoietic differentiation protocol. EBs were formed from iPSCs (Ba-b) and differentiated toward the hematopoietic lineage (Bc-d). Scale bars, 500 μm. (C) Representative flow cytometry analysis of KIT D816V and control iPSC-derived hematopoietic cells from patients 1 through 3. The plots represent synchronized hematopoietic-differentiation experiments and show patient-specific phenotypes. Gates 1, 2, and 3 are for CD45+/KIThigh, CD45+/KIT+, and CD235α+ cells, respectively. (D) Quantification of CD45+/KIThigh populations for KIT D816V and control iPSC-derived cells from all 3 patients (P1, P2, and P3). Flow cytometry was performed between days 15 and 31 of hematopoietic differentiation (n = 4-21). *P < .0001. (E) Quantification of CD45+/KIT+ populations by flow cytometry, as in (D), between days 15 and 49 of differentiation (n = 4-30). *P ≤ .0003. (F) Quantification of CD235α+ population by flow cytometry, as in (D), between days 15 and 49 of differentiation (n = 4-30). *P < .0001. (G) CFU assay for KIT D816V and control iPSC-derived hematopoietic cells. Colony numbers and phenotype were evaluated 14 days after seeding. Bars indicate average colony numbers ± standard deviation of ≥3 independent experiments, with the exception of patient 2 control iPSCs (n = 2). *P = .02. (H) Quantitative RT-PCR data for patient 1–derived KIT D816V and control iPSCs and corresponding HPCs. Results are from 2 and 4 independent hematopoietic-differentiation experiments for control and KIT D816V HPCs, respectively. Gene expression values were subjected to bidirectional hierarchical clustering and are shown in heat map format (red and blue represent high and low gene expression, respectively). Statistical analysis was performed with Welch’s t test.
Hematopoietic differentiation of patient-specific KIT D816V iPSCs. (A) KIT D816V mutation in iPSCs by allele-specific PCR (upper panel). KIT D816V mutation in iPSCs by Sanger sequencing (lower panels). Control 1-3, iPSCs without mutation; D816V 1-3, iPSCs with mutation; M, molecular weight marker; W, water control; -, HMC-1.1 cell line; +, HMC-1.2 cell line. (B) Hematopoietic differentiation protocol. EBs were formed from iPSCs (Ba-b) and differentiated toward the hematopoietic lineage (Bc-d). Scale bars, 500 μm. (C) Representative flow cytometry analysis of KIT D816V and control iPSC-derived hematopoietic cells from patients 1 through 3. The plots represent synchronized hematopoietic-differentiation experiments and show patient-specific phenotypes. Gates 1, 2, and 3 are for CD45+/KIThigh, CD45+/KIT+, and CD235α+ cells, respectively. (D) Quantification of CD45+/KIThigh populations for KIT D816V and control iPSC-derived cells from all 3 patients (P1, P2, and P3). Flow cytometry was performed between days 15 and 31 of hematopoietic differentiation (n = 4-21). *P < .0001. (E) Quantification of CD45+/KIT+ populations by flow cytometry, as in (D), between days 15 and 49 of differentiation (n = 4-30). *P ≤ .0003. (F) Quantification of CD235α+ population by flow cytometry, as in (D), between days 15 and 49 of differentiation (n = 4-30). *P < .0001. (G) CFU assay for KIT D816V and control iPSC-derived hematopoietic cells. Colony numbers and phenotype were evaluated 14 days after seeding. Bars indicate average colony numbers ± standard deviation of ≥3 independent experiments, with the exception of patient 2 control iPSCs (n = 2). *P = .02. (H) Quantitative RT-PCR data for patient 1–derived KIT D816V and control iPSCs and corresponding HPCs. Results are from 2 and 4 independent hematopoietic-differentiation experiments for control and KIT D816V HPCs, respectively. Gene expression values were subjected to bidirectional hierarchical clustering and are shown in heat map format (red and blue represent high and low gene expression, respectively). Statistical analysis was performed with Welch’s t test.
All KIT D816V iPSCs showed reduced KIT surface expression in comparison with unmutated KIT cells (supplemental Figure 1D-E), which is in line with KIT D816V being confined to and signaling from intracellular compartments.9 Additionally, KIT D816V iPSCs showed strong phosphorylation of glycosylated and nonglycosylated forms of the receptor without stem cell factor (SCF) stimulation (supplemental Figure 1F). Control iPSCs showed very low phosphorylation of glycosylated KIT; upon SCF stimulation, receptor internalization and phosphorylation of unmutated glycosylated KIT, AKT, and STAT3 were observed. These data are in accordance with KIT D816V representing a constitutively active receptor in iPSCs.
KIT D816V and control iPSCs exhibit patient-specific phenotypes upon hematopoietic differentiation
KIT D816V and control iPSCs were induced to differentiate into hematopoietic cells in an EB-based protocol (Figure 1B).31 A CD45+/KIThigh MC population was observed for KIT D816V and control iPSC-derived cells. In patient 1 and 2 samples, this population was more prominent in the KIT D816V genotype (Figure 1C-D) and was observed at early time points (>14 days; supplemental Figure 2A). KIT D816V conferred a proliferative advantage to KIT+ cells, regardless of SCF stimulation, compared with KIT-unmutated KIT+ cells (supplemental Figure 2B). KIT D816V also sustained cell viability upon cytokine withdrawal. Thus, KIT D816V promotes MC development in vitro in our iPSC model and confers greater proliferation capacity to hematopoietic cells.
Additionally, iPSCs exhibited patient-specific differentiation propensities. Patient 1 KIT D816V iPSC-derived cells showed a prominent erythroid CD235α+CD43+KIT+ population; in CFU assays, burst-forming unit-erythroid (BFU-E) colonies were observed only in the mutated genotype (Figure 1C,F-G; supplemental Figure 3A-B). Cytospin preparations of KIT D816V CD235α+ cells revealed different stages of erythroid maturation (supplemental Figure 3C). Patient 2 iPSCs showed a prominent CD45+/KIT+ population during differentiation, with myeloid progenitor morphology concomitant with prominent apoptosis (Figure 1C,E; supplemental Figure 4). CFU assays showed a strong bias toward granulocytes and macrophages for KIT D816V and control cells, whereas abnormal CFU-M of small size were observed only in controls (Figure 1G). Patient 3 KIT D816V and control iPSC–derived hematopoietic cells showed a prominent CD45+/KIThigh MC population (Figure 1C-D; supplemental Figure 5A). CFU assays revealed decreased colony-forming potential and a bias toward the macrophage lineage, in agreement with the abundance of macrophages in cytospin preparations (Figure 1G; supplemental Figure 5B).
Finally, iPSC-derived cells exhibited hematopoietic gene expression profiles, as well as recapitulated the erythroid bias observed in patient 1 KIT D816V iPSC–derived hematopoietic cells, as shown by the high expression of hemoglobin genes HBB, HBE, and HBZ (Figure 1H).
KIT D816V iPSCs harbor patient-specific mutation profiles
Previous studies have shown mutations other than KIT D816V in patients with advanced mastocytosis, most frequently in ASXL1, CBL, RUNX1, SRSF2, and TET2, which correlate with poor survival.22,23 In agreement with these observations, we identified a patient-specific subset of mutations in ASM and MCL primary samples that was recapitulated in the iPSCs derived therefrom (Table 1; supplemental Figure 6). Of particular relevance, an NFE2 truncating mutation was identified concurrent with KIT D816V in patient 1 iPSCs. In patient 2, an SRSF2 in-frame 8-aa deletion (P95_R102del) was detected in all iPSC cell lines, whereas additional likely pathogenic mutations in RUNX1 and TET2 were found only in control iPSCs. In the primary sample from patient 3, no KIT D816V or other pathogenic or likely pathogenic mutation was detected, in agreement with the low number of KIT D816V iPSCs obtained (1/129 screened). The presence of different concurring mutations reflects the clonal composition and the genetic complexity of SM pathology and highlights the value of the iPSC lines generated in this study as a tool for disease modeling and compound screening.
KIT D816V ESCs recapitulate phenotypes of KIT D816V iPSCs
To address the question of a potential influence of concurrent mutations on SM iPSC differentiation, we introduced the KIT D816V mutation into human ESCs by CRISPR/Cas9n technology (supplemental Figure 7). As observed for KIT D816V iPSCs, KIT receptor surface expression in KIT D816V ESCs was lower than in control ESCs, although no difference in KIT messenger RNA (mRNA) expression was detected (supplemental Figure 8A). Strong phosphorylation of nonglycosylated KIT D816V receptor was also observed in western blot analysis (supplemental Figure 8B-C).
KIT D816V ESC differentiation yielded >95% CD45+ hematopoietic cells, including CD45+/KIThigh MCs (Figure 2A; supplemental Figure 9). Importantly, KIT D816V ESC-derived hematopoietic cells showed an erythroid bias, although it was not as prominent as in KIT D816V iPSC-derived cells from patient 1 (CD235+ ESC D816V 1 = 8.0 ± 2.9; CD235+ ESC D816V 2 = 9.6 ± 3.9; CD235+ patient 1 D816V = 24.6 ± 14.5, population size in percentage of living cells). Accordingly, cytospin preparations showed higher numbers of nucleated erythrocytes for KIT D816V cells (Figure 2A). In CFU assays, colony-forming unit-erythroid (CFU-E) and BFU-E were only observed for mutated progenitors, and higher expression of hemoglobin genes HBB, HBE, and HBZ was observed (Figure 2A,C-D). No significant difference was observed for KIT D816V and control CD45+/KIThigh MC populations, in agreement with the reported weak oncogenic effect of KIT D816V alone.33 Taken together, these results demonstrate that KIT D816V ESCs recapitulate the phenotypes observed in patient-derived KIT D816V iPSCs, such as constitutive KIT phosphorylation, reduced surface expression of the mutated receptor, and erythroid bias upon hematopoietic differentiation.
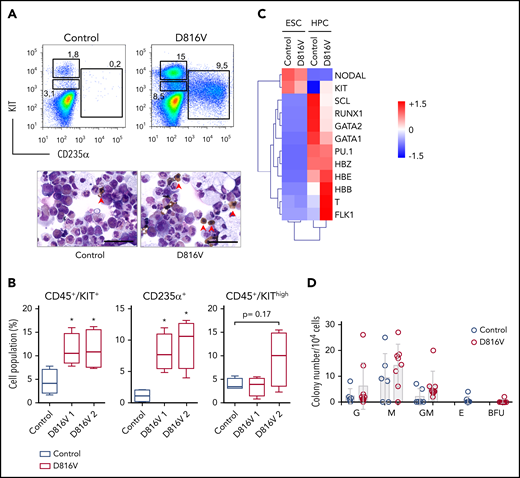
KIT D816V ESCs recapitulate the KIThighand erythroid phenotype of patient KIT D816V iPSCs. (A) Flow cytometry analysis of KIT D816V and control ESC-derived hematopoietic cells 11 days after CD34+ MACS selection (upper panels). Prominent CD235α+ and CD45+/KIThigh populations are observed in KIT D816V ESC–derived cells. Cytospin preparations of the same samples show nucleated erythrocytes (red arrowheads) (lower panels). Scale bars, 50 μm. (B) Quantification of hematopoietic cell populations (n = 4) derived from KIT D816V clone 1 and D816V clone 2 ESCs and control ESCs. KIT D816V ESCs show prominent CD45+/KIT+ and CD235+ populations. The CD45+/KIThigh MC populations were not statistically significant different for KIT D816V and control. (C) Quantitative RT-PCR data for KIT D816V and control ESCs and corresponding HPCs 11 days after CD34+ enrichment by MACS. Gene expression values were subjected to bidirectional clustering and are shown in heat map format (red and blue, high and low gene expression, respectively). (D) CFU assay for hematopoietic cells obtained from KIT D816V and control ESCs. Bars show mean ± standard deviation of 3 independent experiments. *P < .05, Welch’s t test. G, granulocyte; GM, granulocyte, macrophage; M, macrophage.
KIT D816V ESCs recapitulate the KIThighand erythroid phenotype of patient KIT D816V iPSCs. (A) Flow cytometry analysis of KIT D816V and control ESC-derived hematopoietic cells 11 days after CD34+ MACS selection (upper panels). Prominent CD235α+ and CD45+/KIThigh populations are observed in KIT D816V ESC–derived cells. Cytospin preparations of the same samples show nucleated erythrocytes (red arrowheads) (lower panels). Scale bars, 50 μm. (B) Quantification of hematopoietic cell populations (n = 4) derived from KIT D816V clone 1 and D816V clone 2 ESCs and control ESCs. KIT D816V ESCs show prominent CD45+/KIT+ and CD235+ populations. The CD45+/KIThigh MC populations were not statistically significant different for KIT D816V and control. (C) Quantitative RT-PCR data for KIT D816V and control ESCs and corresponding HPCs 11 days after CD34+ enrichment by MACS. Gene expression values were subjected to bidirectional clustering and are shown in heat map format (red and blue, high and low gene expression, respectively). (D) CFU assay for hematopoietic cells obtained from KIT D816V and control ESCs. Bars show mean ± standard deviation of 3 independent experiments. *P < .05, Welch’s t test. G, granulocyte; GM, granulocyte, macrophage; M, macrophage.
The TKI nintedanib targets KIT D816V hematopoietic cells
We next focused on identifying compounds that selectively target KIT D816V iPSC-derived hematopoietic cells. A library of 459 compounds was first tested on HMC-1 cell lines (supplemental Figure 10; supplemental Table 5), and selected compounds were further analyzed on iPSC-derived KIT D816V hematopoietic cells (Figure 3A-B). We identified nintedanib as a potent KIT D816V inhibitor, significantly reducing cell viability of KIT D816V hematopoietic cells from all 3 patients in the nanomolar range (50% inhibitory concentration [IC50]D816V = 27.5-104.9 nM; IC50control = 262.1-541.7 nM). We also included midostaurin and imatinib in our studies, because midostaurin is used to treat patients with advanced SM, whereas imatinib is ineffective in KIT D816V SM.15-17,20 Nintedanib and midostaurin showed similar potency on KIT D816V cells, and, as expected, imatinib was essentially ineffective. Rigosertib, an RAS mimetic compound, was also tested because oncogenic RAS mutations are commonly reported in hematologic malignancies, including SM.2,34 Rigosertib treatment of iPSC-derived cells showed no specificity for KIT D816V cells, and response was variable among patients (Figure 3B).

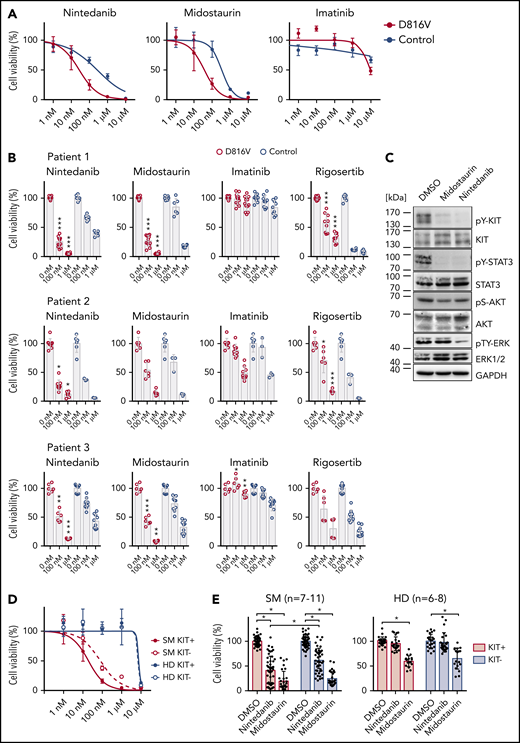
Compound testing on KIT D816V iPSC/ESC-derived hematopoietic cells and evaluation of effect of nintedanib on SM patient samples. (A) Drug response curves (0-10 μM) for nintedanib, midostaurin, and imatinib on KIT D816V (n = 1-4) and control (n = 2) iPSC-derived KIT+ hematopoietic cells from patient 1. IC50 values were calculated based on averaged titration curves obtained for cells derived from different iPSC lines. IC50 values for nintedanib were 27 to 105 nM for KIT D816V cells and 262 to 542 nM for control cells. (B) Averaged drug response ± standard deviation of KIT D816V and control iPSC-derived KIT+ cells treated with 100 nM or 1 μM nintedanib, midostaurin, imatinib, or rigosertib for 66 hours. Vehicle (DMSO)-treated cells were used as control (0 nM). Patient 1: n = 6-12. Patient 2: n = 3-9. Patient 3: n = 6-9. *P ≤ .05, **P < .001, ***P ≤ .0001, drug responses of KIT D816V vs control KIT+ cells at the same drug concentration, Welch’s t test. (C) Representative western blot analysis of KIT receptor signaling upon nintedanib or midostaurin treatment of KIT D816V iPSC–derived hematopoietic cells. Cells were treated with 1 μM compound for 4 hours prior to analysis. Vehicle (DMSO)-treated cells were used as control. Positions of molecular weight markers are indicated. (D) Nintedanib response curves (0-10 µM) for SM primary sample (patient 10) and a healthy donor (HD; n = 2). MNCs were subjected to MACS, and KIT+ and KIT− cells were treated with nintedanib for 66 hours, followed by viability measurement using a CellTiter Glo assay. Vehicle (DMSO)-treated cells were used as control. Nintedanib shows cytotoxicity to healthy donor cells only at concentrations closer to 10 µM, whereas cell viability is severely compromised at concentrations > 100 nM. (E) Averaged response of 7 to 11 SM primary samples and 6 to 8 HD primary samples to 1 µM nintedanib or midostaurin treatment. MNCs were treated as described in (D). Nintedanib treatment led to a significant decrease in the viability of KIT+ SM MNCs, whereas midostaurin targeted KIT+ and KIT− cells equally. Additionally, nintedanib did not have a significant impact on the viability of HD cells, in contrast to midostaurin, which led to a significant reduction in the viability of KIT+ and KIT− HD cells. *P ≤ .0003, Welch’s t test.
Compound testing on KIT D816V iPSC/ESC-derived hematopoietic cells and evaluation of effect of nintedanib on SM patient samples. (A) Drug response curves (0-10 μM) for nintedanib, midostaurin, and imatinib on KIT D816V (n = 1-4) and control (n = 2) iPSC-derived KIT+ hematopoietic cells from patient 1. IC50 values were calculated based on averaged titration curves obtained for cells derived from different iPSC lines. IC50 values for nintedanib were 27 to 105 nM for KIT D816V cells and 262 to 542 nM for control cells. (B) Averaged drug response ± standard deviation of KIT D816V and control iPSC-derived KIT+ cells treated with 100 nM or 1 μM nintedanib, midostaurin, imatinib, or rigosertib for 66 hours. Vehicle (DMSO)-treated cells were used as control (0 nM). Patient 1: n = 6-12. Patient 2: n = 3-9. Patient 3: n = 6-9. *P ≤ .05, **P < .001, ***P ≤ .0001, drug responses of KIT D816V vs control KIT+ cells at the same drug concentration, Welch’s t test. (C) Representative western blot analysis of KIT receptor signaling upon nintedanib or midostaurin treatment of KIT D816V iPSC–derived hematopoietic cells. Cells were treated with 1 μM compound for 4 hours prior to analysis. Vehicle (DMSO)-treated cells were used as control. Positions of molecular weight markers are indicated. (D) Nintedanib response curves (0-10 µM) for SM primary sample (patient 10) and a healthy donor (HD; n = 2). MNCs were subjected to MACS, and KIT+ and KIT− cells were treated with nintedanib for 66 hours, followed by viability measurement using a CellTiter Glo assay. Vehicle (DMSO)-treated cells were used as control. Nintedanib shows cytotoxicity to healthy donor cells only at concentrations closer to 10 µM, whereas cell viability is severely compromised at concentrations > 100 nM. (E) Averaged response of 7 to 11 SM primary samples and 6 to 8 HD primary samples to 1 µM nintedanib or midostaurin treatment. MNCs were treated as described in (D). Nintedanib treatment led to a significant decrease in the viability of KIT+ SM MNCs, whereas midostaurin targeted KIT+ and KIT− cells equally. Additionally, nintedanib did not have a significant impact on the viability of HD cells, in contrast to midostaurin, which led to a significant reduction in the viability of KIT+ and KIT− HD cells. *P ≤ .0003, Welch’s t test.
We further compared drug responses of KIT+ and KIT− cells and observed selective targeting of KIT+ cells by nintedanib and midostaurin, which was more pronounced in KIT D816V cells than in control cells (supplemental Figure 11A). Western blot analysis of iPSC-derived cells treated with nintedanib or midostaurin revealed an efficient reduction in KIT and STAT3 phosphorylation; those effects were more pronounced in nintedanib-treated samples, in which a significant reduction in total KIT protein was observed (Figure 3C; supplemental Figure 12).
Importantly, nintedanib and midostaurin activity and higher selectivity for KIT+ over KIT− cells were also observed in KIT D816V ESC-derived cells (supplemental Figure 11B-D). Thus, KIT D816V ESC-derived cells fully recapitulate hematopoietic phenotypes and drug responses observed for KIT D816V iPSC-derived cells and further validate KIT D816V as a valuable target in SM.
To evaluate whether the origin and differentiation stage of iPSC-derived cells impact drug responses, we used MACS to select CD34+ HPCs from the hemogenic endothelium and expanded cells for an additional 10 to 20 days. Again, a strong reduction in the viability of KIT+ mutated cells was observed upon treatment with nintedanib or midostaurin (supplemental Figure 13A-C). Additionally, CD34+ HPCs displayed the same cell fate bias as did cells obtained directly from iPSCs, such as the erythroid bias observed in patient 1 (supplemental Figure 13D).
We further compared the response of KIT D186V iPSC-derived hematopoietic cells to nintedanib, avapritinib (BLU-2815), or ripretinib (DCC-2618), because the latter 2 compounds are being evaluated in clinical trials for advanced SM.19-21,35 Avapritinib and ripretinib effectively reduced viability of the HMC-1.1 and HMC-1.2 cell lines and phosphorylation of KIT, STAT5, AKT, and ERK (supplemental Figure 14), which is in accordance with previous studies.19,21,35 Finally, as observed for nintedanib, avapritinib and ripretinib preferentially reduced the viability of iPSC-derived KIT D816V cells (supplemental Figure 15). These results show the selectivity of avapritinib and ripretinib for KIT D816V and validate the robustness of the KIT D816V iPSC system established in this study.
Next, we assessed the impact of nintedanib treatment on the viability of KIT D816V/H and KIT S476I SM primary samples. A reduction in cell viability ≥50% was observed for 6 of 9 primary mononuclear cell (MNC) samples (supplemental Figure 16A; supplemental Table 6). Additionally, nintedanib preferentially targeted KIT+ primary MNCs over KIT− primary MNCs, leading to a reduction in cell viability ≥50% in 6 of 11 primary samples. In contrast, midostaurin showed less selectivity and affected KIT+ and KIT− primary cells from SM patients and healthy donors (Figure 3D-E; supplemental Figure 16B; supplemental Table 6). Nintedanib treatment led to a reduction in KIT D816V allele burden in SM MNCs (supplemental Figure 16C), and the degree of response to nintedanib correlated positively with KIT D816V/H mutational burden (supplemental Figure 17A). Western blot analysis showed a strong reduction in KIT, STAT5, and ERK phosphorylation in a KIT D816H SM primary sample upon treatment with nintedanib (1 µM) (supplemental Figure 17B), in agreement with the data obtained using our iPSC-based model.
KIT D816V iPSC-derived MCs are targeted by nintedanib
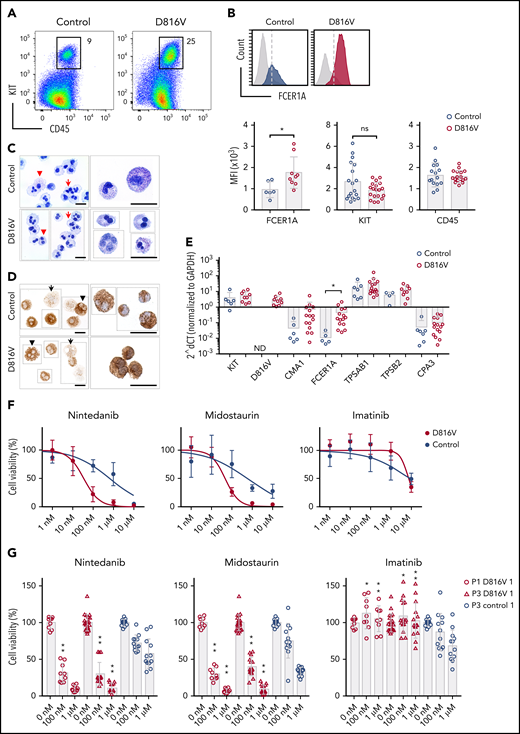
A CD45+/KIThigh MC population was obtained at later time points of hematopoietic differentiation for all KIT D816V and control iPSCs lines used in this study (Figure 4A). KIT D816V MCs showed higher surface and gene expression of FCER1A than did control cells, whereas no differences were observed for CD45 and KIT (Figure 4B,E). Fluorescence-activated cell sorting (FACS)-purified MCs revealed a homogenous cell population with multilobulated nuclei and some larger cells with metachromatic and tryptase-positive cytoplasmic granules, features of immature MCs (Figure 4C-D; supplemental Figure 18). Quantitative RT-PCR analysis showed high expression of tryptase gene products TPSAB1 and TPSB2, whereas carboxypeptidase A3 and CMA1 mRNA expression was rather low (Figure 4E).

Nintedanib targets KIT D816V MCs. (A) Flow cytometry analysis of KIT D816V and control iPSC-derived CD45+/KIThigh MCs at >30 days of differentiation (patient 1). (B) KIT D816V MCs (red) show higher expression of FCER1A compared with control cells (blue) (upper panel; dashed line is shown as a reference). Mean fluorescence intensity (MFI) of FCER1A (n = 6-9), KIT (n = 18-19), and CD45 (n = 15-17) on KIT D816V MCs and controls (lower panels) * P = .017, Welch’s t test. (C) Representative composite images of acidic toluidine blue–stained cytospins (left panels) or smears (right panels) of FACS-sorted KIT D816V and control MCs (image assembly indicated by dotted lines). Homogenous population of multilobulated promastocytes with (arrowheads) or without (arrows) metachromatic granules were observed. Scale bars, 25 μm. (D) Same as in (C), but stained for tryptase. Cells with high (arrowheads) and low (arrows) number of tryptase-positive granules were observed. Scale bars, 25 μm. For full representative images of (C) and (D) see supplemental Figure 18. (E) Quantitative RT-PCR analysis for KIT D816V and control FACS-sorted MCs (n = 9-15 and n = 3-7, respectively). mRNA expression of MC-specific chymase 1 (CMA1), tryptase α/β 1 (TPSAB1), tryptase β2 (TPSB2), carboxypeptidase A3 (CPA3), FCER1A, and KIT is depicted. KIT D816V MCs show higher FCER1A mRNA expression compared with unmutated KIT cells. *P = .014, Welch’s t test. (F) Drug response curves of FACS-sorted KIT D816V and control MCs (n = 5 and n = 4, respectively, derived from 2 KIT D816V iPSC lines and 1 control iPSC line) treated with nintedanib, midostaurin, or imatinib. Nintedanib IC50 values were 34 and 633 nM for KIT D816V and control cells, respectively. Midostaurin IC50 values were 48 and 570 nM for KIT D816V and control cells, respectively. (G) Averaged drug response ± standard deviation of KIT D816V and control iPSC–derived FACS sorted MCs (n = 9-15 and n = 12, respectively) treated with 100 nM or 1 μM nintedanib, midostaurin, or imatinib. *P = .02, **P ≤ .0006, drug responses of KIT D816V vs control MCs at the same drug concentration, Welch’s t test. ns, not significant.
Nintedanib targets KIT D816V MCs. (A) Flow cytometry analysis of KIT D816V and control iPSC-derived CD45+/KIThigh MCs at >30 days of differentiation (patient 1). (B) KIT D816V MCs (red) show higher expression of FCER1A compared with control cells (blue) (upper panel; dashed line is shown as a reference). Mean fluorescence intensity (MFI) of FCER1A (n = 6-9), KIT (n = 18-19), and CD45 (n = 15-17) on KIT D816V MCs and controls (lower panels) * P = .017, Welch’s t test. (C) Representative composite images of acidic toluidine blue–stained cytospins (left panels) or smears (right panels) of FACS-sorted KIT D816V and control MCs (image assembly indicated by dotted lines). Homogenous population of multilobulated promastocytes with (arrowheads) or without (arrows) metachromatic granules were observed. Scale bars, 25 μm. (D) Same as in (C), but stained for tryptase. Cells with high (arrowheads) and low (arrows) number of tryptase-positive granules were observed. Scale bars, 25 μm. For full representative images of (C) and (D) see supplemental Figure 18. (E) Quantitative RT-PCR analysis for KIT D816V and control FACS-sorted MCs (n = 9-15 and n = 3-7, respectively). mRNA expression of MC-specific chymase 1 (CMA1), tryptase α/β 1 (TPSAB1), tryptase β2 (TPSB2), carboxypeptidase A3 (CPA3), FCER1A, and KIT is depicted. KIT D816V MCs show higher FCER1A mRNA expression compared with unmutated KIT cells. *P = .014, Welch’s t test. (F) Drug response curves of FACS-sorted KIT D816V and control MCs (n = 5 and n = 4, respectively, derived from 2 KIT D816V iPSC lines and 1 control iPSC line) treated with nintedanib, midostaurin, or imatinib. Nintedanib IC50 values were 34 and 633 nM for KIT D816V and control cells, respectively. Midostaurin IC50 values were 48 and 570 nM for KIT D816V and control cells, respectively. (G) Averaged drug response ± standard deviation of KIT D816V and control iPSC–derived FACS sorted MCs (n = 9-15 and n = 12, respectively) treated with 100 nM or 1 μM nintedanib, midostaurin, or imatinib. *P = .02, **P ≤ .0006, drug responses of KIT D816V vs control MCs at the same drug concentration, Welch’s t test. ns, not significant.
Importantly, as observed for hematopoietic progenitor cells, KIT D816V MCs exhibited a remarkable reduction in cell viability upon treatment with nintedanib in comparison with control cells (patient 1 IC50D816V = 34.7 nM; patient 3 IC50D816V = 34.6 nM; patient 1 IC50control = 633.2 nM; Figure 4F-G).
In agreement with our data from iPSC-derived MCs, ROSA KIT D816V MCs36 responded strongly to nintedanib in vitro (supplemental Figure 19A). Treatment of ROSA KIT D816V–engrafted NSG mice with nintedanib led to a reduction in that cell population in peripheral blood and spleen, whereas no effect was observed in BM (supplemental Figure 19B-D).
Nintedanib preferentially targets iPSC-derived hematopoietic cells over iPSC-derived endothelial cells
Nintedanib was initially developed as an inhibitor of vascular endothelial growth factor receptors (VEGFRs), which are crucial for the development and function of endothelial cells.37,38 Increased angiogenesis in BM MC infiltrates is a key histopathological feature in SM patients.39 Therefore, we determined the impact of nintedanib on endothelial cells derived from SM KIT D816V and control iPSCs (Figure 5A). KIT D816V and control iPSC-derived endothelial cells expressed CD31, CD34, CD105, CD144, and KIT and were capable of lipid (acetylated LDL) uptake (Figure 5B-E). Nintedanib reduced the viability of KIT D816V and control endothelial cells, and significant differences in the drug response were observed with 1 µM of the compound (Figure 5F). Nintedanib activity on iPSC-derived cells was comparable to that observed on human BM–derived endothelial cells (supplemental Figure 20). Importantly, cytotoxic effects were 20-fold to 100-fold more pronounced on iPSC-derived hematopoietic progenitor cells and MCs than on endothelial cells, regardless of the presence of the KIT D816V mutation (Figure 5G).
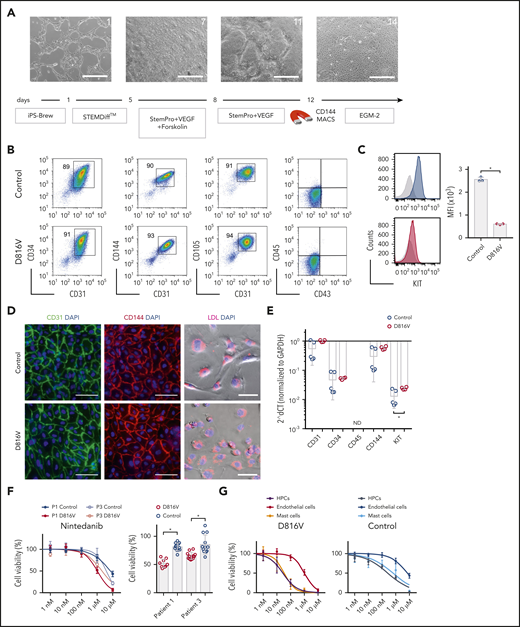
Evaluation of nintedanib activity on iPSC-derived endothelial cells. (A) Endothelial differentiation for KIT D816V or control iPSCs. Representative phase-contrast microscopy images of days 1, 7, 11, and 14 are shown. Scale bars, 500 μm. (B) KIT D816V and control iPSC–derived endothelial cells express CD34, CD31, CD105, and CD144 endothelial markers but lack CD45 and CD43 expression. (C) KIT D816V endothelial cells (red) have lower surface KIT receptor expression compared with control cells (blue), as shown by representative graphs; isotype control is shown in gray (n = 3) *P = .0005. (D) Immunofluorescence staining of KIT D816V and control endothelial cells showed homogenous surface expression of CD31 (left panels) and CD144 (middle panels). Cells effectively absorbed Dil-conjugated acetylated LDL (right panels). Nuclei were stained with 4′,6-diamidino-2-phenylindole (DAPI; blue). Scale bars, 100 μm. (E) Quantitative RT-PCR data show similar expression of CD31, CD34, and CD144 in KIT D816V and control endothelial cells. KIT mRNA expression was slightly higher in mutated cells (n= 4-5). *P = .03. (F) KIT D816V and control endothelial cells derived from patients 1 and 3 iPSCs showed similar nintedanib response curves (left panel; n = 2-3). Patient 1 (P1), IC50D816V = 1632 nM and IC50control = 7003 nM; patient 3 (P3), IC50D816V = 2073 nM and IC50control=3803 nM). KIT D816V endothelial cells were more affected by 1 µM nintedanib treatment than were unmutated cells (right panel; n = 3-4). *P < .01, Welch’s t test. (G) Comparison of drug response curves obtained for KIT D816V (left panel) or control (right panel) endothelial cells (n = 2-3), HPCs (from Figure 3), and MCs (from Figure 4) treated with nintedanib (1 nM to 10 µM). ND, not detected.
Evaluation of nintedanib activity on iPSC-derived endothelial cells. (A) Endothelial differentiation for KIT D816V or control iPSCs. Representative phase-contrast microscopy images of days 1, 7, 11, and 14 are shown. Scale bars, 500 μm. (B) KIT D816V and control iPSC–derived endothelial cells express CD34, CD31, CD105, and CD144 endothelial markers but lack CD45 and CD43 expression. (C) KIT D816V endothelial cells (red) have lower surface KIT receptor expression compared with control cells (blue), as shown by representative graphs; isotype control is shown in gray (n = 3) *P = .0005. (D) Immunofluorescence staining of KIT D816V and control endothelial cells showed homogenous surface expression of CD31 (left panels) and CD144 (middle panels). Cells effectively absorbed Dil-conjugated acetylated LDL (right panels). Nuclei were stained with 4′,6-diamidino-2-phenylindole (DAPI; blue). Scale bars, 100 μm. (E) Quantitative RT-PCR data show similar expression of CD31, CD34, and CD144 in KIT D816V and control endothelial cells. KIT mRNA expression was slightly higher in mutated cells (n= 4-5). *P = .03. (F) KIT D816V and control endothelial cells derived from patients 1 and 3 iPSCs showed similar nintedanib response curves (left panel; n = 2-3). Patient 1 (P1), IC50D816V = 1632 nM and IC50control = 7003 nM; patient 3 (P3), IC50D816V = 2073 nM and IC50control=3803 nM). KIT D816V endothelial cells were more affected by 1 µM nintedanib treatment than were unmutated cells (right panel; n = 3-4). *P < .01, Welch’s t test. (G) Comparison of drug response curves obtained for KIT D816V (left panel) or control (right panel) endothelial cells (n = 2-3), HPCs (from Figure 3), and MCs (from Figure 4) treated with nintedanib (1 nM to 10 µM). ND, not detected.
Nintedanib occupies the ATP binding site in KIT D816V
Nintedanib is an indolinone derivative type II kinase inhibitor of VEGFR, platelet-derived growth factor receptor (PDGFR), and fibroblast growth factor receptor.37,38 It binds to the adenosine triphosphate (ATP) binding site cleft between the C- and N-terminal lobes of the VEGFR kinase domain.37 Thus, we compared the nintedanib binding site in VEGFR2 (PDB code 3C7Q) with the ATP binding sites of all available structures of KIT (unmutated and KIT D816V; supplemental Figure 21A). Our analysis revealed the geometrical similarity of VEGFR2 and KIT and steric fitting of nintedanib into the inactive KIT receptor, in agreement with the biological data reported in this study. Induced fit molecular docking studies showed that, on average, nintedanib has a higher affinity (evaluated here as Glide Score) for inactive KIT D816V (based on PDB code 3G0F) than for unmutated KIT, either in its inactive or active state (PDB code 3G0E and 1PKG, respectively; supplemental Figure 21B). Nintedanib preferentially binds to KIT D816V by orienting the indole moiety toward the A-loop and the methylpiperazine moiety toward the C-terminal region (supplemental Figure 22).
Further analysis revealed that midostaurin and avapritinib display higher affinity for the active unmutated KIT receptor and poor affinity for inactive KIT (unmutated or KIT D816V), whereas ripretinib and imatinib showed a preference for inactive KIT (unmutated or KIT D816V) over the active conformation (supplemental Figures 21B and 23), in agreement with previous reports.19,40
Nintedanib analogs are potent KIT D816V inhibitors
To further extend the structure-function relationship between nintedanib and KIT D816V, we screened a library of 43 nintedanib analogs with 80% to 98% structural similarity to nintedanib (supplemental Table 7). Compounds were tested on KIT D816V and control iPSC-derived hematopoietic cells; 7 of them preferentially targeted KIT D816V cells (Figure 6A). Four compounds (BIBG1724TF, BIBF1496XX, BIBE3315BS, and BIBE3316BS) were further evaluated and showed IC50 values similar to nintedanib (Figure 6B-C).
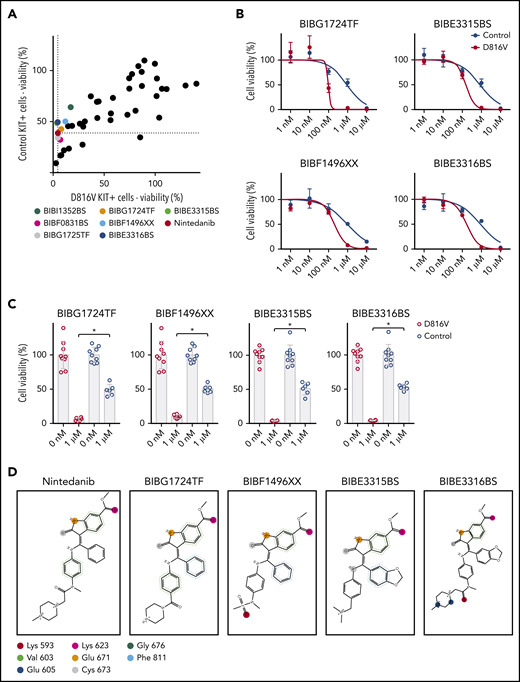
Nintedanib analogs target KIT D816V hematopoietic cells. (A) The impact of 43 nintedanib analogs on KIT D816V and control iPSC–derived hematopoietic cells was determined using CellTiter Glo assays (1 µM of compound) and is shown as the percentage of untreated cells. KIT D816V selective compounds are highlighted and color coded. Dotted lines indicate response to nintedanib treatment. (B) Representative drug response curves for KIT D816V and control iPSC–derived hematopoietic cells treated with BIBG1724TF, BIBE3315BS, BIBF1496XX, or BIBE3316BS. IC50 values were 96 to 203 nM and 849 to 917 nM for KIT D816V and control cells, respectively. (C) Averaged drug response ± standard deviation of KIT D816V iPSC–derived hematopoietic cells treated with 1 µM BIBG1724TF, BIBF1496XX, BIBE3315BS, or BIBE3316BS show a significant decrease in cell viability in comparison with treated control cells (n = 6-9). *P < .0001, Welch’s t test. (D) Structures and interactions based on protein-ligand interaction fingerprint, as described in supplemental Figure 24B. Lys593, Glu605, Lys623, Glu671, and Cys673 establish H-bond interactions with the ligands. Val603/Gly676 and Phe811 establish H-arene interactions and aromatic interactions, respectively, with the aromatic moieties of the ligands. These interactions are represented as circles because they are spread over all of the atoms of the aromatic rings. The colors uniquely identify each residue but do not refer to the kind of interaction established.
Nintedanib analogs target KIT D816V hematopoietic cells. (A) The impact of 43 nintedanib analogs on KIT D816V and control iPSC–derived hematopoietic cells was determined using CellTiter Glo assays (1 µM of compound) and is shown as the percentage of untreated cells. KIT D816V selective compounds are highlighted and color coded. Dotted lines indicate response to nintedanib treatment. (B) Representative drug response curves for KIT D816V and control iPSC–derived hematopoietic cells treated with BIBG1724TF, BIBE3315BS, BIBF1496XX, or BIBE3316BS. IC50 values were 96 to 203 nM and 849 to 917 nM for KIT D816V and control cells, respectively. (C) Averaged drug response ± standard deviation of KIT D816V iPSC–derived hematopoietic cells treated with 1 µM BIBG1724TF, BIBF1496XX, BIBE3315BS, or BIBE3316BS show a significant decrease in cell viability in comparison with treated control cells (n = 6-9). *P < .0001, Welch’s t test. (D) Structures and interactions based on protein-ligand interaction fingerprint, as described in supplemental Figure 24B. Lys593, Glu605, Lys623, Glu671, and Cys673 establish H-bond interactions with the ligands. Val603/Gly676 and Phe811 establish H-arene interactions and aromatic interactions, respectively, with the aromatic moieties of the ligands. These interactions are represented as circles because they are spread over all of the atoms of the aromatic rings. The colors uniquely identify each residue but do not refer to the kind of interaction established.
To rationalize, at the molecular level, the observed activity of nintedanib derivatives, we modeled these compounds against KIT D816V and unmutated KIT structures by performing induced fit molecular docking calculations. All nintedanib derivatives displayed the highest Glide Scores for KIT D816V in comparison with unmutated KIT, suggesting preferential binding to the mutated receptor (supplemental Figure 24A), which agrees with our assays on KIT D816V cells. When bound to KIT D816V, BIBG1724TF, BIBF1496XX, BIBE3315BS, and BIBE3316BS located their indole-like moiety toward the A-loop in a similar position as the indole moiety of nintedanib, and they established similar molecular contacts with the same amino acid residues in KIT D186V (Figure 6D; supplemental Figure 24B).
Discussion
We report that, upon differentiation into hematopoietic progenitor cells and MCs, KIT D816V iPSCs from ASM and MCL patients recapitulate the SM phenotype. In this model, drug screening identified nintedanib (Vargatef, Ofev) as a potent TKI targeting KIT D816V neoplastic cells from patient-specific iPSCs, gene-edited ESCs, and primary SM samples.
KIT D816V iPSCs harbor concurring mutations in genes such as TET2, NEF2, NRAS, SRSF2, and RUNX1, thereby reflecting the clonal composition of patient samples and SM heterogeneity. The impact of these mutations was observed during in vitro differentiation, as iPSCs harboring KIT D816V and NFE2 mutations presented an erythroid-biased hematopoiesis. This is in line with a reported case of KIT D816V SM-AHD with associated acute erythroid leukemia.41 Mutations in TET2, RUNX1, and SRSF2 in patient 2 iPSCs led to myeloid-biased hematopoiesis and pronounced apoptosis, in agreement with published data and the myelodysplastic syndrome diagnosed for this patient.42-46
Nintedanib is a type II kinase inhibitor being used for the treatment of non–small cell lung cancer and idiopathic pulmonary fibrosis.37,38,47 Importantly, nintedanib has a manageable safety and tolerability profile with long-term use in pulmonary fibrosis patients.48 Nintedanib treatment decreased the viability of KIT-expressing iPSC-derived hematopoietic cells and strongly reduced KIT and STAT3 phosphorylation, in agreement with the important role for STAT proteins in downstream signaling of oncogenic KIT.49 KIT D816V iPSC-derived cells were also targeted by midostaurin, avapritinib (BLU-285), and ripretinib (DCC-2618), in agreement with previous reports and clinical trials for these compounds.17,19-21 Importantly, nintedanib compromised cell viability of SM patient samples and blocked KIT D816V phosphorylation and signaling in primary patient cells.
Molecular docking studies further corroborated our drug screening data and revealed that nintedanib preferentially binds to the ATP binding pocket of inactive KIT D816V. We also identified additional nintedanib analogs with KIT D816V selectivity and mapped key residues in the ATP binding pocket for interaction with the indole moiety of these compounds. This information should be useful for studies on guided chemical enhancement of nintedanib-based compounds by tailoring specific ligand-receptor interactions to increase compound affinity and specificity.
The iPSC-based disease model also enabled us to evaluate the impact of KIT D816V on MCs. KIT D816V was correlated with a more accelerated and prominent development of MCs during hematopoietic differentiation of iPSCs, in agreement with the abnormal MC expansion and infiltration observed in SM. No morphological difference was observed between KIT D816V and control MCs, but KIT D816V MCs exhibited higher expression and surface levels of FCER1A, reflecting accelerated MC development and maturation. Most importantly, KIT D816V iPSC-derived MCs were also targeted efficiently by nintedanib.
We further exploited our SM iPSC panel to evaluate the potential cytotoxic effects of nintedanib on endothelial cells, because this compound was initially developed as an inhibitor for VEGFR, a key receptor for endothelial cell development and function.37,38 Interestingly, nintedanib preferentially targeted iPSC-derived hematopoietic cells and MCs over iPSC-derived endothelial cells. These results demonstrate the versatility of our iPSC-based disease model.
One limitation of our SM disease model is the permanent presence of the KIT D816V and associated mutations in iPSCs and in all cells derived therefrom. Thus, KIT D816V iPSCs represent a snapshot of a particular disease state, and their differentiation into KIT D816V hematopoietic progenitors and MCs does not mirror SM disease progression. In this context, whether the KIT D816V mutation is an early or late event in SM pathogenesis is under debate. Jawhar et al identified KIT D816V as a late event following TET2, SRSF2, and ASXL1 mutations.23 Grootens et al, using single-cell RNA sequencing of SM patient samples, identified KIT D816V in hematopoietic stem cells, as well as in lineage-primed progenitors and MCs.50 More recently, leukemic stem cells for MCL were reported to reside in the CD34+/CD38− fraction of the malignant clone.51 In light of these reports, our iPSC-based SM disease model stands as a powerful tool for the systematic evaluation of KIT D816V’s impact on the different stages of hematopoiesis.
In summary, we report on the first iPSC-based model for SM and envision an expansion of our library of SM-derived iPSCs with KIT D816V and associated mutations to provide an even more comprehensive array of SM disease models. Additionally, nintedanib, identified in this study as an effective KIT D816V inhibitor, is already in clinical use; thus, it should be considered an additional and/or alternative option for the treatment of advanced SM.
For original data and study protocol, please contact Martin Zenke (martin.zenke@rwth-aachen.de).
The online version of this article contains a data supplement.
The publication costs of this article were defrayed in part by page charge payment. Therefore, and solely to indicate this fact, this article is hereby marked “advertisement” in accordance with 18 USC section 1734.
Acknowledgments
The authors thank Ursula Gollan for cytogenetic analysis; Saskia Mitzka for gene expression analysis; the Interdisciplinary Center for Clinical Research Aachen FACS Core Facility and Transgenic Service Facility, Faculty of Medicine, RWTH Aachen University; Katrin Götz and Gülcan Aydin for cell sorting; Thomas Hieronymus for initial work on NSG mice; and Eveline Mierau for expert administrative assistance. The High-Throughput Biomedicine Unit, Institute of Molecular Medicine Finland, Helsinki, Finland is acknowledged for assistance. The authors also thank Michael Huber, Thomas Wilhelm, and Matthias Begemann for discussions and advice, Michel Arock for ROSA KIT D816V cells, Anandhi Rajendiran and Stephan Dreschers for providing healthy donor buffy coat samples, and Jörg Eschweiler for providing hip bone samples.
This work was supported in part by funds from the German Research Foundation (Deutsche Forschungsgemeinschaft DFG BR1782/5-1, CH1509/1-1, KO2155/7-1, WA1706/12-1, and ZE432/10-1) as part of the Clinical Research Unit CRU 344; the Ministry of Culture and Science of the German State of North Rhine-Westphalia; the European Regional Development Fund, Duesseldorf, Germany; Boehringer Ingelheim, Ingelheim, Germany; and ERS, RWTH Aachen University (M.Z.). M.A.S.T. was funded by a CAPES-Alexander von Humboldt postdoctoral fellowship (99999.001703/2014-05) and a donation from Ulrich Lehmann. M.G., N.C., and M.Z. were funded by IZKF Aachen. S.M.M. was supported by Finnish cancer organizations, the Sigrid Juselius Foundation, and a Finnish special governmental subsidy for health sciences, research and training (Helsinki, Finland). S.K. was supported by a grant from the German José Carreras Leukemia Foundation (DJCLS 16 R/2017). P.V. is supported by the Austrian Science Fund - SFB project F4704-B20.
Authorship
Contribution: M.A.S.T. designed and performed experiments and wrote the manuscript; M.G. designed and performed experiments; S.S. and F.K. performed experiments on iPSC generation and provided support on hematopoietic differentiation; M.A.S.T., A.E.I.H., and N.C. performed transplantation experiments into NSG mice and analyzed data; K.V.G. and G.E. provided patient samples, performed compound screening on primary samples, and provided support for data analysis; K.F. performed western blot experiments; R. Guareschi and G.R. performed molecular docking studies; A.S.S. provided support for immunohistochemistry analyses; O.M.J.D. and S.M.M. performed high-throughput drug screening experiments and analyzed data; A.M. performed NGS analyses; H.M.S. performed cytogenetic analyses; R. Goetzke and W.W. performed DNA methylation analyses; T.B. performed histological analysis; J.P. and A.K. provided patient samples and support for NGS data analyses; M.J. and A.R. provided patient samples; F.H. and P.E. provided nintedanib analogues and support for data analyses; S.K. and T.H.B. provided patient samples and support for data analyses; P.V. provided patient samples, support for data analyses, and wrote the manuscript; N.C. designed experiments, performed western blot analyses, and provide support for data analyses; M.Z. designed experiments, analyzed data, and wrote the manuscript; and all authors approved the final version of the manuscript for submission.
Conflict-of-interest disclosure: S.M.M. has received honoraria and research funding from Novartis, Pfizer, and Bristol Myers Squibb. W.W. is a cofounder of Cygenia GmbH, which provides services for Epi-Pluri-Score validation of iPSCs. P.V. consults for or is member of advisory boards for Novartis, Deciphera, and Blueprint. The remaining authors declare no competing financial interests.
Correspondence: Martin Zenke, Institute for Biomedical Engineering, Department of Cell Biology, RWTH Aachen University Medical School, Pauwelsstr 30, 52074 Aachen, Germany; e-mail: martin.zenke@rwth-aachen.de.