Key Points
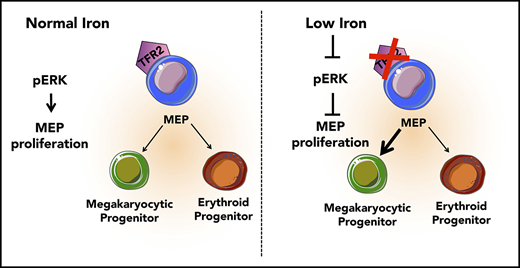
Low iron in the environment promotes megakaryocytic commitment of MEPs.
MEPs from mice with iron deficiency anemia show decreased proliferation and decreased ERK phosphorylation.

Abstract
The mechanisms underlying thrombocytosis in patients with iron deficiency anemia remain unknown. Here, we present findings that support the hypothesis that low iron biases the commitment of megakaryocytic (Mk)-erythroid progenitors (MEPs) toward the Mk lineage in both human and mouse. In MEPs of transmembrane serine protease 6 knockout (Tmprss6−/−) mice, which exhibit iron deficiency anemia and thrombocytosis, we observed a Mk bias, decreased labile iron, and decreased proliferation relative to wild-type (WT) MEPs. Bone marrow transplantation assays suggest that systemic iron deficiency, rather than a local role for Tmprss6−/− in hematopoietic cells, contributes to the MEP lineage commitment bias observed in Tmprss6−/− mice. Nontransgenic mice with acquired iron deficiency anemia also show thrombocytosis and Mk-biased MEPs. Gene expression analysis reveals that messenger RNAs encoding genes involved in metabolic, vascular endothelial growth factor, and extracellular signal-regulated kinase (ERK) pathways are enriched in Tmprss6−/− vs WT MEPs. Corroborating our findings from the murine models of iron deficiency anemia, primary human MEPs exhibit decreased proliferation and Mk-biased commitment after knockdown of transferrin receptor 2, a putative iron sensor. Signal transduction analyses reveal that both human and murine MEP have lower levels of phospho-ERK1/2 in iron-deficient conditions compared with controls. These data are consistent with a model in which low iron in the marrow environment affects MEP metabolism, attenuates ERK signaling, slows proliferation, and biases MEPs toward Mk lineage commitment.
Introduction
Iron deficiency, the most common nutritional deficiency worldwide, causes anemia, growth retardation, and cognitive impairment.1 Iron deficiency anemia can be associated with elevated platelet counts through mechanisms that are not well understood.2 Iron metabolism is highly conserved in humans and mice, supporting the rationale for using mice as a model to study the pathophysiological consequences of iron deficiency. Here, we used iron deficiency anemia achieved in mice through dietary manipulation3 as well as in mice with genetic defects that impair dietary iron uptake to study the physiological consequences of iron deficiency. Transmembrane serine protease 6 knockout (Tmprss6−/−) mice, a model of the human disorder iron-refractory iron deficiency anemia (IRIDA),4 have impaired intestinal iron absorption leading to systemic iron deficiency, hypoferremia, and microcytic anemia.5,6 TMPRSS6 is a hepatic transmembrane serine protease7 that decreases hepatic production of hepcidin, a peptide hormone that inhibits transport of iron from enterocytes into the plasma. Accordingly, Tmprss6−/− mice, like patients with IRIDA, have inappropriately elevated hepcidin levels that limit dietary iron uptake and lead to anemia.4-6
We focus on determining the underlying cause of the thrombocytosis that can occur with iron deficiency anemia.2 It has been proposed, but not supported experimentally, that this increase in platelets is due to stimulation of megakaryocytic (Mk) progenitors by erythropoietin (EPO).8 However, EPO levels correlate poorly with platelet counts9 and can be elevated in the absence of thrombocytosis.10,11 Iron replacement therapy decreases the thrombocytosis associated with iron deficiency, even in patients receiving EPO treatment.8 Studies also show that iron deficiency leads to decreased megakaryocyte proliferation and increased ploidy by a thrombopoietin-independent, possibly HIF2 and vascular endothelial growth factor (VEGF)–dependent, mechanism.12,13 Interestingly, these studies observed cellular alterations in the bone marrow (BM) composition that were suggestive of increased flux through the Mk lineage rather than increased Mk progenitor numbers, suggesting enhanced commitment of a hematopoietic progenitor population upstream of the Mk lineage.12
The Mk-erythroid progenitor (MEP) represents a transitional state that is permissive for a bipotent fate decision to generate unipotent progenitors of the Mk or erythroid lineages,14 each of which is affected in iron deficiency anemia. Here, we address whether thrombocytosis in iron deficiency anemia is related to altered commitment of MEPs by assessing the effects of low iron conditions on the lineage output, gene expression, and signaling of MEP.
Methods
Mice
All animal studies were approved by the Institutional Animal Care and Use Committee of either Yale University (protocol 2016-11578) or Boston Children’s Hospital (protocol 16-07-3213R). B6.129P2-Tmprss6tm1Dgen/Crl mice were generated as previously described in Finberg et al15 and backcrossed to C57BL/6N mice for >20 generations. C57BL/6N control mice were purchased from Charles River. Mice were housed in the Yale Animal Resources Center and maintained on a 200 ppm iron diet (Teklad 2018S, Envigo). Food and water were provided ad libitum. For iron-deficient (ID) diet studies, 129S6/SvEvTac mice purchased from Taconic were maintained in the animal facility at Boston Children’s Hospital. Female pups were weaned onto either a control diet (∼50 ppm iron; TD120277, Envigo) or an ID diet (<5 ppm iron; TD120276, Envigo). Nine weeks after weaning, females were paired with wild-type (WT) males for timed pregnancies. Pregnant mice between embryonic day 13.5 (E13.5) and E16.5 were anesthetized by ketamine injection, and blood samples were collected for complete blood counts. Animals were subsequently euthanized by carbon dioxide asphyxiation.
Flow cytometric analysis and cell sorting
To verify that the platelet count was accurate and not inflated by microcytic red blood cells (RBCs) contaminating the platelet gate, the frequency of CD41+ and Ter119+ peripheral blood cells was measured by fluorescence-activated cell sorter analysis on an LSRII cytometer.16 Platelet numbers per microliter were calculated as follows: [%CD41+/(%CD41+ + %Ter119+)] × [platelet number + RBC number from the automated cell counter].16
Human MEPs were isolated from human granulocyte colony-stimulating factor mobilized peripheral blood that was CD34 enriched (CliniMACS, Miltenyi; obtained from the Yale Cooperative Center of Excellence in Hematology) as previously described in Sanada et al.17 Lin−CD34+CD38midCD45RA−FLT3−MPL+CD41− cells were collected in culture medium and counted for cell concentration and postsort viability (range, 70% to 95%).
Murine MEPs were isolated from BM of adult mice using a panel of antibodies.18 See supplemental Methods (available on the Blood Web site) for more detailed information regarding the methods and antibodies used. Hematopoietic stem cells (HSCs) were identified as Lin−cKit+Sca+CD150+CD105+, granulocyte/monocyte progenitors as Lin−Sca−c-Kit+FcgRI/II+, enriched murine MEPs (also known as PreMegEs) as Lin−cKit+Sca−CD41−FcgR−/loCD150+CD105−, Mk progenitors as Lin−cKit+Sca−CD150+CD41+, and erythroid progenitors as Lin−cKit+Sca−CD150+FcgRI/II−CD105+.19 Cells were collected in culture medium and counted for cell concentration and postsort viability (range, 70% to 95%).
DNA content analysis was performed as described previously in Smith et al.20
Evaluation of intracellular iron status
BM cells were stained with 0.125 μM calcein-AM (Sigma) in phosphate-buffered saline (PBS) for 5 minutes at 37°C and then washed with PBS. The calcein-loaded cells were further stained with antibodies to surface markers for 30 minutes on ice, washed, incubated for 20 minutes on ice in PBS with or without 100 μM of the chelator 2,2′-bipyridyl (Sigma), and analyzed with an LSRII flow cytometer. The labile iron pool (LIP) for each population was calculated as the calcein-AM mean fluorescence intensity (MFI) with 2,2-bipyridyl minus the MFI without 2,2-bipyridyl (control).21
Colony-formation assays
Dual Mk/erythroid colony assays were performed as described previously in Sanada et al.17 Human MEPs were cultured in collagen-based medium with recombinant human EPO (rhEPO), recombinant human interleukin-3 (IL-3), recombinant human IL-6, recombinant human stem cell factor, and recombinant human thrombopoietin.17,18,22 For extracellular signal-regulated kinase (ERK) inhibition assays, human MEPs were cultured as described above with the addition of 6 μM PD98059 (Sigma, #P215) or dimethyl sulfoxide (DMSO) (control). Murine MEPs were cultured in collagen-based medium with 3.0 U/mL rhEPO, 10 ng/mL recombinant mouse IL-3, 10 ng/mL recombinant mouse IL-6, 50 ng/mL recombinant mouse stem cell factor, 50 ng/mL recombinant mouse thrombopoietin, and 10 ng/mL recombinant mouse IL-11. All cytokines were purchased from ConnStem (Cheshire, CT) except rhEPO (Amgen). For selection of transduced cells, 0.5 μg/mL puromycin (Sigma) was added. After 12 to 14 days, human colonies were stained with anti-CD41 phycoerythrin (PE) (Biolegend) and anti-GlyA allophycocyanin (BD) and murine colonies were stained with anti-CD41-PE (Biolegend) and anti-CD71 fluorescein isothiocyanate (Biolegend) (1:100 dilution) and assessed by fluorescence microscopy (DMI6000B, Leica) as described previously in Xavier-Ferrucio et al.18 Colonies labeled with CD41 were scored as Mk-only, colonies labeled with GlyA (or CD71 in the case of mouse) were scored as erythroid only (E-only), and colonies labeled with both CD41 and GlyA (or CD71) were scored as Mk/erythroid (Mk/E).
BM transplantation
BM transplantation was performed as described previously in Xavier-Ferrucio et al.18 Briefly, 106 BM cells from B6.SJL-PtprcaPepcb/BoyJ (B6 CD45.1), Tmprss6+/+ (WT), or Tmprss6−/− mice were transplanted into 9 Gy–irradiated WT or Tmprss6−/− recipient mice. Recipients were switched to a broad-spectrum antibiotic–containing diet (Uniprim, TD06596, Envigo; iron content: 200 ppm) for 3 weeks after transplantation. Reconstitution was monitored monthly by peripheral blood counts. Mice underwent terminal peripheral blood collection and BM harvest either 8 or 12 weeks posttransplant. MEPs19 were sorted from the BM and plated in colony-forming unit (CFU) assays.
Human subjects
All work was conducted according to the Declaration of Helsinki principles. Collection and use of human cells was approved by the Yale University Institutional Review Board. Healthy donors who were already donating cells for allogeneic transplantation provided written informed consent prior to use of their surplus granulocyte colony-stimulating factor mobilized cells for research.
Statistical analysis
Data are expressed as mean plus standard deviation (SD). Statistical analyses were performed using GraphPad Prism software and analysis of variance or Student 2-tailed t test with P ≤ .05 considered statistically significant.
Results
Iron deficiency anemia is associated with thrombocytosis
To study the effects of iron deficiency on lineage commitment in mice, we induced iron deficiency anemia in WT females by weaning on an ID diet and maintaining the ID diet during pregnancy. Iron deficiency anemia characterized by decreased hemoglobin, hematocrit, mean corpuscular volume, and mean corpuscular hemoglobin was confirmed by blood cell counts (Figure 1A-D) and the lower iron content in the liver and spleen when compared with dams fed a control diet (supplemental Figure 1A-B). Additionally, ID diet–fed mice had significantly elevated platelet counts compared with adequate iron (AI) diet–fed controls by either automated blood cell counting (AI: 845.3 ± 21.5 × 1000/μL; ID: 1805 ± 196 × 1000/μL; Figure 1E) or by calculations based on the frequency of CD41+ cells by flow cytometry normalized to the total number of platelets plus RBCs by automated cell counting (Figure 1F).
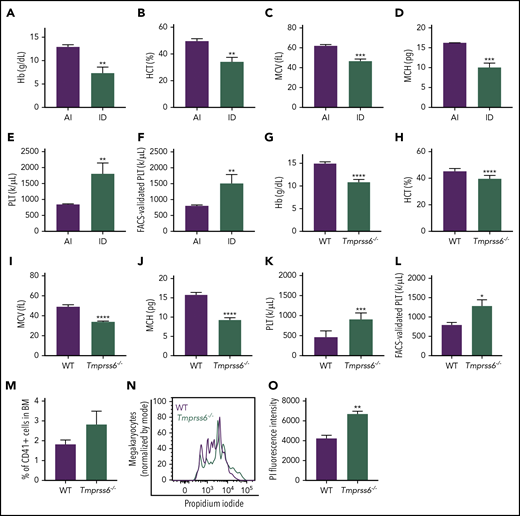
Iron deficiency anemia is accompanied by thrombocytosis in mice. (A-E) Blood cell counts were performed in females fed with an AI or ID diet for 9 weeks followed by 2 weeks of pregnancy (n = 3 for each condition). (F) Platelet (PLT) count by flow cytometry normalized to the total combined platelet and RBC count by automated cell counter in the same females fed with an AI or ID diet (n = 3/condition). (G-K) Blood cell counts were performed in 8- to 10-week-old male and female Tmprss6−/− and WT littermate controls (n = 7/genotype). (L) Platelet count by flow cytometry normalized to the total combined platelet and RBC count in the same 8- to 10-week-old male and female Tmprss6−/− and WT littermate controls (n = 7/genotype). (M) Flow cytometric analysis of the frequency of megakaryocytes (CD41+ cells) in the BM of Tmprss6−/− and WT littermate controls (n = 3 WT, n = 6 Tmprss6−/−). (N) Representative histograms of flow cytometric analysis of megakaryocyte ploidy in the BM of Tmprss6−/− and WT littermate controls. (O) MFI of propidium iodide (PI) in CD41+ cells (n = 3 WT, n = 6 Tmprss6−/−). Data are presented as mean + SD. *P < .05, **P < .01, ***P < .001, and ****P = .0001 calculated by 2-tailed unpaired Student t test. Hb, hemoglobin; HCT, hematocrit; MCH, mean corpuscular hemoglobin; MCV, mean corpuscular volume.
Iron deficiency anemia is accompanied by thrombocytosis in mice. (A-E) Blood cell counts were performed in females fed with an AI or ID diet for 9 weeks followed by 2 weeks of pregnancy (n = 3 for each condition). (F) Platelet (PLT) count by flow cytometry normalized to the total combined platelet and RBC count by automated cell counter in the same females fed with an AI or ID diet (n = 3/condition). (G-K) Blood cell counts were performed in 8- to 10-week-old male and female Tmprss6−/− and WT littermate controls (n = 7/genotype). (L) Platelet count by flow cytometry normalized to the total combined platelet and RBC count in the same 8- to 10-week-old male and female Tmprss6−/− and WT littermate controls (n = 7/genotype). (M) Flow cytometric analysis of the frequency of megakaryocytes (CD41+ cells) in the BM of Tmprss6−/− and WT littermate controls (n = 3 WT, n = 6 Tmprss6−/−). (N) Representative histograms of flow cytometric analysis of megakaryocyte ploidy in the BM of Tmprss6−/− and WT littermate controls. (O) MFI of propidium iodide (PI) in CD41+ cells (n = 3 WT, n = 6 Tmprss6−/−). Data are presented as mean + SD. *P < .05, **P < .01, ***P < .001, and ****P = .0001 calculated by 2-tailed unpaired Student t test. Hb, hemoglobin; HCT, hematocrit; MCH, mean corpuscular hemoglobin; MCV, mean corpuscular volume.
Elevated platelet counts have been reported in patients with IRIDA caused by TMPRSS6 mutations, and analysis of complete blood count data from published IRIDA case reports23-25 reveals an inverse correlation between hemoglobin level and platelet count (supplemental Figure 2). Interestingly, the results observed in mice with acquired dietary iron deficiency were recapitulated in a genetic model of chronic iron deficiency anemia: Tmprss6−/− mice. As previously described in Finberg et al,15 8- to-10 week old Tmprss6−/− mice had microcytic anemia, characterized by decreased hemoglobin, hematocrit, mean corpuscular volume, and mean corpuscular hemoglobin (Figure 1G-J). The Tmprss6−/− mice also had thrombocytosis compared with littermate controls (WT: 477.9 ± 53.7 × 1000/μL; Tmprss6−/−: 915.9 ± 57 × 1000/μL; P < .001, Figure 1K). The elevated platelet counts were confirmed by calculations based on the frequency of CD41+ cells by flow cytometry normalized to the total number of platelets plus RBCs determined from automated cell counting (Figure 1L). The frequency of CD41+ megakaryocytes was similar in WT and Tmprss6−/− BM (Figure 1M). However, the average ploidy of the Tmprss6−/− megakaryocytes was increased compared with WT (Figure 1N-O).
Based on immunophenotype, the percentage of HSCs and MEP, as well as Mk, erythroid, and granulocyte/monocyte-committed progenitors in BM was comparable between the 2 genotypes (supplemental Figure 3A). These results suggest that the elevated platelet counts in Tmprss6−/− mice were not due to changes in relative numbers of hematopoietic stem or progenitor subpopulations in the BM.
MEP from Tmprss6−/− mice have decreased labile iron content
To better understand why Tmprss6−/− mice exhibited anemia accompanied by thrombocytosis, we tested whether the intracellular level of iron was reduced in their MEPs. We used the iron-sensitive fluorophore calcein-AM, which is quenched upon binding to ferrous iron.21 The LIP is proportional to the gain in fluorescence that occurs after administration of the cell-permeable iron chelator 2,2′-bipyridyl. Compared with Tmprss6−/− mice, MEPs from WT mice showed a significantly greater gain in fluorescence after adding the chelator (calculated by the subtraction of calcein-AM MFI with and without addition of 2,2′-bipyridyl (ΔMFI, as shown in the representative histograms of Figure 2A). LIP was 9 times lower in Tmprss6−/− MEPs than WT MEPs (WT: 165.7 ± 51, n = 5; Tmprss6−/−: 18 ± 10.4, n = 6; P = .04; Figure 2B).
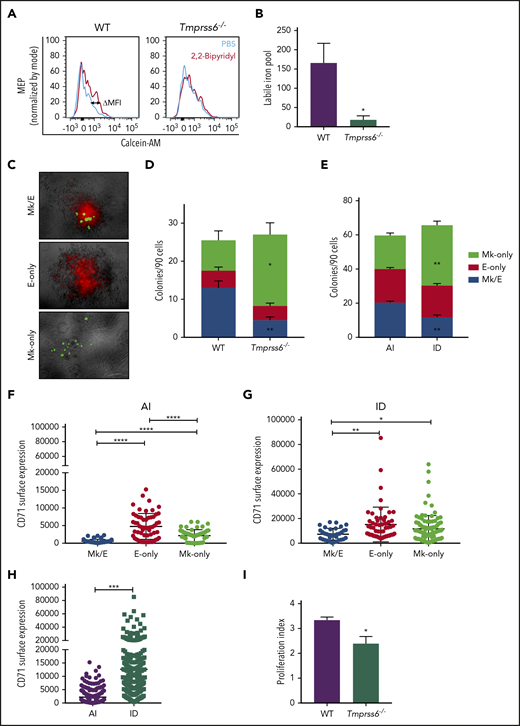
MEPs from ID mice are Mk biased. (A) Representative histograms of flow cytometric analysis of calcein-AM fluorescence in MEPs exposed to chelator, 2,2′-bipyridyl (red lines) or PBS control (blue lines) from Tmprss6−/− and WT littermate controls. (B) LIP as calculated by the change in calcein MFI in WT and Tmprss6−/− MEPs with and without chelator (n = 4 WT, n = 6 Tmprss6−/−). (C) Representative images (acquired at 5× with a Leica 6000 microscope and accompanying software) of murine MEP-derived colonies: Mk/E showing staining with CD71 fluorescein isothiocyanate (false-colored red) and CD41-PE (false-colored green), Mk-only colonies showing staining with only CD41, and E-only colonies showing staining with only CD71. (D-E) Colony counts by type per 90 cells plated of Tmprss6−/− and littermate controls (n = 4 mice/genotype) (D) and AI diet– vs ID diet–fed mice (n = 3 per group) (E). (F-H) Surface expression of CD71 (fluorescence intensity) from index single sorted MEPs; by colony type generated by MEPs from AI diet– (F) and ID diet–fed (G) mice. Individual cells are shown in blue (Mk/E), red (E-only), and green (Mk-only). (H) Comparison of total sorted MEPs from AI diet– and ID diet–fed mice. (I) Proliferation index of carboxyfluorescein succinimidyl ester–stained MEPs after 72 hours in culture analyzed by flow cytometry (n = 5 WT, n = 7 Tmprss6−/−). Data are presented as mean + SD. *P < .05, **P < .01, ***P < .001, and ****P = .0001 calculated by 2-tailed unpaired Student t test.
MEPs from ID mice are Mk biased. (A) Representative histograms of flow cytometric analysis of calcein-AM fluorescence in MEPs exposed to chelator, 2,2′-bipyridyl (red lines) or PBS control (blue lines) from Tmprss6−/− and WT littermate controls. (B) LIP as calculated by the change in calcein MFI in WT and Tmprss6−/− MEPs with and without chelator (n = 4 WT, n = 6 Tmprss6−/−). (C) Representative images (acquired at 5× with a Leica 6000 microscope and accompanying software) of murine MEP-derived colonies: Mk/E showing staining with CD71 fluorescein isothiocyanate (false-colored red) and CD41-PE (false-colored green), Mk-only colonies showing staining with only CD41, and E-only colonies showing staining with only CD71. (D-E) Colony counts by type per 90 cells plated of Tmprss6−/− and littermate controls (n = 4 mice/genotype) (D) and AI diet– vs ID diet–fed mice (n = 3 per group) (E). (F-H) Surface expression of CD71 (fluorescence intensity) from index single sorted MEPs; by colony type generated by MEPs from AI diet– (F) and ID diet–fed (G) mice. Individual cells are shown in blue (Mk/E), red (E-only), and green (Mk-only). (H) Comparison of total sorted MEPs from AI diet– and ID diet–fed mice. (I) Proliferation index of carboxyfluorescein succinimidyl ester–stained MEPs after 72 hours in culture analyzed by flow cytometry (n = 5 WT, n = 7 Tmprss6−/−). Data are presented as mean + SD. *P < .05, **P < .01, ***P < .001, and ****P = .0001 calculated by 2-tailed unpaired Student t test.
MEPs from genetic and dietary ID mice are Mk biased
To test the hypothesis that thrombocytosis in ID anemic mice is related to altered commitment of MEPs, we assayed the effects of low-iron conditions on the functional output, transcriptome, and signaling of MEPs. We correlated the immunophenotype of individual MEPs with their functional outputs (lineage fate of progeny) by performing indexed single-cell sorting followed by CFU assays to test the lineage potential of progenitor cells. By assessing the lineages of the progeny within a single colony, the lineage fate of the founding progenitor cell can be deduced. Based on the immunophenotype of each cell recorded at the time of index sorting, surface expression levels of markers can be correlated with the lineage output of the same cell, thereby identifying markers that may predict lineage commitment bias.
CFU assays of single MEPs resulted in the generation of 3 types of colonies: Mk/E (positive for both CD41 and CD71), E-only (positive for CD71), and Mk-only (positive for CD41), as shown in Figure 2C. MEPs from either Tmprss6−/− or mice with acquired iron deficiency showed a striking increase in Mk-only at the expense of bipotent Mk/E colonies compared with WT or AI (P < .001; Figure 2D-E), suggesting a bias toward a unilineage-committed Mk lineage in both models of iron deficiency. We assessed if the expression of any of the surface markers used to sort the MEPs could predict the lineage potential of the sorted cells. We found that expression of the glycoprotein known as signaling lymphocyte activation molecule (or CD150), but not c-Kit, showed a small but statistically significant increase in MEPs that gave rise to Mk-only colonies compared with those that gave rise to E-only colonies (supplemental Figure 3B-E).
The transferrin receptor (CD71) mediates cellular iron uptake. In both AI and ID mice, the MEP that gave rise to E-only and Mk-only colonies had a higher CD71 MFI than the MEP that gave rise to Mk/E colonies (Figure 2F-G). Consistent with the known ability of iron deficiency to upregulate transferrin receptor expression,26 MEPs from ID mice had 5.7-fold higher CD71 expression than AI mice (Figure 2H; P < .0001). Taken together, these data suggest that low iron content influences the lineage commitment of MEPs, causes an increase in CD71 expression, and does not alter expression of the markers used for sorting MEPs.
Consistent with a role for iron in cell proliferation,27 MEPs from Tmprss6−/− mice had a 30% decrease in proliferation relative to WT (P = .04; Figure 2I) as measured by carboxyfluorescein succinimidyl ester dilution. Of note, decreased proliferation correlates with an Mk commitment bias of human MEPs22 and may provide a link between low iron and the Mk commitment bias of MEPs in Tmprss6−/− mice.
A low-iron environment promotes Mk bias of MEPs
Although Tmprss6 is primarily expressed in hepatocytes, we excluded the possibility that the Mk commitment bias detected in Tmprss6−/− MEPs is due to local loss of Tmprss6 expression in hematopoietic cells. After confirming that irradiation eliminated host BM cells from WT and Tmprss6−/− recipients with the same efficiency (supplemental Figure 4A), we transplanted WT or Tmprss6−/− BM into lethally irradiated WT or Tmprss6−/− recipients (Figure 3A). Tmprss6−/− recipients of either WT or Tmprss6−/− donor BM exhibited microcytic anemia, hypoferremia, and thrombocytosis compared with WT recipients of either WT or Tmprss6−/− BM (Figure 3B-E; supplemental Figure 4C). The thrombocytosis present in the Tmprss6−/− recipients was confirmed by frequency of CD41+ cells in the peripheral blood by flow cytometry (supplemental Figure 4B).
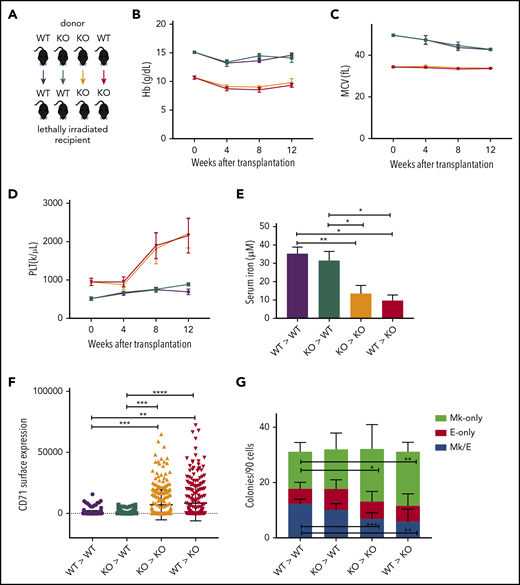
A low-iron environment promotes the Mk bias observed in Tmprss6−/− mice. (A) Schematic of color-coded BM transplantation groups. (B-D) Reconstituted peripheral blood analysis of recipients at indicated times after transplant. Week 0 represents nontransplanted mice. (E) Serum iron concentration of recipients 12 weeks posttransplant. (F) Surface expression of CD71 (fluorescence intensity) on MEPs harvested from transplant recipients. (G) Average number of colony types per 90 sorted MEPs harvested from transplant recipients. Data are presented as mean + SD. *P < .05, **P < .01, ***P < .001, and ****P = .0001 calculated by 2-tailed unpaired Student t test. KO, knockout.
A low-iron environment promotes the Mk bias observed in Tmprss6−/− mice. (A) Schematic of color-coded BM transplantation groups. (B-D) Reconstituted peripheral blood analysis of recipients at indicated times after transplant. Week 0 represents nontransplanted mice. (E) Serum iron concentration of recipients 12 weeks posttransplant. (F) Surface expression of CD71 (fluorescence intensity) on MEPs harvested from transplant recipients. (G) Average number of colony types per 90 sorted MEPs harvested from transplant recipients. Data are presented as mean + SD. *P < .05, **P < .01, ***P < .001, and ****P = .0001 calculated by 2-tailed unpaired Student t test. KO, knockout.
By 12 weeks posttransplantation, compared with WT recipients, Tmprss6−/− recipients had lower serum iron and higher levels of CD71 expression on their MEPs (Figure 3E-F). Indexed single-cell sorting of BM from WT and Tmprss6−/− transplant recipients followed by CFU assays showed that in Tmprss6−/− recipients of Tmprss6−/− BM and WT recipients of either WT or Tmprss6−/− BM, MEPs that gave rise to E-only colonies had a higher CD71 MFI than MEPs that gave rise to Mk/E or Mk colonies (P < .0001; supplemental Figure 4D-F). However, CD71 was high in all cells in Tmprss6−/− recipients of WT BM, with no correlation between CD71 surface expression and erythroid commitment of MEPs (supplemental Figure 4G).
CFU assays on MEPs isolated from Tmprss6−/− recipients, regardless of the genotype of the BM donor, recapitulated the Mk commitment bias observed in nontransplanted Tmprss6−/− MEPs (Figure 3G). These results confirm that the thrombocytosis and Mk commitment bias observed in Tmprss6−/− mice are a consequence of systemic iron deficiency.
Inhibition of TFR2 promotes Mk commitment of human MEPs
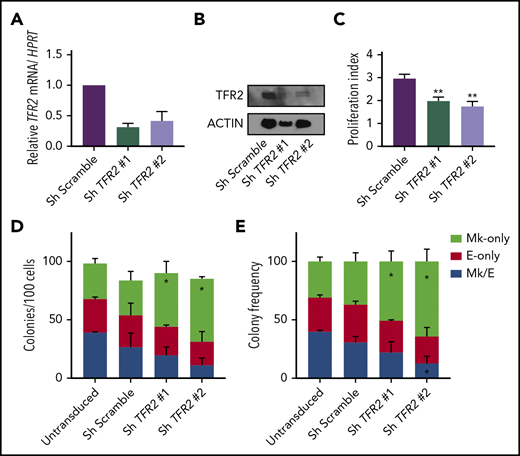
We next assessed whether iron regulation of MEP commitment also applies to human MEPs in vitro. Initial attempts to decrease the iron content in the media or to knock down the transferrin receptor (CD71) markedly impaired MEP survival (data not shown). In addition to CD71, a second transferrin receptor (TFR2) has been proposed to participate in tissue-specific iron-sensing mechanisms in hepatic and erythroid cells. In hepatoma cells, treatment with diferric transferrin raises TFR2 protein levels28,29 by reducing lysosomal degradation of TFR2,30 and in erythroblasts, TFR2 stabilizes the EPO receptor on the cell surface.31 As a candidate sensor of iron bound to transferrin in the circulation, TFR2 acts in hepatocytes to regulate the production of hepcidin32 and acts in erythroid cells to modulate red blood cell production.33 To explore if changes in diferric transferrin exposure would alter TFR2 protein levels in a cell line relevant to MEPs, we overexpressed FLAG-tagged human TFR2 in UT7 megakaryoblastic leukemia cells and observed that raising the ratio of apotransferrin to holotransferrin in the media caused a mild decrease in TFR2 protein levels by either western blot or flow cytometry (supplemental Figure 5A-B). Thus, to disrupt a potential TFR2-mediated iron-sensing mechanism and mimic a low-iron environment, we performed short hairpin RNA (shRNA)-based knockdown of TFR2 in primary human MEPs. We confirmed the decrease of TFR2 messenger RNA (mRNA) and protein using 2 different shRNA constructs (Figure 4A-B) and found that primary human MEPs with shRNA-mediated TFR2 knockdown showed decreased proliferation (P = .03; Figure 4C) and exhibited statistically significant skewing toward Mk commitment (P < .04; Figure 4D-E). Therefore, the effects of TFR2 knockdown recapitulate the Mk commitment bias that we previously observed in Tmprss6−/− and ID murine MEPs.

TFR2 knockdown promotes Mk commitment of human MEP. (A-B) Knockdown efficiency of TFR2 assessed by mRNA (A) and protein (B) in human MEPs 48 hours after transduction (n = 3). (C) Proliferation index of carboxyfluorescein succinimidyl ester–stained MEPs transduced with 2 different TFR2-directed shRNAs after 72 hours in culture (n = 4 per group). Colony counts by type per 100 transduced MEPs per group (D), and average frequency of colony types (n = 4) (E). Data are presented as mean + SD. *P < .05, **P ≤ .01 calculated by 2-tailed unpaired Student t test compared to Scramble control.
TFR2 knockdown promotes Mk commitment of human MEP. (A-B) Knockdown efficiency of TFR2 assessed by mRNA (A) and protein (B) in human MEPs 48 hours after transduction (n = 3). (C) Proliferation index of carboxyfluorescein succinimidyl ester–stained MEPs transduced with 2 different TFR2-directed shRNAs after 72 hours in culture (n = 4 per group). Colony counts by type per 100 transduced MEPs per group (D), and average frequency of colony types (n = 4) (E). Data are presented as mean + SD. *P < .05, **P ≤ .01 calculated by 2-tailed unpaired Student t test compared to Scramble control.
Genes downstream of the MAPK/ERK and VEGF signaling pathways are differentially expressed between WT and Tmprss6−/− MEPs
Transcriptome analysis by deep sequencing of RNAs (RNAseq) showed that 322 genes are differentially expressed (fold change ≥1.5 or ≤1/1.5; P < .05; Figure 5A) between WT and Tmprss6−/− MEPs. Of these, 263 are upregulated and 59 are downregulated in Tmprss6−/− MEPs compared with WT MEPs. Tfrc (transferrin receptor) was upregulated (fold change, 2; P = .008) in Tmprss6−/− MEPs, consistent with the elevated CD71 expression in MEPs of ID mice and Tmprss6−/− transplant recipients (Figures 2H and 3F). Surprisingly, expression of transcription factors known to regulate erythrocyte and megakaryocyte maturation, such as Myb, Tal, Fli1, and Eklf, did not differ. Consistent with reports that VEGF is elevated in iron deficiency,13 upstream regulator analysis indicated that 32 of the upregulated genes in Tmprss6−/− MEPs are affected by VEGF signaling (P = 1.68E-15). Among the downregulated genes, we found MAPK/ERK target genes, such as Egr1, Jun, and Apln. Pathway analysis of the differentially expressed genes also showed enrichment for metabolic pathways (asparagine and cholesterol biosynthesis and b-alanine degradation; P < .008), raising the possibility that altered cell metabolism may influence MEP commitment.
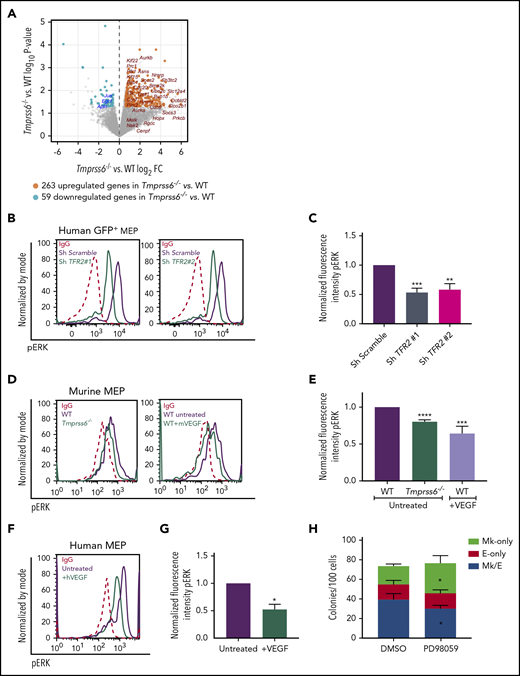
Low iron status alters VEGF and ERK signaling in MEPs. (A) Volcano plot of RNAseq analysis of sorted MEPs from Tmprss6−/− and WT mice. Upregulated genes, including VEGF targets, are identified by orange dots. Downregulated genes, including ERK targets, are identified by blue dots. (B) Representative histograms of phospho-ERK (pERK) in GFP+ gated human MEP transduced with scrambled shRNA (purple line) or TFR2-directed shRNA (green line); immunoglobulin G (IgG) control (red dotted line). (C) Normalized fluorescence intensity of phospho-ERK in GFP+ transduced human MEPs (n = 4 per group). (D) Representative histograms of phospho-ERK in WT (purple line) and Tmprss6−/− (green line on left graph) MEPs, WT MEPs treated with VEGF (50 ng/mL) for 30 minutes (green line on right graph), and IgG control (red dotted line). (E) Normalized MFI of phospho-ERK shown in panel D normalized to untreated WT MEPs (n = 3). (F) Representative histograms of phospho-ERK in untreated human MEPs (purple line), human MEPs treated with VEGF (50 ng/mL) for 30 minutes (green line), and IgG control (red dotted line). (G) Normalized MFI of phospho-ERK shown in panel F, normalized to untreated human MEPs (n = 3). (H) Colony counts by type per 100 MEPs plated in the presence of vehicle control (DMSO) or ERK inhibitor (PD98059) (n = 4). Data are presented as mean + SD. *P < .05, **P < .01, ***P < .001, and ****P = .0001 calculated by 2-tailed unpaired Student t test. FC, fold change.
Low iron status alters VEGF and ERK signaling in MEPs. (A) Volcano plot of RNAseq analysis of sorted MEPs from Tmprss6−/− and WT mice. Upregulated genes, including VEGF targets, are identified by orange dots. Downregulated genes, including ERK targets, are identified by blue dots. (B) Representative histograms of phospho-ERK (pERK) in GFP+ gated human MEP transduced with scrambled shRNA (purple line) or TFR2-directed shRNA (green line); immunoglobulin G (IgG) control (red dotted line). (C) Normalized fluorescence intensity of phospho-ERK in GFP+ transduced human MEPs (n = 4 per group). (D) Representative histograms of phospho-ERK in WT (purple line) and Tmprss6−/− (green line on left graph) MEPs, WT MEPs treated with VEGF (50 ng/mL) for 30 minutes (green line on right graph), and IgG control (red dotted line). (E) Normalized MFI of phospho-ERK shown in panel D normalized to untreated WT MEPs (n = 3). (F) Representative histograms of phospho-ERK in untreated human MEPs (purple line), human MEPs treated with VEGF (50 ng/mL) for 30 minutes (green line), and IgG control (red dotted line). (G) Normalized MFI of phospho-ERK shown in panel F, normalized to untreated human MEPs (n = 3). (H) Colony counts by type per 100 MEPs plated in the presence of vehicle control (DMSO) or ERK inhibitor (PD98059) (n = 4). Data are presented as mean + SD. *P < .05, **P < .01, ***P < .001, and ****P = .0001 calculated by 2-tailed unpaired Student t test. FC, fold change.
Iron status of MEPs regulates ERK signaling
Because TFR2 is known to activate the MAPK/ERK pathway,34,35 we tested if ERK signaling was attenuated in human MEPs with TFR2 knockdown and in Tmprss6−/− MEPs. Signal transduction analysis revealed significantly decreased levels of phospho-ERK (Thr202/Tyr204) in human MEPs transduced with shRNA against TFR2 compared with control (Figure 5B-C). Corroborating these results, UT7-TFR2 cells showed higher levels of phospho-ERK compared with parental UT7 cells (supplemental Figure 5C-D), and reducing iron availability to UT7-TFR2 cells resulted in decreased ERK phosphorylation (supplemental Figure 5E-F). Similarly, Tmprss6−/− MEPs showed decreased phospho-ERK compared with WT MEPs (Figure 5D-E). Because low-iron conditions are known to stimulate VEGF production13 and activation of this pathway in Tmprss6−/− MEPs was suggested by RNAseq, we evaluated ERK phosphorylation in response to VEGF. The addition of murine VEGF to murine MEPs (Figure 5D-E) or human VEGF to human MEPs (Figure 5F-G) resulted in lower levels of phospho-ERK compared with controls. Surprisingly, VEGF stimulation decreased phospho-ERK in WT MEPs to levels similar to those observed in Tmprss6−/− MEPs (Figure 5E). Together, these data suggest that both low iron status and VEGF treatment decrease phospho-ERK in MEPs. We then evaluated the effects of ERK inhibition on human MEP commitment. We used a low dose of PD98059 that was described to inhibit ERK phosphorylation in CD34+ cells and to augment colony formation by Mk progenitors in semisolid assays.36 Human MEPs in the presence of 6 μM PD98059 gave rise to more Mk-only colonies at the expense of Mk/E colonies when compared with the DMSO control (Figure 5H). Together, these data support a model in which low iron in the marrow environment affects hematopoietic progenitor fate decisions. Specifically, MEPs are directly affected by iron deficiency, which causes lower ERK phosphorylation, slower proliferation, and increased Mk commitment.
Discussion
Mechanistic insights obtained from the study of hematological diseases can be used to reveal underlying pathways regulating normal hematopoiesis. The clinical observation that iron deficiency anemia can be accompanied by elevated platelet counts2 prompted us to study a potentially biased MEP commitment in vivo. Because iron metabolism in humans and mice is highly conserved, mechanistic studies of the effect of iron deficiency on MEPs in mice have relevance for understanding thrombocytosis in patients with iron deficiency anemia. Using a mouse model of acquired iron deficiency anemia and a genetic mouse model of chronic iron deficiency anemia (Tmprss6−/−), each of which exhibits benign thrombocytosis, we uncovered a novel link between the iron status of bipotent MEPs and their commitment to the Mk vs erythroid lineage.
Single-cell CFU assays allowed us to definitively demonstrate that MEPs from both acquired iron deficiency mice and Tmprss6−/− mice were Mk biased. Furthermore, BM transplantation experiments confirmed that the microcytic anemia, thrombocytosis, and Mk commitment bias observed in the Tmprss6−/− MEPs were due to systemic iron deficiency rather than a loss of TMPRSS6 function in hematopoietic cells. Interestingly, in culture in CFU assays, which are iron replete, MEPs from mice with acquired (dietary) or chronic (Tmprss6−/−) iron deficiency still exhibited an Mk commitment bias, suggesting that exposure to a low-iron environment in vivo reprograms the MEPs toward the Mk lineage.
CD71 expression in MEPs was significantly higher in mice fed an ID vs AI diet. A similar CD71 upregulation was observed the Tmprss6−/− recipients of either WT or Tmprss6−/− BM. However, even within ID or AI mice, the MEPs that give rise to E-only colonies have a higher CD71 than the MEPs that give rise to Mk/E colonies, most likely reflecting the erythroid fate commitment with its physiological upregulation of CD71. Additionally, CD71 is a marker of fast-cycling cells in the erythroid lineage.37
To test the hypothesis that MEP lineage commitment is altered by changes in iron homeostasis, we sought to manipulate iron availability to MEPs. Because more traditional approaches to modulate cellular iron status led to decreased survival and/or proliferation in CFU assays, we instead knocked down TFR2, a protein that functions in iron-sensing pathways in hepatic and erythroid cells,32,38 as an approach to perturb this iron-sensing pathway in human MEPs. Our rationale was that TFR2 knockdown in human MEPs may mimic a low-iron environment perhaps characterized by decreased ERK signaling.39 Human MEPs with reduced TFR2 expression recapitulated the characteristics of MEPs from ID mice; namely, human MEPs deficient in TFR2 preferentially committed to the Mk lineage, downregulated phospho-ERK, and proliferated less compared with scrambled shRNA controls. Tfr2 mRNA levels were similar in Tmprss6−/− and WT MEPs in our RNAseq analysis, compatible with prior findings that TFR2 mRNA levels are not altered by diferric transferrin treatment.28,29
Iron is essential for cell proliferation and DNA synthesis.27 ERK activation also plays an important role in the proliferative status as well as in the fate determination of hematopoietic cells.40 ERK targets were enriched in the set of differentially expressed genes between WT and Tmprs6−/− MEPs. We report a reduction in phospho-ERK levels in MEPs in the context of iron deficiency. We also report that the decrease in phospho-ERK is correlated with slower proliferation. We previously demonstrated22 that decreased MEP proliferation skews the MEP fate commitment toward the Mk lineage. Thus, we hypothesize that low-iron environments reduce ERK phosphorylation, leading to a slower cell cycle in MEP, thereby skewing their fate commitment toward the Mk lineage. This suggests a potential causal relationship, but further studies are needed to evaluate this potential mechanism.
Pathway analysis of the differently expressed genes in MEPs from Tmprss6−/− vs WT mice implied activation of the VEGF pathway. VEGF is a downstream target of EPO, which is increased in Tmprss6−/− mice.41 There is a complex interplay between iron- and oxygen-detection pathways, which are synergistic in hypoxic conditions when iron uptake is needed.42 Jimenez et al13 demonstrated that iron deficiency in rats stimulates Mk differentiation, increases HIF2A expression in Mk, and increases the concentration of VEGFA in vitro. In our experiments, culturing human and murine MEPs under hypoxic conditions (1% and 5% O2) did not promote Mk commitment (data not shown).
In bipotent MEPs from human and mice cultured with complete medium and cytokines, we found that VEGF stimulation decreased ERK phosphorylation to levels that were comparable to those observed in both human and murine models of iron deficiency. By contrast, a prior report found that that VEGF treatment of an endothelial cell line stimulated phosphorylation of ERK, leading to increased survival after oxygen and glucose deprivation.43 This seeming discrepancy may relate to the difference in context when VEGF treatment was administered. For one, cell lines may have altered signaling responses downstream of stimuli. For another, when cells are severely deficient in a factor required for survival (and proliferation), such as oxygen and/or glucose, signaling pathways that are already suppressed cannot decrease further. Therefore, we find it reasonable and consistent with our hypothesis that increased levels of VEGF inhibit phospho-ERK in bipotent MEPs.
It is not clear why thrombocytosis only occurs in some patients with iron deficiency anemia or why this response would have evolved. Regarding differences between patients, it is possible that differing degrees or kinetics of iron deficiency differentially affect hematopoietic progenitor subpopulations. Additionally, given that genome-wide association studies have identified common genetic polymorphisms that influence hematological traits such as hemoglobin levels and platelet counts,44 it is possible that genetic factors impact the pathways mediating thrombocytosis in the setting of iron deficiency anemia. Regarding a potential evolutionary advantage, limiting erythroid differentiation during iron deficiency may preserve iron for other bodily functions. During evolution, when those with iron deficiency anemia were faced with life-threatening hemorrhage, thrombocytosis may have conferred a selective advantage. The coupling of Mk and erythroid production in this context supports the necessity of bipotent MEP in human physiology. Here, we propose a model in which iron acts on the bipotent MEP, one possible source of Mk and erythroid cells, to bias lineage commitment. These data support the hypothesis that low iron in the marrow environment affects MEP metabolism, lowers ERK phosphorylation, slows proliferation, and increases Mk commitment. Our findings add mechanistic insights to a question that has long puzzled hematologists as to why some patients with iron deficiency anemia present with thrombocytosis.
Presented in part at the Plenary Session of the 60th annual meeting of the American Society of Hematology, San Diego, CA, 2 December 2018.
The online version of this article contains a data supplement.
The publication costs of this article were defrayed in part by page charge payment. Therefore, and solely to indicate this fact, this article is hereby marked “advertisement” in accordance with 18 USC section 1734.
Acknowledgments
The authors thank the Orkin laboratory (Boston Children’s Hospital, Boston, MA) for support while finishing this work. UT7-MPL cells were kindly provided by the Mullally laboratory (Brigham and Women’s Hospital, Boston, MA). The authors appreciate advice on ID in vitro cultures from the Goldfarb laboratory (University of Virginia, Charlottesville, VA). The authors also thank Geoffrey Lyon for expertise in cell sorting and fluorescence-activated cell sorter analysis, and Ee-Chun Cheng and Mei Zhong for mRNA sequencing preparation.
Sequencing was conducted at Yale Stem Cell Center Genomics Core facility, which is supported by the Connecticut Regenerative Medicine Research Fund and the Li Ka Shing Foundation. Funding for this study came from a National Blood Foundation Early-Career Scientific Research Grant (J.X.-F.); a Gruber Science Fellowship (X.L.); a Burroughs Wellcome Career Award for Medical Scientists (K.E.F.); National Institutes of Health, National Institute of Diabetes and Digestive and Kidney Diseases (NIDDK) grants DK094934, DK114031, and DK086267 (D.S.K.) and National Institutes of Health, National Heart Lung and Blood Institute grant 2T32HL00797416 (V.S. and N.A.-L.); and the NIDDK-funded Yale Cooperative Center of Excellence in Hematology grant 1U54DK106857.
Authorship
Contribution: J.X.-F. and V.S. wrote the paper, designed and performed experiments; X.L., P.-X.Z., L.L., N.A.-L., and C.C. performed experiments; T.T. and S.H. performed bioinformatic analysis; M.D.F. designed experiments, helped interpret data, and wrote the manuscript; and K.E.F. and D.S.K. oversaw the project, provided intellectual input, and wrote the paper.
Conflict-of-interest disclosure: The authors declare no competing financial interests.
The current affiliation for J.X.-F. is Division of Hematology/Oncology, Boston Children’s Hospital, Harvard Medical School, Boston, MA.
Correspondence: Juliana Xavier-Ferrucio, Boston Children’s Hospital, 1 Blackfan Circle KFRB 07007H, Boston, MA 02115; e-mail: juliana.xavierferrucio@childrens.harvard.edu.