Key Points
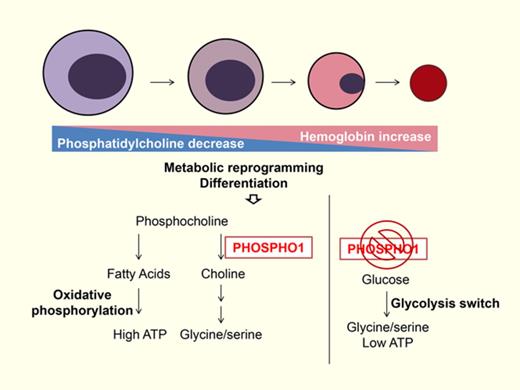
PHOSPHO1 regulates phosphocholine metabolism, ATP production, and amino acid supply during erythropoiesis.
Abstract
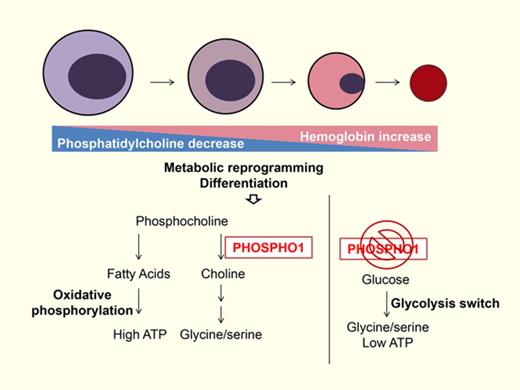
Red cells contain a unique constellation of membrane lipids. Although much is known about regulated protein expression, the regulation of lipid metabolism during erythropoiesis is poorly studied. Here, we show that transcription of PHOSPHO1, a phosphoethanolamine and phosphocholine phosphatase that mediates the hydrolysis of phosphocholine to choline, is strongly upregulated during the terminal stages of erythropoiesis of both human and mouse erythropoiesis, concomitant with increased catabolism of phosphatidylcholine (PC) and phosphocholine as shown by global lipidomic analyses of mouse and human terminal erythropoiesis. Depletion of PHOSPHO1 impaired differentiation of fetal mouse and human erythroblasts, and, in adult mice, depletion impaired phenylhydrazine-induced stress erythropoiesis. Loss of PHOSPHO1 also impaired phosphocholine catabolism in mouse fetal liver progenitors and resulted in accumulation of several lipids; adenosine triphosphate (ATP) production was reduced as a result of decreased oxidative phosphorylation. Glycolysis replaced oxidative phosphorylation in PHOSPHO1-knockout erythroblasts and the increased glycolysis was used for the production of serine or glycine. Our study elucidates the dynamic changes in lipid metabolism during terminal erythropoiesis and reveals the key roles of PC and phosphocholine metabolism in energy balance and amino acid supply.
Introduction
The lipid and protein organization of the red cell membrane is critical for the survival and deformability of red cells, as elucidated by the pathological disturbances of red cell membranes in several genetic disorders.1 Although most abnormalities, such as spherocytosis and elliptocytosis, are caused by mutant membrane or skeletal proteins, hereditary high-red-cell-membrane phosphatidylcholine (PC) hemolytic anemia and spur anemia result from an altered lipid composition.2,3 Thus, generating and maintaining the specific lipid composition of red cell membranes is essential.4 Mature red cells can incorporate fatty acids from the circulation and use acyl-coenzyme A and an amino-phospholipid translocase to homeostatically maintain the lipid composition.5 However, the processes by which this specific lipid composition is formed during erythropoiesis remain unclear. Therefore, we performed metabolomic analysis on cells undergoing terminal erythropoiesis to investigate the dynamic changes in lipid metabolism. We delineate a function for catabolism of PC and its downstream metabolite phosphocholine in directing metabolic activity in terminal erythropoiesis, and show that the PHOSPHO1 gene and its encoded protein is one of the important regulators of these catabolic steps during erythroblast differentiation. These findings expand our understanding of the links between the regulation of lipid composition and energy metabolism during terminal erythropoiesis.
Material and methods
Flow cytometry analyses and antibodies
All flow cytometry data were acquired on a fluorescence-activated cell sorter (FACS) Fortessa flow cytometer (BD Biosciences) and analyzed using Flowjo software. All stainings were carried out in FACS buffer (100 μM EDTA and 2% fetal bovine serum [FBS] in phosphate-buffered saline [PBS]) for 30 minutes at room temperature unless otherwise described. The following are the antibodies used at 1/100 dilution: anti-human CD235A-allophycocyanin (eBioscience), anti-mouse Ter119-allophycocyanin (eBioscience), and anti-mouse CD71-phycoerythrin (Affymetrix). Hoechst 33342 (Life Technologies) was used to visualize nuclei.
Antibodies for western blotting
Anti–5′ adenosine monophosphate (AMP)-activated protein kinase α (AMPKα; Cell Signaling Technology), anti-phospho-AMPKα (Thr172; Cell Signaling Technology), anti-phospho1 antibody (Abcam), anti-glyceraldehyde-3-phosphate dehydrogenase (GAPDH; Santa Cruz Biotechnology), and anti-β-actin (BioLegend) were used.
Human CD34+ cell culture
Granulocyte-colony stimulating factor–mobilized CD34+ peripheral blood stem cells were thawed according to the vendor’s protocol. Cells were cultured according to methods published previously.6
Isolation of erythroid progenitors from murine fetal liver cells
Enriched erythroid progenitors were purified from embryonic day 14.5 (E14.5) C57BL/6J mouse embryos, and cultured in vitro for erythroid differentiation following a protocol described in detail previously.6 Briefly, pregnant C57BL/6J mice at E14.5 were sacrificed by CO2 asphyxiation and their embryos were collected. The fetal livers were isolated and suspended in PBS with 2% FBS and 100 μM EDTA. Mature red blood cells (RBCs) in the cell suspension were lysed by incubation for 10 minutes with an ammonium chloride solution (Stemcell Technologies). Following the manufacturer’s protocol, lineage-negative cells were obtained after magnetic depletion of lineage-positive cells using the BD Pharmingen Biotin Mouse Lineage Panel (BD Biosciences) and BD Streptavidin Particles Plus-DM (BD Biosciences). These lineage-negative fetal liver cells were enriched for >90% for erythroid progenitors.
Viral infection and culture of murine erythroid progenitors
Following the isolation step, lineage-negative fetal liver cells were plated in 24-well plates at 100 000 cells per well, covered by a 1-mL virus containing supernatant, and centrifuged at 500g for 90 minutes at 30°C. After this spin infection, the virus supernatant was replaced with erythroid maintenance medium (StemSpan-SFEM; Stemcell Technologies) supplemented with 100 ng/mL recombinant mouse stem cell factor (R&D Systems), 40 ng/mL recombinant mouse IGF1 (R&D Systems), 100 nM dexamethasone (Sigma-Aldrich), and 2 U/mL erythropoietin (Amgen), cultured at 37°C. Green fluorescent protein–positive (GFP+) cells were sorted by flow cytometry after 16 hours and cultured for another 48 hours in erythroid differentiation medium (Iscove modified Dulbecco medium containing 15% [vol/vol] FBS; Stemcell Technologies), 1% detoxified bovine serum albumin (Stemcell Technologies), 500 μg/mL holo-transferrin (Sigma-Aldrich), 0.5 U/mL epoetin (Amgen), 10 μg/mL recombinant human insulin (Sigma-Aldrich), and 2 mM l-glutamine (Invitrogen) at 37°C.
Seahorse assays
A total of 800 000 cells per well were plated into a 24-well poly-lysine–coated Seahorse microplate and cells were plated in XF media (Sigma-Aldrich; medium powder, 1.85 g of NaCl and 600 μL of phenol red [0.5%] in 1 L) containing 25 mM glucose, 2 mM l-glutamine, and 1 mM pyruvate, pH 7.4. The microplate was centrifuged at 400g for 5 minutes and incubated at 37°C in a non-CO2 incubator for 45 minutes before measuring. Extracellular acidification rates (ECARs) and oxygen consumption rates (OCRs) were measured on a Seahorse Bioscience XF24-3 Extracellular Flux Analyzer; 1 μM oligomycin and carbonyl cyanide 4-(trifluoromethoxy)phenylhydrazone (FCCP), 0.5 μM rotenone and antimycin were used during the measurement. For the glycolysis assay, XF media containing 2 mM l-glutamine and 1 mM pyruvate were used for plating cells; 25 mM glucose, 1 μM oligomycin, and 50 mM 2-deoxy-D-glucose (2-DG) were used during the measurement.
Mouse study
Our mouse studies were conducted under animal protocols approved by the Division of Comparative Medicine at Massachusetts Institute of Technology (MIT). PHOSPHO1 knockout (KO) mice were gifted from C.F. and were rederived onto the C57BL/6J (The Jackson Laboratory) strain. PHOSPHO1-R74X mutant mice (referred to as PHOSPHO1 KO) were previously described.7 PHOSPHO1 KO mice were genotyped by performing polymerase chain reaction (PCR) (primer 1, 5′-TCCTCCTCACCTTCGACTTC-3′; primer 2, 5′-ATGCGGCGGAATAAACTGT-3′) and BsRDI enzyme digestion of the PCR product. The PCR product from wild-type (WT) mice is uncut and the PCR product from KO mice is cut into 2 bands. Mice were bled at indicated time points for performing complete blood count analysis on a SIEMENS ADVIA 2120i machine. Stress erythropoiesis was introduced by injecting 40 mg/kg phenylhydrazine hydrochloride (Sigma-Aldrich) at day 1 and day 3.
Blood from WT or KO mice was stained with 5 μM carboxyfluorescein succinimidyl ester (CFSE) according to the manufacturer’s instructions (Life Technologies); 10% FBS in PBS was then added to cells for quenching the staining reaction. CFSE-labeled red cells were then washed twice with PBS and resuspended in sterile PBS for IV injection into recipient mice. A drop of blood, ∼20 μL, was collected into heparinized tubes by retro-orbital bleeding at indicated time points and the percentage of CFSE-stained cells was identified by flow cytometry.
For morphological analyses, blood from 7-week-old WT or KO mice was stained on slides with May-Grünwald-Giemsa and diaminobenzidine hydrochloride reagents (Sigma-Aldrich).
Osmotic fragility test
Peripheral blood was collected in heparinized tubes and subsequently diluted with PBS; 8 μL of diluted blood was suspended in 200 μL of NaCl solutions ranging from 0% to 0.9% wt/vol. After incubation for 20 minutes at room temperature, samples were centrifuged at 700g at 4°C and supernatants were collected. Hemoglobin concentration in the supernatant was measured from the absorbance at 540 nm with a microplate reader.
LC/MS-based metabolomics and quantification of metabolite abundance within samples
One million (WT mouse R2-R5 cells) and 2 million (KO mouse R2-R5 cells, differentiation stages [Diff1-Diff5] human CD34+ cells) cells per sample were washed in cold 0.9% NaCl, and resuspended in −20°C, 600 μL of liquid chromatography–mass spectrometry (LC/MS)-grade methanol containing 17 isotope-labeled internal standards; 300 μL of LC/MS grade water and −20°C, 400 μL of LC/MS grade chloroform were added subsequently. Samples were vortexed at 4°C for 10 minutes and spun at 14 000g for 10 minutes at 4°C. The top layer (polar metabolites) and bottom layer (lipid metabolites) were analyzed by LC/MS. The values after normalization by total lipid abundance were used as variables for the multivariate statistical data analysis. All analyses and modeling were carried out using Metaboanalyst 3.0 (http://www.metaboanalyst.ca).8,9 Please see supplemental Methods (available on the Blood Web site) for the details on polar and lipid metabolite profiling by LC/MS.
Quantitative reverse transcription PCR primer
malas2: forward (F): 5′-GCAGGGCAACAGGACTTTG-3′, reverse (R): 5′-GGCAGCGTCCAATACTAAATAGG-3′; mfoxo3a: F: 5′-CTTCCCATATACCGCCAAGA-3′, R: 5′-TGGATAGTCTGCATGGGTGA-3′; mfech: F: 5′-GGTGGATCCCCCATCAAGAT-3′, R: 5′-CACCATGCCTTCTCCTTGCT-3′; mhbb-b: F: 5′-CCTTTGCCAGCCTCAGTGAG-3′, R: 5′-CAGGATCCACATGCAGCTTGT-3′; mepb4.1: F: 5′-ACCTGAACTCTGTCCCTCTG-3′, R: 5′-CATATCCCAGGATCTGTTGCC-3′; mkit: F: 5′-AGCAATGGCCTCACGAGTTCTA-3′, R: 5′-CCAGGAAAAGTTTGGCAGGAT-3′; mslc4a: F: 5′-TCAGGTCTATGTGGAGCTTCA-3′, R: 5′-CATCCTCTCGAAGGTTTTCCTC-3′; m18srRNA: F: 5′-AGGGGAGAGCGGGTAAGAGA-3′, R: 5′-GGACAGGACTAGGCGGAACA-3′; mphos1: F: 5′-GGCGATTTGTTGCAGTTCATA-3′, R: 5′-GAGGATGCGGCGGAATAAA-3′; hphos1: F: 5′-GAAGGGAGATTCGGCAAAGA-3′, R: CCGAGGTGGGTTAACTGAATAG-3′; hgapdh: F: 5′-GTGGTCTCCTCTGACTTCAAC-3′, R: 5′-CCTGTTGCTGTAGCCAAATTC-3′; mhk1: F: 5′-CACTGATGGAGGTGAAGAAGAA-3, R: 5′-GGGATGCTCCGAACATAAGAA-3; mhk2: F: 5′-GCTGGAGGTTAAGAGAAGGATG-3, R: 5′-TGGAGTGGCACACACATAAG-3; mgpi1: F: 5′-CCGTGTCTGGTTTGTCTCTAA-3, R: 5′-GAAGGTCTTGGAGGCGATTAT-3; mpfkm: F: 5′-GGCTCTCGTCTCAACATCATC-3, R: 5′-TCATATCCAAGGCGCTTCAC-3; mpfkl: F: 5′-CTGGTGAAGGAAGGCAAGAT-3, R: 5′-AGTGCCACAGAAGTCGTTATC-3; maldoa: F: 5′-CCTCGCTTGTCAAGGAAAGTA-3, R: 5′-GCCTTAGTTCAGCTCTGGTTAG-3; mpgk1: F: 5′-GGGCAAGGATGTTCTGTTCT-3, R: 5′-TCCCTTCCCTTCTTCCTCTAC-3; mpgam1: F: 5′-GGTCTGACAGGTCTCAACAAA-3, R: 5′-GGCGGTGGGACATCATAAG-3; meno1: F: 5′-CTCAAGACTGCAATCGCAAAG-3, R: 5′-CATACTTGCCAGACCTGTAGAA-3; matf4: F: 5′-CCACTCCAGAGCATTCCTTTAG-3, R: 5′-CTCCTTTACACATGGAGGGATTAG-3; mphgdh: F: 5′-TGGTGGAGAAGCAGAACTTG-3, R: 5′-GACATCAGCAGTGACCTTAGTAG-3; mpsat1: F: 5′-GCATTCGTGCCTCTCTGTATAA-3, R: 5′-AGCTGATGCATCTCCAAGAAA-3; mpsph: F: 5′-GCAGTGTGCTTTGATGTTGATAG-3, R: 5′-ATGGCTCTCCGTGTCATTTC-3; mshmt1: F: 5′-GGAATTCGGCGATCCACTT-3, R: 5′-GTCTGTTCCTCCGGTCTTTATG-3; mshmt2: F: 5′-GACCCGGAAGTTACCTTTCTT-3, R: 5′-CCTGGCTCTTGCCCTAAAT-3.
Generation of recombinant retroviruses and lentiviruses
293T cells were cultured in Dulbecco modified eagle medium with 10% FBS in a humidified 5% CO2 atmosphere at 37°C. Murine stem cell virus (MSCV)-based plasmids and pCLECO- or pLKO.3G-based plasmids and packaging vectors, VSV-G and pD8.9, were incubated with medium and Fugene 6 according to the Promega protocol. The mixture medium was changed after 6 hours; retrovirus and lentivirus were collected after 24 hours and 72 hours for transfection, respectively. Retroviruses for short hairpin RNA (shRNA) were constructed using the MSCV-pgkGFP-U3-U6P-Bbs vector (murine stem cell retroviral vector-pgk promoter-GFP-U6 promoter shRNA). The control shRNA construct was designed against the firefly luciferase gene. The sequence of shRNA against mphospho1 is: phospho1-1: GCTCCTGCTTCGAGGTTATTCGTCGACGAATAACCTCGAAGCAGGAGC; phospho1-6: GAGCCGTCCCTATCTATGCAGTTAAGTCGACTTAACTGCATAGATAGGGACGGCTC; phospho1-7: GGACTACGATGCCTATCTAGGGTCGACCCTAGATAGGCATCGTAGTCC.
Lentiviruses for shRNA were constructed using the pLKO.3G vector cut with EcoRI and PacI site. The sequence of shRNA against hphospho1 is: Phos1-3: GAATTTCTGGAATCTCGTATTCTCGAGAATACGAGATTCCAGAAATTC; Phos1-4: TCAGAGCCGTCCCTATCTATTCTCGAGAATAGATAGGGACGGCTCTGA.
Statistical analysis
All analysis data are presented as mean ± standard error of the mean (SEM) unless specified otherwise. Prism was used to calculate the statistical significance. Unless otherwise mentioned, an unpaired 2-tailed Student t test was used to calculate the P values. P < .05 was considered significant (*P < .05; **P < .01; ***P < .001; ****P < .0001).
Results
Increased phosphocholine metabolism during terminal erythropoiesis
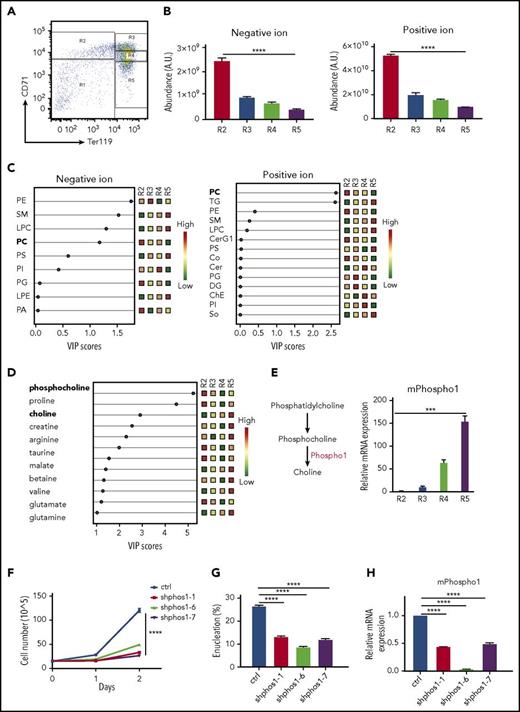
As murine erythrocytes progress through differentiation, they sequentially induce synthesis of the transferrin receptor, CD71, followed by induction of Ter119, and subsequently lose CD71. We isolated subpopulations of erythroblasts, R2, R3, R4, and R5, from E14.5 mouse fetal livers according to the surface expression of CD71 and Ter119 (Figure 1A) and extracted polar and lipid metabolites. We observed a decrease in total lipid abundance during terminal erythropoiesis from the R2 to R5 stage (Figure 1B). Using partial least squares discriminant analysis to calculate the variable importance in projection (VIP), we identified a significant decrease of PC and an increase of triglyceride (TG) and sphingomyelin (SM) levels during differentiation from R2 to R5 (Figure 1C), suggesting dynamic changes in lipid composition during terminal erythropoiesis. Two of the most significantly altered polar metabolites are the hydrolyzed product of PC, phosphocholine, and its catabolic end product, choline (Figure 1D-E). The level of phosphocholine is significantly downregulated, as is PC, the lipid precursor of phosphocholine. Conversely, the level of choline is significantly upregulated during terminal differentiation (Figure 1D). Taken together, our data suggest that the catabolism of PC and phosphocholine to choline occurs during terminal mouse erythropoiesis.
Increased phosphocholine metabolism during terminal mouse fetal erythropoiesis. (A) FACS plot of R1-R5 populations. E14.5 mouse fetal liver cells were sorted into 4 groups (R2: CD71 high, Ter119−; R3: CD71 high, Ter119+; R4: CD71 low, Ter119+; R5: CD71−, Ter119+). (B) Lipids from R2-R5 groups were analyzed and total negative and positive ion abundances were retrieved from LC/MS and plotted. One million cells per group were used for metabolite extraction (n = 3). (C) The lipid composition of mouse R2-R5 cells was analyzed by partial least squares discriminant analysis (PLS). The signal of each class of lipids was normalized by total lipid abundance from the LC/MS results, and the results are shown as colored boxes (from high to low: red to green) and plotted with variable importance in the projection (VIP) score (VIP > 1: significant). PC is bolded and shows its expression from high (red) in R2 cells to low (green) in R5 cells. (D) Polar metabolites from R2-R5 cells were analyzed. Each metabolite signal is normalized to total lipid abundance. Polar metabolites differentiating between the 4 groups are shown as colored boxes and plotted with VIP score (VIP > 1: significant). Phosphocholine and choline are labeled in bold font. Relative metabolite abundance is indicated in the bar, with red representing metabolite accumulation (n = 3 per group). (E) Left, PHOSPHO1 hydrolyzes phosphocholine to choline. Right, Mouse PHOSPHO1 gene expression in each group of cells normalized to 18S ribosomal RNA (rRNA). (n = 3 per group, mean + SEM). (F) Knocking down mPHOSPHO1 in cultures of lineage-negative E14.5 mouse fetal liver erythroblasts using 3 different shRNAs reduces cell proliferation in differentiation medium (n = 3 per group, mean ± SEM). Cells were expanded in maintenance medium for 1 day and differentiated in differentiation medium for 2 days. (G) Knocking down mPHOSPHO1 in lineage-negative E14.5 mouse fetal liver using 3 shRNAs impairs enucleation after 2 days of in vitro differentiation (n = 3 per group, mean + SEM). (H) mPHOSPHO1 gene expression of cells assayed in panels F and G. Messenger RNA (mRNA) was extracted from cells differentiated for 1 day. A.U., arbitrary unit; CerG1, glycosphingolipid; ChE, cholesteryl ester; Co, coenzyme; ctrl, control; DG, diglyceride; LPC, lysophosphatidylcholine; LPE, lysophosphatidylethanolamine; PA, phosphatidic acid; PC, phosphatidylcholine; PE, phosphatidylethanolamine; PG, phosphatidylglycerol; PI, phosphatidylinositol; PS, phosphatidylserine; SM, sphingomyelin; So, sphingosine; TG, triglyceride.
Increased phosphocholine metabolism during terminal mouse fetal erythropoiesis. (A) FACS plot of R1-R5 populations. E14.5 mouse fetal liver cells were sorted into 4 groups (R2: CD71 high, Ter119−; R3: CD71 high, Ter119+; R4: CD71 low, Ter119+; R5: CD71−, Ter119+). (B) Lipids from R2-R5 groups were analyzed and total negative and positive ion abundances were retrieved from LC/MS and plotted. One million cells per group were used for metabolite extraction (n = 3). (C) The lipid composition of mouse R2-R5 cells was analyzed by partial least squares discriminant analysis (PLS). The signal of each class of lipids was normalized by total lipid abundance from the LC/MS results, and the results are shown as colored boxes (from high to low: red to green) and plotted with variable importance in the projection (VIP) score (VIP > 1: significant). PC is bolded and shows its expression from high (red) in R2 cells to low (green) in R5 cells. (D) Polar metabolites from R2-R5 cells were analyzed. Each metabolite signal is normalized to total lipid abundance. Polar metabolites differentiating between the 4 groups are shown as colored boxes and plotted with VIP score (VIP > 1: significant). Phosphocholine and choline are labeled in bold font. Relative metabolite abundance is indicated in the bar, with red representing metabolite accumulation (n = 3 per group). (E) Left, PHOSPHO1 hydrolyzes phosphocholine to choline. Right, Mouse PHOSPHO1 gene expression in each group of cells normalized to 18S ribosomal RNA (rRNA). (n = 3 per group, mean + SEM). (F) Knocking down mPHOSPHO1 in cultures of lineage-negative E14.5 mouse fetal liver erythroblasts using 3 different shRNAs reduces cell proliferation in differentiation medium (n = 3 per group, mean ± SEM). Cells were expanded in maintenance medium for 1 day and differentiated in differentiation medium for 2 days. (G) Knocking down mPHOSPHO1 in lineage-negative E14.5 mouse fetal liver using 3 shRNAs impairs enucleation after 2 days of in vitro differentiation (n = 3 per group, mean + SEM). (H) mPHOSPHO1 gene expression of cells assayed in panels F and G. Messenger RNA (mRNA) was extracted from cells differentiated for 1 day. A.U., arbitrary unit; CerG1, glycosphingolipid; ChE, cholesteryl ester; Co, coenzyme; ctrl, control; DG, diglyceride; LPC, lysophosphatidylcholine; LPE, lysophosphatidylethanolamine; PA, phosphatidic acid; PC, phosphatidylcholine; PE, phosphatidylethanolamine; PG, phosphatidylglycerol; PI, phosphatidylinositol; PS, phosphatidylserine; SM, sphingomyelin; So, sphingosine; TG, triglyceride.
Terminal erythropoiesis is a series of dynamic and intricate processes involving fine coordination of gene expression, cell proliferation, hemoglobin production, cell size decrease, cell cycle exit, chromatin condensation, and enucleation.10-12 Using RNA-sequencing data from human and mouse terminal erythropoiesis,13,14 we found that 16 conserved highly expressed genes were at least twofold upregulated both from the murine R2 to R4 or R5 stages and from human proerythroblasts to orthochromatic or polychromatic erythroblasts. Among these genes, PHOSPHO1 is the only one directly related to PC metabolism. We thus examined PHOSPHO1 messenger RNA (mRNA) expression by real-time quantitative reverse transcription PCR to confirm the temporal increase of PHOSPHO1 expression during terminal erythropoiesis (Figure 1E).
PHOSPHO1 is required for fetal erythropoiesis and stress erythropoiesis
To investigate the role of PHOSPHO1 in terminal erythropoiesis, we first abrogated PHOSPHO1 expression using shRNA in mouse fetal erythroid progenitors. Relative to control cells, the cell proliferation rate was lower in PHOSPHO1-depleted cells during the 2 days of differentiation (Figure 1F,H). PHOSPHO1-depleted cells also exhibited a lower extent of enucleation compared with control cells (Figure 1G).
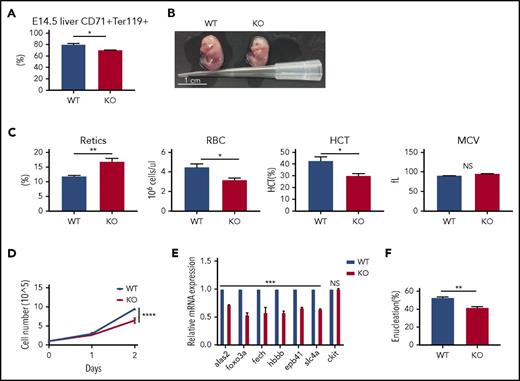
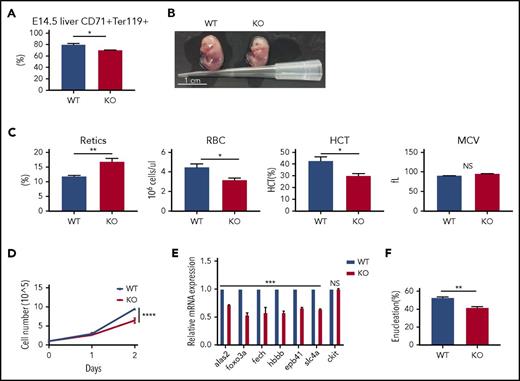
To further validate the role of PHOSPHO1 in terminal erythropoiesis, we examined many phenotypes of the PHOSPHO1 loss-of-function (KO) mice. We first analyzed the population of terminal erythrocytes in fetal livers; we lysed mature red cells and analyzed the remaining cells in E14.5 fetal livers (Figure 2A) by staining with CD71 and Ter119 antibodies. PHOSPHO1 KO fetal livers had a small but significantly lower percentage of CD71 and Ter119 double-positive cells, indicating fewer erythroblasts at a terminal differentiation stage. Moreover, E14.5 KO embryos were slightly smaller and paler (Figure 2B), and half-day-old KO newborn neonates had a higher percentage of reticulocytes and lower red cell counts and hematocrit, implying an anemia in KO fetuses (Figure 2C).
mPHOSPHO1 is essential for fetal erythropoiesis. (A) Smaller percentages of CD71+Ter119+ erythroblasts in E14.5 KO mouse livers. Mature red cells in fetal livers were lysed and cells were stained with anti-CD71 and anti-Ter119 antibody (n = 9 fetal livers from 3 mice per group, mean + SEM). (B) Photographs of E14.5 WT and KO embryos. (C) Complete blood counts of 0.5-day WT and KO neonates (n = 7 per group, mean + SEM). (D) Lower growth rate in erythroblasts depleted of mPHOSPHO1. E14.5 fetal liver lineage-negative cells were isolated from WT and PHOSPHO1-KO mice, expanded in maintenance medium for 1 day, and cultured in differentiation medium for 2 days (n = 3 per group, mean ± SEM). Cells were counted during the 2 days of differentiation. (E) Gene expression of WT and KO erythroblasts after 1 day differentiation (n = 3 per group, mean + SEM). mRNA expression is plotted relative to expression of 18s rRNA. (F) Enucleation is lower in KO erythroblasts after 2 days of differentiation (n = 3 per group, mean + SEM). HCT, hematocrit; NS, not significant.
mPHOSPHO1 is essential for fetal erythropoiesis. (A) Smaller percentages of CD71+Ter119+ erythroblasts in E14.5 KO mouse livers. Mature red cells in fetal livers were lysed and cells were stained with anti-CD71 and anti-Ter119 antibody (n = 9 fetal livers from 3 mice per group, mean + SEM). (B) Photographs of E14.5 WT and KO embryos. (C) Complete blood counts of 0.5-day WT and KO neonates (n = 7 per group, mean + SEM). (D) Lower growth rate in erythroblasts depleted of mPHOSPHO1. E14.5 fetal liver lineage-negative cells were isolated from WT and PHOSPHO1-KO mice, expanded in maintenance medium for 1 day, and cultured in differentiation medium for 2 days (n = 3 per group, mean ± SEM). Cells were counted during the 2 days of differentiation. (E) Gene expression of WT and KO erythroblasts after 1 day differentiation (n = 3 per group, mean + SEM). mRNA expression is plotted relative to expression of 18s rRNA. (F) Enucleation is lower in KO erythroblasts after 2 days of differentiation (n = 3 per group, mean + SEM). HCT, hematocrit; NS, not significant.
We next isolated E14.5 lineage-negative fetal liver cells from KO mice and differentiated them into reticulocytes in vitro. Erythroblasts from KO mice showed lower proliferation rates in differentiation medium (Figure 2D), reduced expression of genes that are normally upregulated in terminal erythropoiesis (Figure 2E), and decreased enucleation after 2 days of differentiation (Figure 2F). Consistent with the results from shRNA-treated cells (Figure 1F-H), these data establish that PHOSPHO1 is required for fetal terminal erythropoiesis and that its function is cell autonomous.
To our surprise, the numbers and the mean corpuscular volume (MCV) of red cells in PHOSPHO1 KO mice at different ages were mostly normal (Figure 3A). However, the hematocrit was slightly lower in 7-week-old KO mice, likely due to a slightly lower number of red cells (Figure 3A) and there was a lower percentage of CD71+, Ter119+ erythroblasts in bone marrow of 7-week-old mice (Figure 3B). The number of reticulocytes in 5-week-old PHOSPHO1 KO mice was significantly increased above normal and this explained the slightly higher MCV of red cells in 5-week-old KO mice. Moreover, spleens of 5-week-old KO mice were also larger than normal, suggesting KO mice suffer from a partially compensated anemia (Figure 3C) and that stress erythropoiesis was occurring in these KO mice to compensate for the defects in terminal erythropoiesis. To test this hypothesis, we induced stress erythropoiesis by injecting phenylhydrazine into 7-week-old mice. After 5 days of phenylhydrazine treatment, KO mice had a lower hematocrit, red cell count, and MCV compared with WT mice (Figure 3D). These KO mice also showed splenomegaly (Figure 3E) and enriched populations of early (Figure 3F) and terminal erythroid cells (Figure 3G) in their spleens, indicating a high erythropoietic demand and stress erythropoiesis in these mice. Taken together, these data indicate that PHOSPHO1 is required for both normal and stress erythropoiesis in adult mice.
mPHOSPHO1 is essential for stress erythropoiesis. (A) Measurements of complete blood counts from mice at indicated ages are plotted (n = 4 per group, mean + SEM). (B) Fewer Ter119+, CD71+ cells in the bone marrow of 7-week-old KO mice relative to WT mice (n = 3 per group, mean + SEM). Bone marrow cells were isolated and mature red cells were lysed before nucleated cells were stained with CD71 and Ter119 antibodies. (C) Elevated ratio of spleen to body weight of 5-week-old KO mice (n = 4 per group, mean + SEM). (D) Complete blood count measurements of 7-week-old WT and KO mice were performed during phenylhydrazine-induced anemia. Lower hematocrit of KO mice shows slower recovery of RBCs (n = 5 per group, mean ± SEM; analysis of variance [ANOVA] used for statistics). (E) Higher ratio of spleen to body weight of 7-week-old KO mice following 4 days of phenylhydrazine-induced stress erythropoiesis (n = 5 per group, mean + SEM, 2-way ANOVA were used to calculate the statistic significance). (F) Higher numbers of c-Kit+CD71+ cells in the spleens of KO mice at days 3 and 13 post-phenylhydrazine injection (n = 3 per group, mean + SEM). (G) Higher numbers of CD71+, Ter119+ cells in the spleens of KO mice at days 3 and 13 post-phenylhydrazine injection (n = 3 per group, mean + SEM). NS, not significant.
mPHOSPHO1 is essential for stress erythropoiesis. (A) Measurements of complete blood counts from mice at indicated ages are plotted (n = 4 per group, mean + SEM). (B) Fewer Ter119+, CD71+ cells in the bone marrow of 7-week-old KO mice relative to WT mice (n = 3 per group, mean + SEM). Bone marrow cells were isolated and mature red cells were lysed before nucleated cells were stained with CD71 and Ter119 antibodies. (C) Elevated ratio of spleen to body weight of 5-week-old KO mice (n = 4 per group, mean + SEM). (D) Complete blood count measurements of 7-week-old WT and KO mice were performed during phenylhydrazine-induced anemia. Lower hematocrit of KO mice shows slower recovery of RBCs (n = 5 per group, mean ± SEM; analysis of variance [ANOVA] used for statistics). (E) Higher ratio of spleen to body weight of 7-week-old KO mice following 4 days of phenylhydrazine-induced stress erythropoiesis (n = 5 per group, mean + SEM, 2-way ANOVA were used to calculate the statistic significance). (F) Higher numbers of c-Kit+CD71+ cells in the spleens of KO mice at days 3 and 13 post-phenylhydrazine injection (n = 3 per group, mean + SEM). (G) Higher numbers of CD71+, Ter119+ cells in the spleens of KO mice at days 3 and 13 post-phenylhydrazine injection (n = 3 per group, mean + SEM). NS, not significant.
Given that phosphocholine is the hydrolyzed product of PC, we postulated that the lipid composition would be changed in red cells and their progenitors depleted of PHOSPHO1. Comparison of the lipid composition in mature normal and KO red cells showed that there were indeed several differences, including increases in ceramide, TG, and lysophosphatidylcholine and decreases in phosphatidic acid and phosphatidylinositol in KO red cells (supplemental Figure 1A). Because abnormal lipid compositions in mature red cells cause some rare red cell hemolytic diseases,15-17 we hypothesized that KO red cells would be more fragile compared with WT red cells. However, we did not observe changes in the cell morphology, the half-life, or the osmotic fragility of KO red cells from adult mice (supplemental Figure 1B-D), suggesting the absence of a hemolytic anemia. These results suggest that, despite their lipid abnormalities, mature KO red cells circulate normally.
Lower oxidative phosphorylation, higher glycolysis, and ATP deficiency in PHOSPHO1 KO erythroblasts
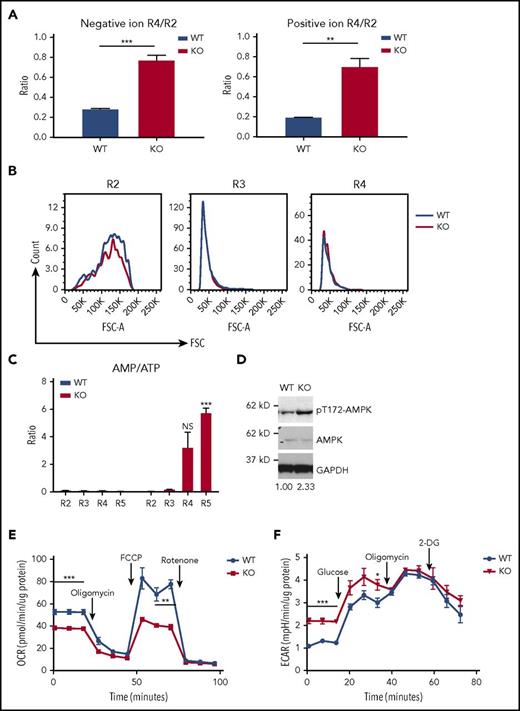
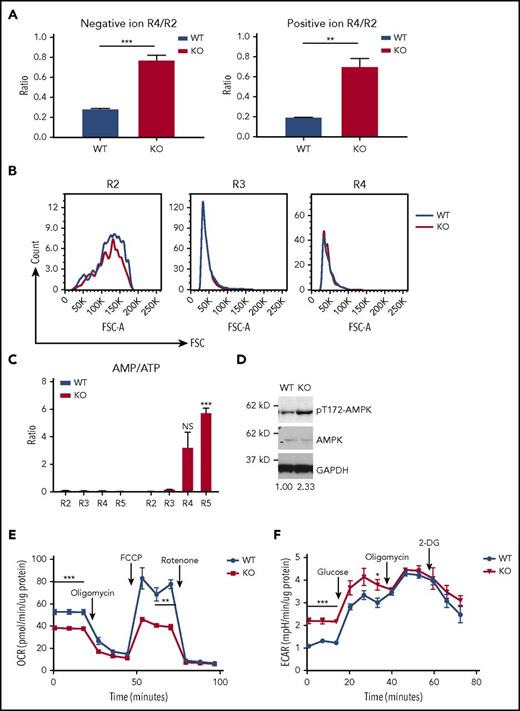
To understand the function of PHOSPHO1 in terminal erythropoiesis, we compared metabolomic data from developing WT and KO fetal liver cells. The amount of lipid per cell drops 80% from R2 to R4 stage in WT cells, whereas in KO embryos the drop in lipid per cell is only 20% (Figure 4A). The sizes of WT and KO fetal liver erythroid R2, R3, and R4 populations, gated according to the expression levels of CD71 and Ter119, were similar; as expected the cell size decreased from the R2 to the R4 stage. (Figure 4B). Instead, this accumulation of lipid led us to suspect that fatty acid oxidation is impaired in KO cells, as fatty acid metabolism can be used to provide energy for cellular processes through oxidative phosphorylation.18,19 Supporting this contention, we found that, as measured by AMP/adenosine triphosphate (ATP) ratios, energy levels were reduced in KO erythroblasts (Figure 4C). Concomitantly, the level of active phospho-T172-AMPKα increased in PHOSPHO1-depleted fetal liver erythroblasts at 1 day of differentiation, indicating AMPK activation by the elevated AMP levels (Figure 4D).
Lower oxidative phosphorylation, higher glycolysis, and ATP deficiency in PHOSPHO1-KO erythroblasts. (A) Erythroid progenitors from KO mice lost less lipid during the transition from the R2 to the R4 state than did cells from WT mice. Total lipid signals of R2 and R4 cells from lipidomic data shown in Figure 1B were used to calculate the ratios (n = 3 per group, mean + SEM). (B) WT and KO erythroblasts have similar sizes at the same differentiation stages. Representative forward scatter (FSC) and cell count of R2, R3, and R4 populations from WT and KO E14.5 fetal liver were plotted. Cells were gated as shown in Figure 1A (n = 3 per group). (C) AMP to ATP ratio is higher in KO 1-day–differentiated erythroblasts (n = 3 per group, mean + SEM). (D) Increased phospho-T172-AMPKα in 1-day in vitro–differentiated KO erythroblasts compared with WT. Ratio of phospho-AMPK to AMPK signal is indicated below, normalized to WT cells. Cells were isolated from E14.5 WT or KO fetal livers and expanded in maintenance medium for 1 day and cultured in differentiation medium for 1 day. (E) Basal and maximal OCR of 1-day–differentiated KO fetal liver erythroblasts is lower than that of WT erythroblasts; 1 μM oligomycin and FCCP, 0.5 μM rotenone and antimycin were used (n = 5 per group, mean ± SEM). (F) Higher basal glycolysis in KO erythroblasts. ECAR of 1-day in vitro–differentiated WT and KO erythroblasts was measured; 25 mM glucose, 1 μM oligomycin, and 50 mM 2-DG were sequentially added to the culture medium (n = 4 per group, mean ± SEM).
Lower oxidative phosphorylation, higher glycolysis, and ATP deficiency in PHOSPHO1-KO erythroblasts. (A) Erythroid progenitors from KO mice lost less lipid during the transition from the R2 to the R4 state than did cells from WT mice. Total lipid signals of R2 and R4 cells from lipidomic data shown in Figure 1B were used to calculate the ratios (n = 3 per group, mean + SEM). (B) WT and KO erythroblasts have similar sizes at the same differentiation stages. Representative forward scatter (FSC) and cell count of R2, R3, and R4 populations from WT and KO E14.5 fetal liver were plotted. Cells were gated as shown in Figure 1A (n = 3 per group). (C) AMP to ATP ratio is higher in KO 1-day–differentiated erythroblasts (n = 3 per group, mean + SEM). (D) Increased phospho-T172-AMPKα in 1-day in vitro–differentiated KO erythroblasts compared with WT. Ratio of phospho-AMPK to AMPK signal is indicated below, normalized to WT cells. Cells were isolated from E14.5 WT or KO fetal livers and expanded in maintenance medium for 1 day and cultured in differentiation medium for 1 day. (E) Basal and maximal OCR of 1-day–differentiated KO fetal liver erythroblasts is lower than that of WT erythroblasts; 1 μM oligomycin and FCCP, 0.5 μM rotenone and antimycin were used (n = 5 per group, mean ± SEM). (F) Higher basal glycolysis in KO erythroblasts. ECAR of 1-day in vitro–differentiated WT and KO erythroblasts was measured; 25 mM glucose, 1 μM oligomycin, and 50 mM 2-DG were sequentially added to the culture medium (n = 4 per group, mean ± SEM).
We therefore compared oxidative phosphorylation activity between WT and KO fetal liver erythroblasts at 1 day of differentiation. Both basal and maximal respiration were lower in KO cells, compared with WT cells (Figure 4E), and the glycolytic activity of KO cells was higher (Figure 4F). These results indicate that KO cells experience a greater dependence on glycolysis and a concurrent inhibition of oxidative phosphorylation.
PHOSPHO1 KO erythroblasts increase glycolysis to produce serine/glycine
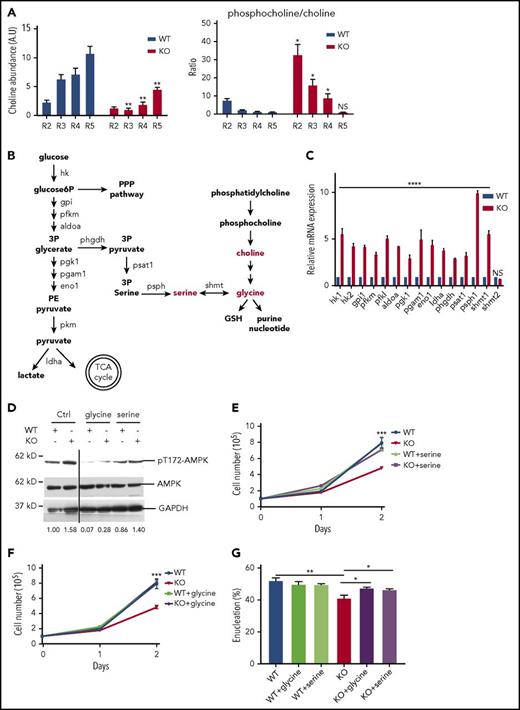
The function of PHOSPHO1 is to convert phosphocholine to choline; indeed, there existed a much higher amount of choline and a higher ratio of phosphocholine to choline in KO cells (Figure 5A). Given that the intersection between choline metabolism and the glycolytic pathway is the production of glycine and serine (Figure 5B),20-22 we hypothesized that the increased glycolysis of KO cells could result from the lack of glycine or serine, metabolites that can be produced both from choline and from 3-phosphoglycerate, an intermediate of glycolysis. We therefore compared the expressions of genes encoding enzymes involved in glycolysis and serine/glycine production in WT and KO fetal liver cells at 1 day of differentiation. Many of these genes, especially phosphoserine phosphatase (psph1) and serine hydroxymethyltransferase 1 (shmt1), were highly overexpressed in KO cells (Figure 5C), indicating increased shunting of glycolysis intermediates to serine and glycine. As all of these induced enzymes are in the cytosol, except for serine hydroxymethyltransferase 2 (shmt2), which serves the same function as shmt1, interconverting glycine and serine but in the mitochondria, we conclude that production of glycine and serine occurs mainly in the cytosol, where glycolysis occurs. This metabolic switch would lead to the observed loss of ATP production from phosphoenolpyruvate to pyruvate during glycolysis in KO cells (Figure 4E-F).
PHOSPHO1 KO erythroblasts are deficient in choline and increase glycolysis to produce serine and/or glycine. (A) Left, Choline abundance is higher in WT 1-day–differentiated erythroblasts. Right, The phosphocholine to choline ratio is higher in R2, R3, and R4 groups of KO erythroblasts compared with WT cells. Metabolites were normalized to total lipid (n = 3 per group, mean + SEM). (B) Crosstalk of phosphocholine catabolism and glycolysis. Production of serine and glycine links the 2 pathways. Enzymes involved in the steps are labeled. (C) Increased mRNA expression of genes encoding proteins involved in glycolysis and serine/glycine production in 1-day–differentiated KO erythroblasts. Lineage-negative cells from WT and KO E14.5 fetal livers were isolated and cultured in maintenance medium for 1 day and differentiation medium for 1 day prior to RNA analysis; mRNA levels are normalized to that of 18s rRNA. (D) Phospho-T172-AMPKα signal is higher in 1-day–differentiated KO erythroblasts than in WT cells, and the signal is reduced in cells treated with 0.1 mM serine or 0.1 mM glycine. Relative phospho-AMPK to AMPK signal ratio is depicted below. (E) Proliferation is increased to normal in KO erythroblasts cultured in differentiation medium containing 0.2 mM serine (n = 3 per group, mean + SEM). (F) Proliferation is increased to normal in KO erythroblasts cultured in differentiation medium containing 0.1 mM glycine (n = 3 per group, mean + SEM). (G) Increased enucleation at day 2 of differentiation of KO erythroblasts cultured in 0.1 mM serine or glycine containing differentiation medium (n = 3 per group, mean + SEM). 3P glycerate, 3-phosphoglycerate; 3P pyruvate, 3-phosphohydroxypyruvate; GSH, glutathione; PE pyruvate, phosphoenolpyruvate; PPP, pentose phosphate pathway; TCA cycle, tricarboxylic acid cycle.
PHOSPHO1 KO erythroblasts are deficient in choline and increase glycolysis to produce serine and/or glycine. (A) Left, Choline abundance is higher in WT 1-day–differentiated erythroblasts. Right, The phosphocholine to choline ratio is higher in R2, R3, and R4 groups of KO erythroblasts compared with WT cells. Metabolites were normalized to total lipid (n = 3 per group, mean + SEM). (B) Crosstalk of phosphocholine catabolism and glycolysis. Production of serine and glycine links the 2 pathways. Enzymes involved in the steps are labeled. (C) Increased mRNA expression of genes encoding proteins involved in glycolysis and serine/glycine production in 1-day–differentiated KO erythroblasts. Lineage-negative cells from WT and KO E14.5 fetal livers were isolated and cultured in maintenance medium for 1 day and differentiation medium for 1 day prior to RNA analysis; mRNA levels are normalized to that of 18s rRNA. (D) Phospho-T172-AMPKα signal is higher in 1-day–differentiated KO erythroblasts than in WT cells, and the signal is reduced in cells treated with 0.1 mM serine or 0.1 mM glycine. Relative phospho-AMPK to AMPK signal ratio is depicted below. (E) Proliferation is increased to normal in KO erythroblasts cultured in differentiation medium containing 0.2 mM serine (n = 3 per group, mean + SEM). (F) Proliferation is increased to normal in KO erythroblasts cultured in differentiation medium containing 0.1 mM glycine (n = 3 per group, mean + SEM). (G) Increased enucleation at day 2 of differentiation of KO erythroblasts cultured in 0.1 mM serine or glycine containing differentiation medium (n = 3 per group, mean + SEM). 3P glycerate, 3-phosphoglycerate; 3P pyruvate, 3-phosphohydroxypyruvate; GSH, glutathione; PE pyruvate, phosphoenolpyruvate; PPP, pentose phosphate pathway; TCA cycle, tricarboxylic acid cycle.
The reduction in ATP production in KO cells was reversed by differentiation in medium containing excess glycine or serine, as indicated by reduced phospho-T172-AMPKα signal (Figure 5D). Glycine or serine supplementation also restored almost normal proliferation and enucleation of KO cells (Figure 5D-G). Taken together, our data show that PHOSPHO1 activity is essential for maintaining oxidative phosphorylation during mouse terminal erythropoiesis via the production of glycine and serine downstream of the phosphocholine catabolic pathway.
PHOSPHO1 depletion impairs human erythropoiesis
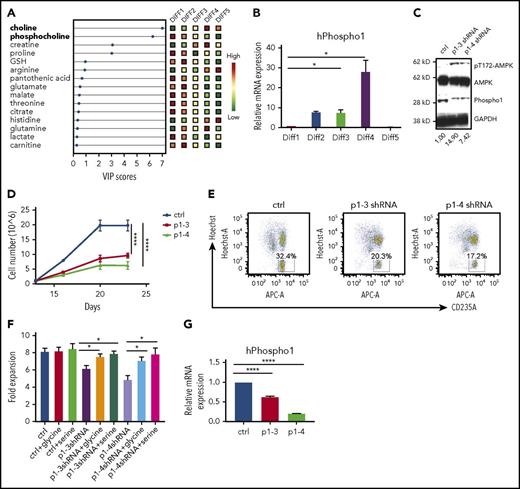
To strengthen our findings, we studied aspects of metabolism during the 23-day period of differentiation in vitro of human mobilized bone marrow CD34+ stem/progenitor cells into enucleated erythrocytes.6 The culture system comprises 5 stages and differentiation is highly synchronized. We analyzed metabolites from cells at the end of each of the differentiation stages (Diff1-Diff5). The upregulation of choline and downregulation of phosphocholine levels during the course of differentiation mirrors our metabolic analysis of mouse erythropoiesis (Figure 6A). PHOSPHO1 gene expression was also continuously increased from Diff1 to Diff4, when the cells begin to enucleate (Figure 6B). As in mouse erythroblasts, reduction of PHOSPHO1 increased levels of phospho-T172-AMPK, indicating an energy crisis (Figure 6C). Cell proliferation was dramatically impaired after PHOSPHO1 knockdown (Figure 6D) and fewer PHOSPHO1-knockdown cells were enucleated at the end of differentiation (Figure 6E). Importantly, proliferation of PHOSPHO1-knockdown cells was increased to normal in medium supplemented with glycine or serine (Figure 6F-G). Collectively, these data show that the role of PHOSPHO1 in terminal erythropoiesis is conserved in mice and humans.
PHOSPHO1 depletion impairs human erythropoiesis in vitro. (A) Human CD34+ cells were differentiated using a 5-stage in vitro culture system and metabolites were extracted and analyzed at the end of the indicated stages of differentiation. Relative amounts of polar metabolites in the 5 groups of cells are shown in colored boxes on the right and their VIP scores are shown on the bottom. Phosphocholine and choline are labeled in bold on the left (n = 3 per group). (B) Human PHOSPHO1 gene expression at each differentiation stage normalized to 18S rRNA (n = 3 per group, mean + SEM). (C) Increased phospho-T172-AMPKα signal in PHOSPHO1-depleted human erythroblasts after 20 days of in vitro culture. Relative phospho-AMPK to AMPK signal ratio is depicted below. (D) Lower terminal proliferation rate in human erythroblasts depleted of PHOSPHO1 by transfection with 2 shRNAs. Cell number was counted after GFP+ cells were sorted at day 11 and at the end of Diff3, Diff4, and Diff5 (n = 3 per group, mean ± SEM). (E) Lower percentages of enucleation in PHOSPHO1-depleted human erythroblasts after 20 days of in vitro culture. CD34+ cells were expanded and differentiated as described in “Materials and methods.” Enucleation as judged by Hoechst staining and glycophorin A surface expression was measured at day 20. (F) Control and PHOSPHO1-depleted human erythroblasts were cultured in medium supplemented with addition of 0.1 mM glycine or 0.2 mM serine at day 12. Cell numbers were counted at day 12 and day 16; fold cell expansion is shown. (G) hPHOSPHO1 RNA expression in control and shRNA knocked-down cells that were assayed in panels D through F (n = 3 per group, mean + SEM).
PHOSPHO1 depletion impairs human erythropoiesis in vitro. (A) Human CD34+ cells were differentiated using a 5-stage in vitro culture system and metabolites were extracted and analyzed at the end of the indicated stages of differentiation. Relative amounts of polar metabolites in the 5 groups of cells are shown in colored boxes on the right and their VIP scores are shown on the bottom. Phosphocholine and choline are labeled in bold on the left (n = 3 per group). (B) Human PHOSPHO1 gene expression at each differentiation stage normalized to 18S rRNA (n = 3 per group, mean + SEM). (C) Increased phospho-T172-AMPKα signal in PHOSPHO1-depleted human erythroblasts after 20 days of in vitro culture. Relative phospho-AMPK to AMPK signal ratio is depicted below. (D) Lower terminal proliferation rate in human erythroblasts depleted of PHOSPHO1 by transfection with 2 shRNAs. Cell number was counted after GFP+ cells were sorted at day 11 and at the end of Diff3, Diff4, and Diff5 (n = 3 per group, mean ± SEM). (E) Lower percentages of enucleation in PHOSPHO1-depleted human erythroblasts after 20 days of in vitro culture. CD34+ cells were expanded and differentiated as described in “Materials and methods.” Enucleation as judged by Hoechst staining and glycophorin A surface expression was measured at day 20. (F) Control and PHOSPHO1-depleted human erythroblasts were cultured in medium supplemented with addition of 0.1 mM glycine or 0.2 mM serine at day 12. Cell numbers were counted at day 12 and day 16; fold cell expansion is shown. (G) hPHOSPHO1 RNA expression in control and shRNA knocked-down cells that were assayed in panels D through F (n = 3 per group, mean + SEM).
Discussion
PHOSPHO1 has been extensively characterized as the phosphocholine and phosphoethanolamine phosphatase in bone, where the released phosphate group is important for bone mineralization.7,23 Moreover, genetic variations in PHOSPHO1 combined with other genetic mutations may be important in β-thalassemia and abnormal MCV because single-nucleotide mutations associated with these abnormalities have been reported to correspond to altered PHOSPHO1 expression levels in trans-expression quantitative trait locus meta-analysis.24
Our results show that PHOSPHO1 affects key aspects both of phospholipid biogenesis and intermediary metabolism during terminal erythropoiesis in both mice and humans. We observed a decrease in PC and an increase in SM levels in erythroblast lipid composition during terminal erythropoiesis (Figure 1C) The decline of PC may be indicative of organelle membrane reorganization or shedding within erythroblasts, given the higher proportion of PC in the membranes of the endoplasmic reticulum and the Golgi as compared with the plasma membrane.25,26 Also, lipid composition affects membrane structure. PCs have a large polar head group and tend to form a nearly cylindrical structure whereas phosphatidylethanolamines have a smaller head group and form a conical molecule. SMs have a narrower fatty acid tail and are able to form taller and narrower cylinders than PCs of the same chain length and pack more tightly.25 Thus, diminishing the proportion of PC and increasing that of SM would alter the curvature of the membrane and cause the membrane to tighten and condense, reducing erythroblast size during terminal erythropoiesis as these cells undergo morphologic changes, organelle removal, and enucleation. Therefore, changes in the lipid composition may be important for synchronizing the major changes in subcellular organelles that occur during in terminal erythropoiesis.
We identified PHOSPHO1 as one of the regulators that coordinate the change of lipid composition during erythroblasts differentiation; depletion of PHOSPHO1 impairs the terminal differentiation of both mouse and human erythroblasts (Figures 1F-G, 2, 3, and 6D-E). Although we observed changes in lipid composition in PHOSPHO1 KO red cells, the changes in amounts of PC and SM in PHOSPHO1 KO red cells were negligible (supplemental Figure 1A). This is consistent with the seemingly normal size of PHOSPHO1 KO red cells and erythroblasts (supplemental Figure 1B; Figure 4B). Phospho1-KO red cells showed an increased lysophosphatidylcholine ratio (supplemental Figure 1); however, hemolytic anemia was not observed in adult KO mice under laboratory conditions. This indicates that a loss of PHOSPHO1 is irrelevant to hemolysis induced by unbalanced lipid composition and that the function of PHOSPHO1 extends beyond simply affecting the phospholipid composition. Indeed, we found that PHOSPHO1 is important in energy and glycine metabolism during erythropoiesis.
Metabolic reprogramming regulates the differentiation of hematopoietic cells.27,28 Normal hematopoietic stem cells rely on fatty acid oxidation for self-renewal and switch to oxidative phosphorylation to promote lineage commitment.29,30 Following commitment, glutamine metabolism stimulates the differentiation of erythrocytes, and oxidative phosphorylation becomes the dominant source of ATP. Expression of mitochondrial proteins is upregulated to facilitate this increase in oxidative phosphorylation and to meet the nutrient and energy demands of the cell.31-33 In agreement with this, our findings show that oxidative phosphorylation is important during normal erythropoiesis. PHOSPHO1 KO cells, in contrast, demonstrated a reduced oxidative phosphorylation capacity and a concomitant reduction in their proliferation rate (Figures 2D and 4D). Although we did not determine which energy fuel is favored in cells during terminal erythropoiesis, we did observe that lipid accumulates in oxidative phosphorylation impaired PHOSPHO1 KO cells (Figure 4A), suggesting that lipids are a fuel used by erythroblasts at that stage.
Glycolysis replaced oxidative phosphorylation in PHOSPHO1 KO erythroid progenitors (Figure 4D-E) and the increase in glycolysis (the Embden–Meyerhof–Parnas pathway) in KO erythroid progenitors was used for the production of serine and glycine at the expense of ATP production (Figure 5C-G). Many cancers shunt their energy metabolism to glycolysis to produce serine and glycine for sustaining rapid proliferation, and it seems that PHOSPHO1 KO cells use this same pathway for cell survival.21,34
We hypothesize that glycine and serine are essential for protein synthesis in terminal erythroblasts, and that this is especially true for hemoglobin because the first step in producing heme depends upon the condensation of glycine and succinyl-CoA.35,36 To obtain the needed glycine, normal erythroblasts rely upon both de novo glycine synthesis and extracellular glycine.37 Although proteins such as glycine transporter 1 (GlyT1) and Band3 have known glycine-transporting properties, the mechanism by which de novo glycine synthesis contributes to the glycine supply is unclear.38 Our results demonstrate that PHOSPHO1 and the glycolytic pathway both contribute to de novo glycine synthesis. Interestingly, 2-DG has also been reported to promote erythropoiesis by shunting glycolysis to the pentose phosphate pathway (PPP),31 illustrating the flexibility of glycolysis and the importance of the phosphocholine hydrolysis pathway as an alternative glycine source during erythropoiesis.
The online version of this article contains a data supplement.
The publication costs of this article were defrayed in part by page charge payment. Therefore, and solely to indicate this fact, this article is hereby marked “advertisement” in accordance with 18 USC section 1734.
Acknowledgments
The authors thank members of the Lodish laboratory for fruitful discussions, and Tony Chavarria and Ferenc Reinhardt for mouse husbandry.
This work was supported by Defense Advanced Research Projects Agency contract HR0011-14-2-0005 and by National Institutes of Health, National Heart, Lung, and Blood Institute grant 2 P01 HL032262-25.
Authorship
Contribution: N.-J.H. designed and performed most experiments and analyzed the data; N.-J.H. and H.L. wrote the manuscript; Y.-C.L. isolated bone marrow and spleen from the mice and performed complete blood count measurements; C.-Y.L. performed mouse genotyping and prepared experiment materials; C.A.L. and E.F. performed LC/MS-based metabolomics; N.P. measured half-lives of red cells; and C.F. and J.L.M. provided the PHOSPHO1 KO mice for rederivation.
Conflict-of-interest disclosure: The authors declare no competing financial interests.
Correspondence: Harvey Lodish, Whitehead Institute for Biomedical Research, 455 Main St, Cambridge, MA 02142; e-mail: lodish@wi.mit.edu.


![Figure 3. mPHOSPHO1 is essential for stress erythropoiesis. (A) Measurements of complete blood counts from mice at indicated ages are plotted (n = 4 per group, mean + SEM). (B) Fewer Ter119+, CD71+ cells in the bone marrow of 7-week-old KO mice relative to WT mice (n = 3 per group, mean + SEM). Bone marrow cells were isolated and mature red cells were lysed before nucleated cells were stained with CD71 and Ter119 antibodies. (C) Elevated ratio of spleen to body weight of 5-week-old KO mice (n = 4 per group, mean + SEM). (D) Complete blood count measurements of 7-week-old WT and KO mice were performed during phenylhydrazine-induced anemia. Lower hematocrit of KO mice shows slower recovery of RBCs (n = 5 per group, mean ± SEM; analysis of variance [ANOVA] used for statistics). (E) Higher ratio of spleen to body weight of 7-week-old KO mice following 4 days of phenylhydrazine-induced stress erythropoiesis (n = 5 per group, mean + SEM, 2-way ANOVA were used to calculate the statistic significance). (F) Higher numbers of c-Kit+CD71+ cells in the spleens of KO mice at days 3 and 13 post-phenylhydrazine injection (n = 3 per group, mean + SEM). (G) Higher numbers of CD71+, Ter119+ cells in the spleens of KO mice at days 3 and 13 post-phenylhydrazine injection (n = 3 per group, mean + SEM). NS, not significant.](https://ash.silverchair-cdn.com/ash/content_public/journal/blood/131/26/10.1182_blood-2018-03-838516/4/m_blood838516f3.jpeg?Expires=1768181260&Signature=OO9qsjxzkTsocNqTCMMzeigwAYufbip~Vul9R48zRG9~zqntcyvgi9rRf0AjORmaDkI7qiA7w-XhvmdFr66UZYMEbE82p8Nepqlyljmz-WwijbBZSfPP9cHLsHMBRsPqtd4hHjy5-5vGjRpUJE4dtDOEBwp85TODbxIlC1XLB~-IvBgSBgQe0wT0CgQNp2oWIa0RsCOd1rPhR3pvPCDgh~DRMxUt1QtZO0at4WLIx28KW7uYYJNK07mLJJ6zBteCgINgbDUY20Gvzx9MuGGKwZW7wl1rRZ7T0KeWBT2RW9KRwNY~LLjSyAYzkqB7SOW5DtpWbKg87Ze7keRzbThlGw__&Key-Pair-Id=APKAIE5G5CRDK6RD3PGA)


![Figure 3. mPHOSPHO1 is essential for stress erythropoiesis. (A) Measurements of complete blood counts from mice at indicated ages are plotted (n = 4 per group, mean + SEM). (B) Fewer Ter119+, CD71+ cells in the bone marrow of 7-week-old KO mice relative to WT mice (n = 3 per group, mean + SEM). Bone marrow cells were isolated and mature red cells were lysed before nucleated cells were stained with CD71 and Ter119 antibodies. (C) Elevated ratio of spleen to body weight of 5-week-old KO mice (n = 4 per group, mean + SEM). (D) Complete blood count measurements of 7-week-old WT and KO mice were performed during phenylhydrazine-induced anemia. Lower hematocrit of KO mice shows slower recovery of RBCs (n = 5 per group, mean ± SEM; analysis of variance [ANOVA] used for statistics). (E) Higher ratio of spleen to body weight of 7-week-old KO mice following 4 days of phenylhydrazine-induced stress erythropoiesis (n = 5 per group, mean + SEM, 2-way ANOVA were used to calculate the statistic significance). (F) Higher numbers of c-Kit+CD71+ cells in the spleens of KO mice at days 3 and 13 post-phenylhydrazine injection (n = 3 per group, mean + SEM). (G) Higher numbers of CD71+, Ter119+ cells in the spleens of KO mice at days 3 and 13 post-phenylhydrazine injection (n = 3 per group, mean + SEM). NS, not significant.](https://ash.silverchair-cdn.com/ash/content_public/journal/blood/131/26/10.1182_blood-2018-03-838516/4/m_blood838516f3.jpeg?Expires=1768887751&Signature=3S58oNR1QKjgdQ6kZrvIC-tY0ZqBafk8Wh7iIxJniMr7FmUV33kEZiDz9xhwjX1zOyDv9RlQXdIh8qC-r0iHOkW8RgXiOUbM0Y~j5HqGutmPf47bbvwZBMKBk5TjZP6H2XvHeK4~OzVp95Y9Tj02GWfCJF4F368TrhDdYD1bc6uEMRZeEkU49g8NLPKZkvrWAzk7Up8ObJdl6G79Zq7Q1shEmMTzhcg-4qGmtf~wX4S7JUjGcSVWWMZZj7fek8uwChf6dXTEkyPJNfsGk9ZKprDO9aLEjC065vJoTKP04ozJGpUDmeEVMo5fFMQRT5eBZ76MEKO4IAD~ip55N-mAqA__&Key-Pair-Id=APKAIE5G5CRDK6RD3PGA)
